nature
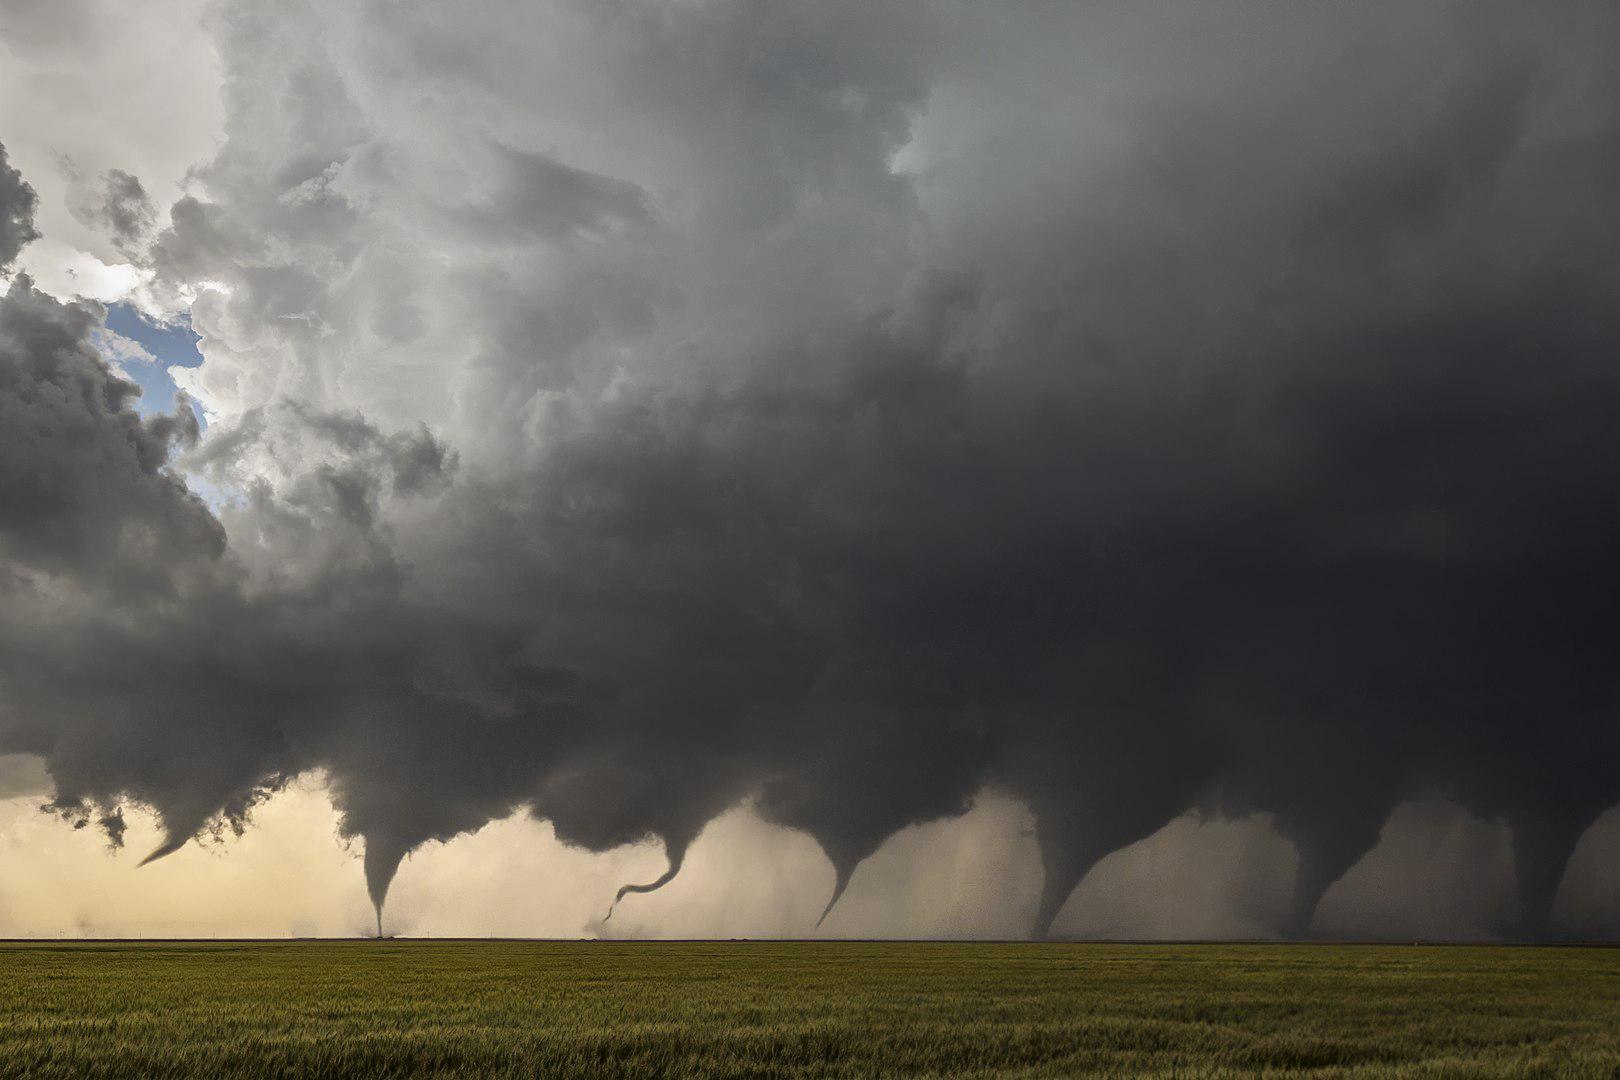
Technology designed to listen for atomic bombs can also hear tornadoes.
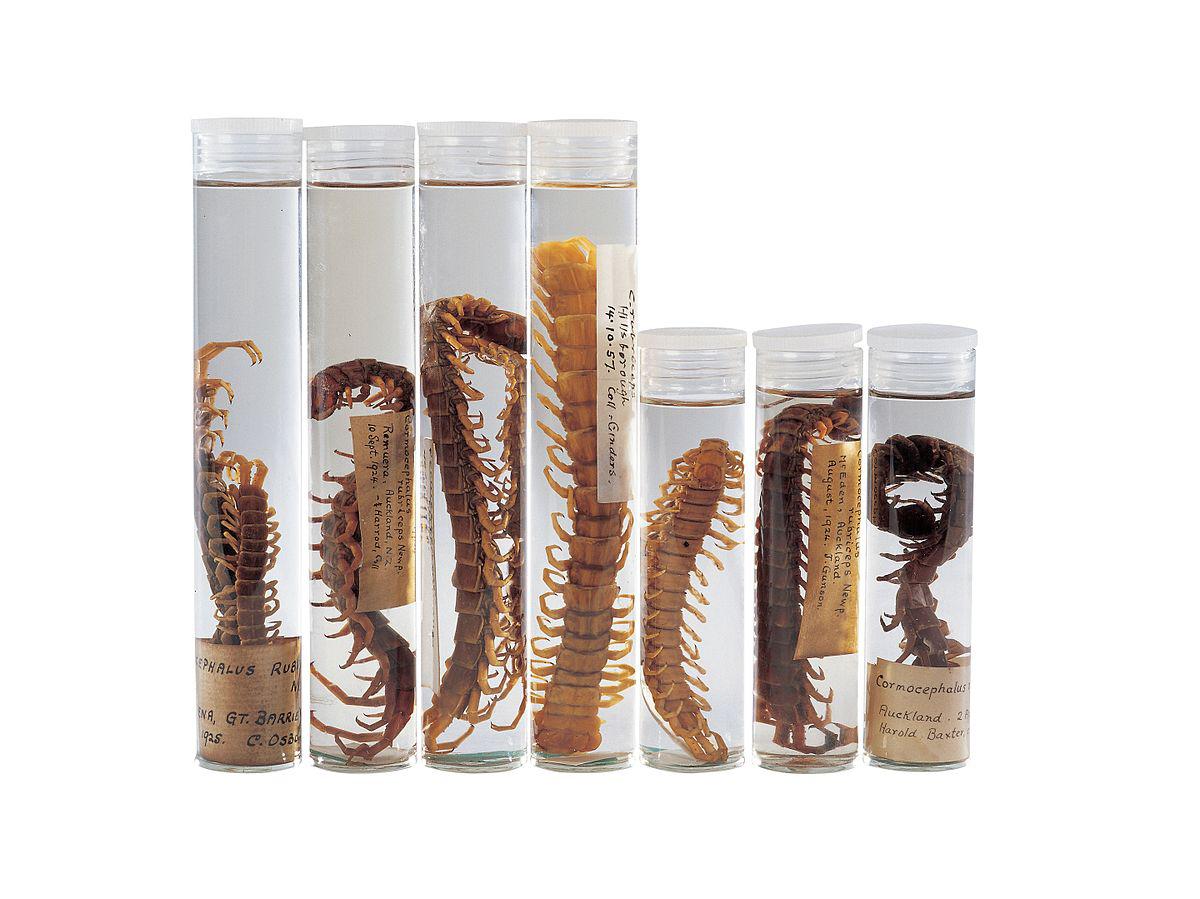
These enormous centipedes are straight out of science fiction.
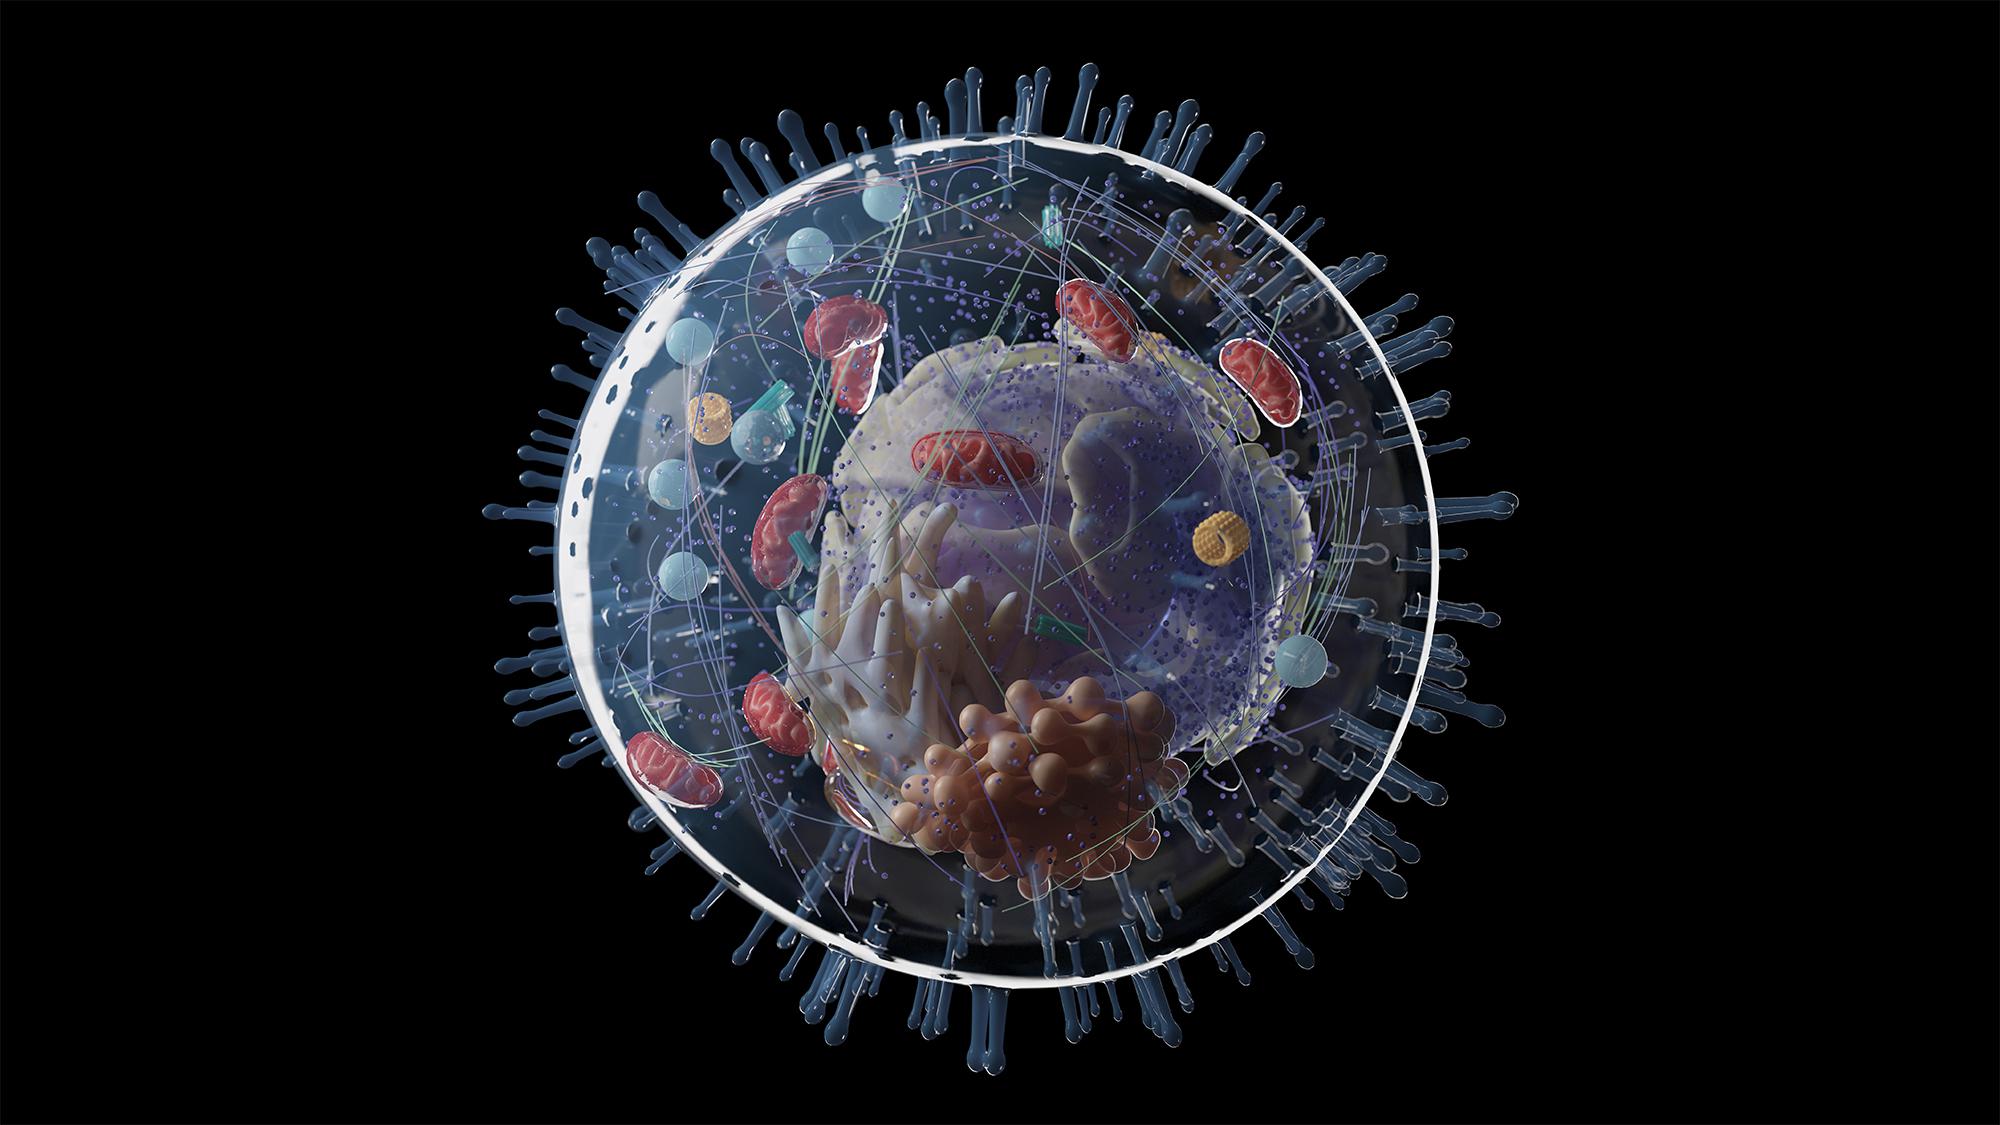
Three cutting-edge techniques – the gene-editing tool CRISPR, fluorescent proteins and optogenetics – were all inspired by nature.
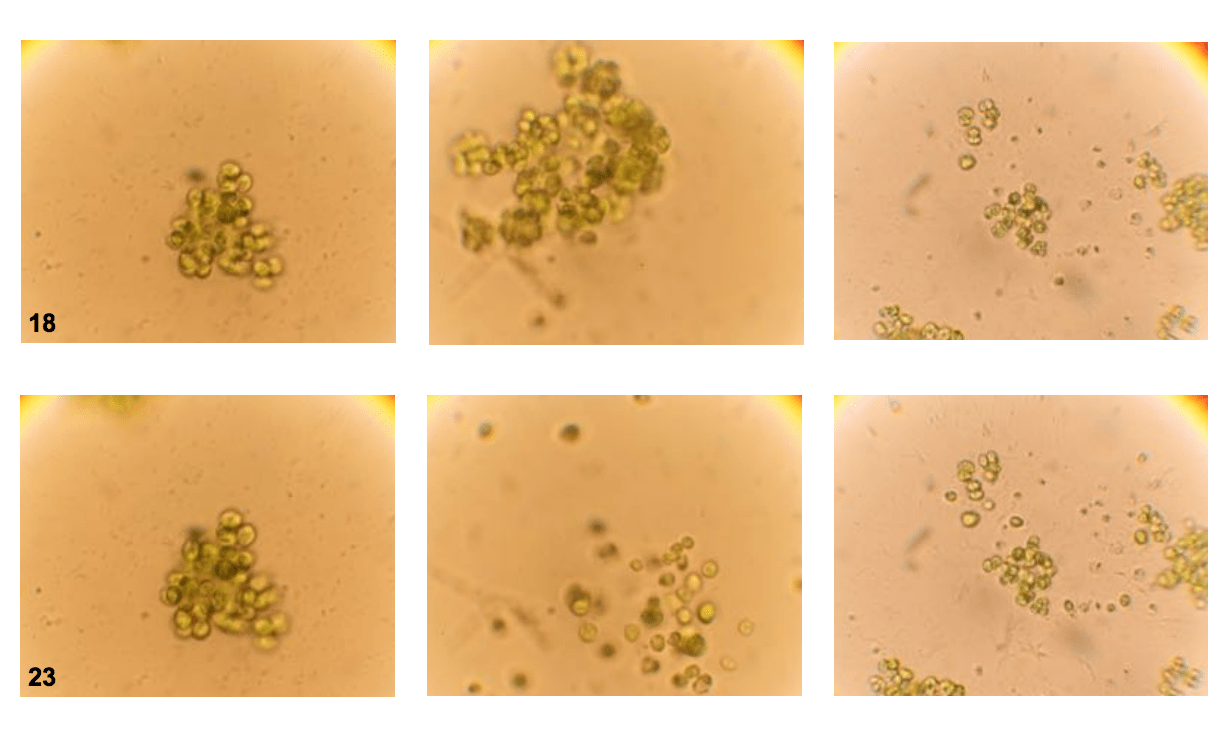
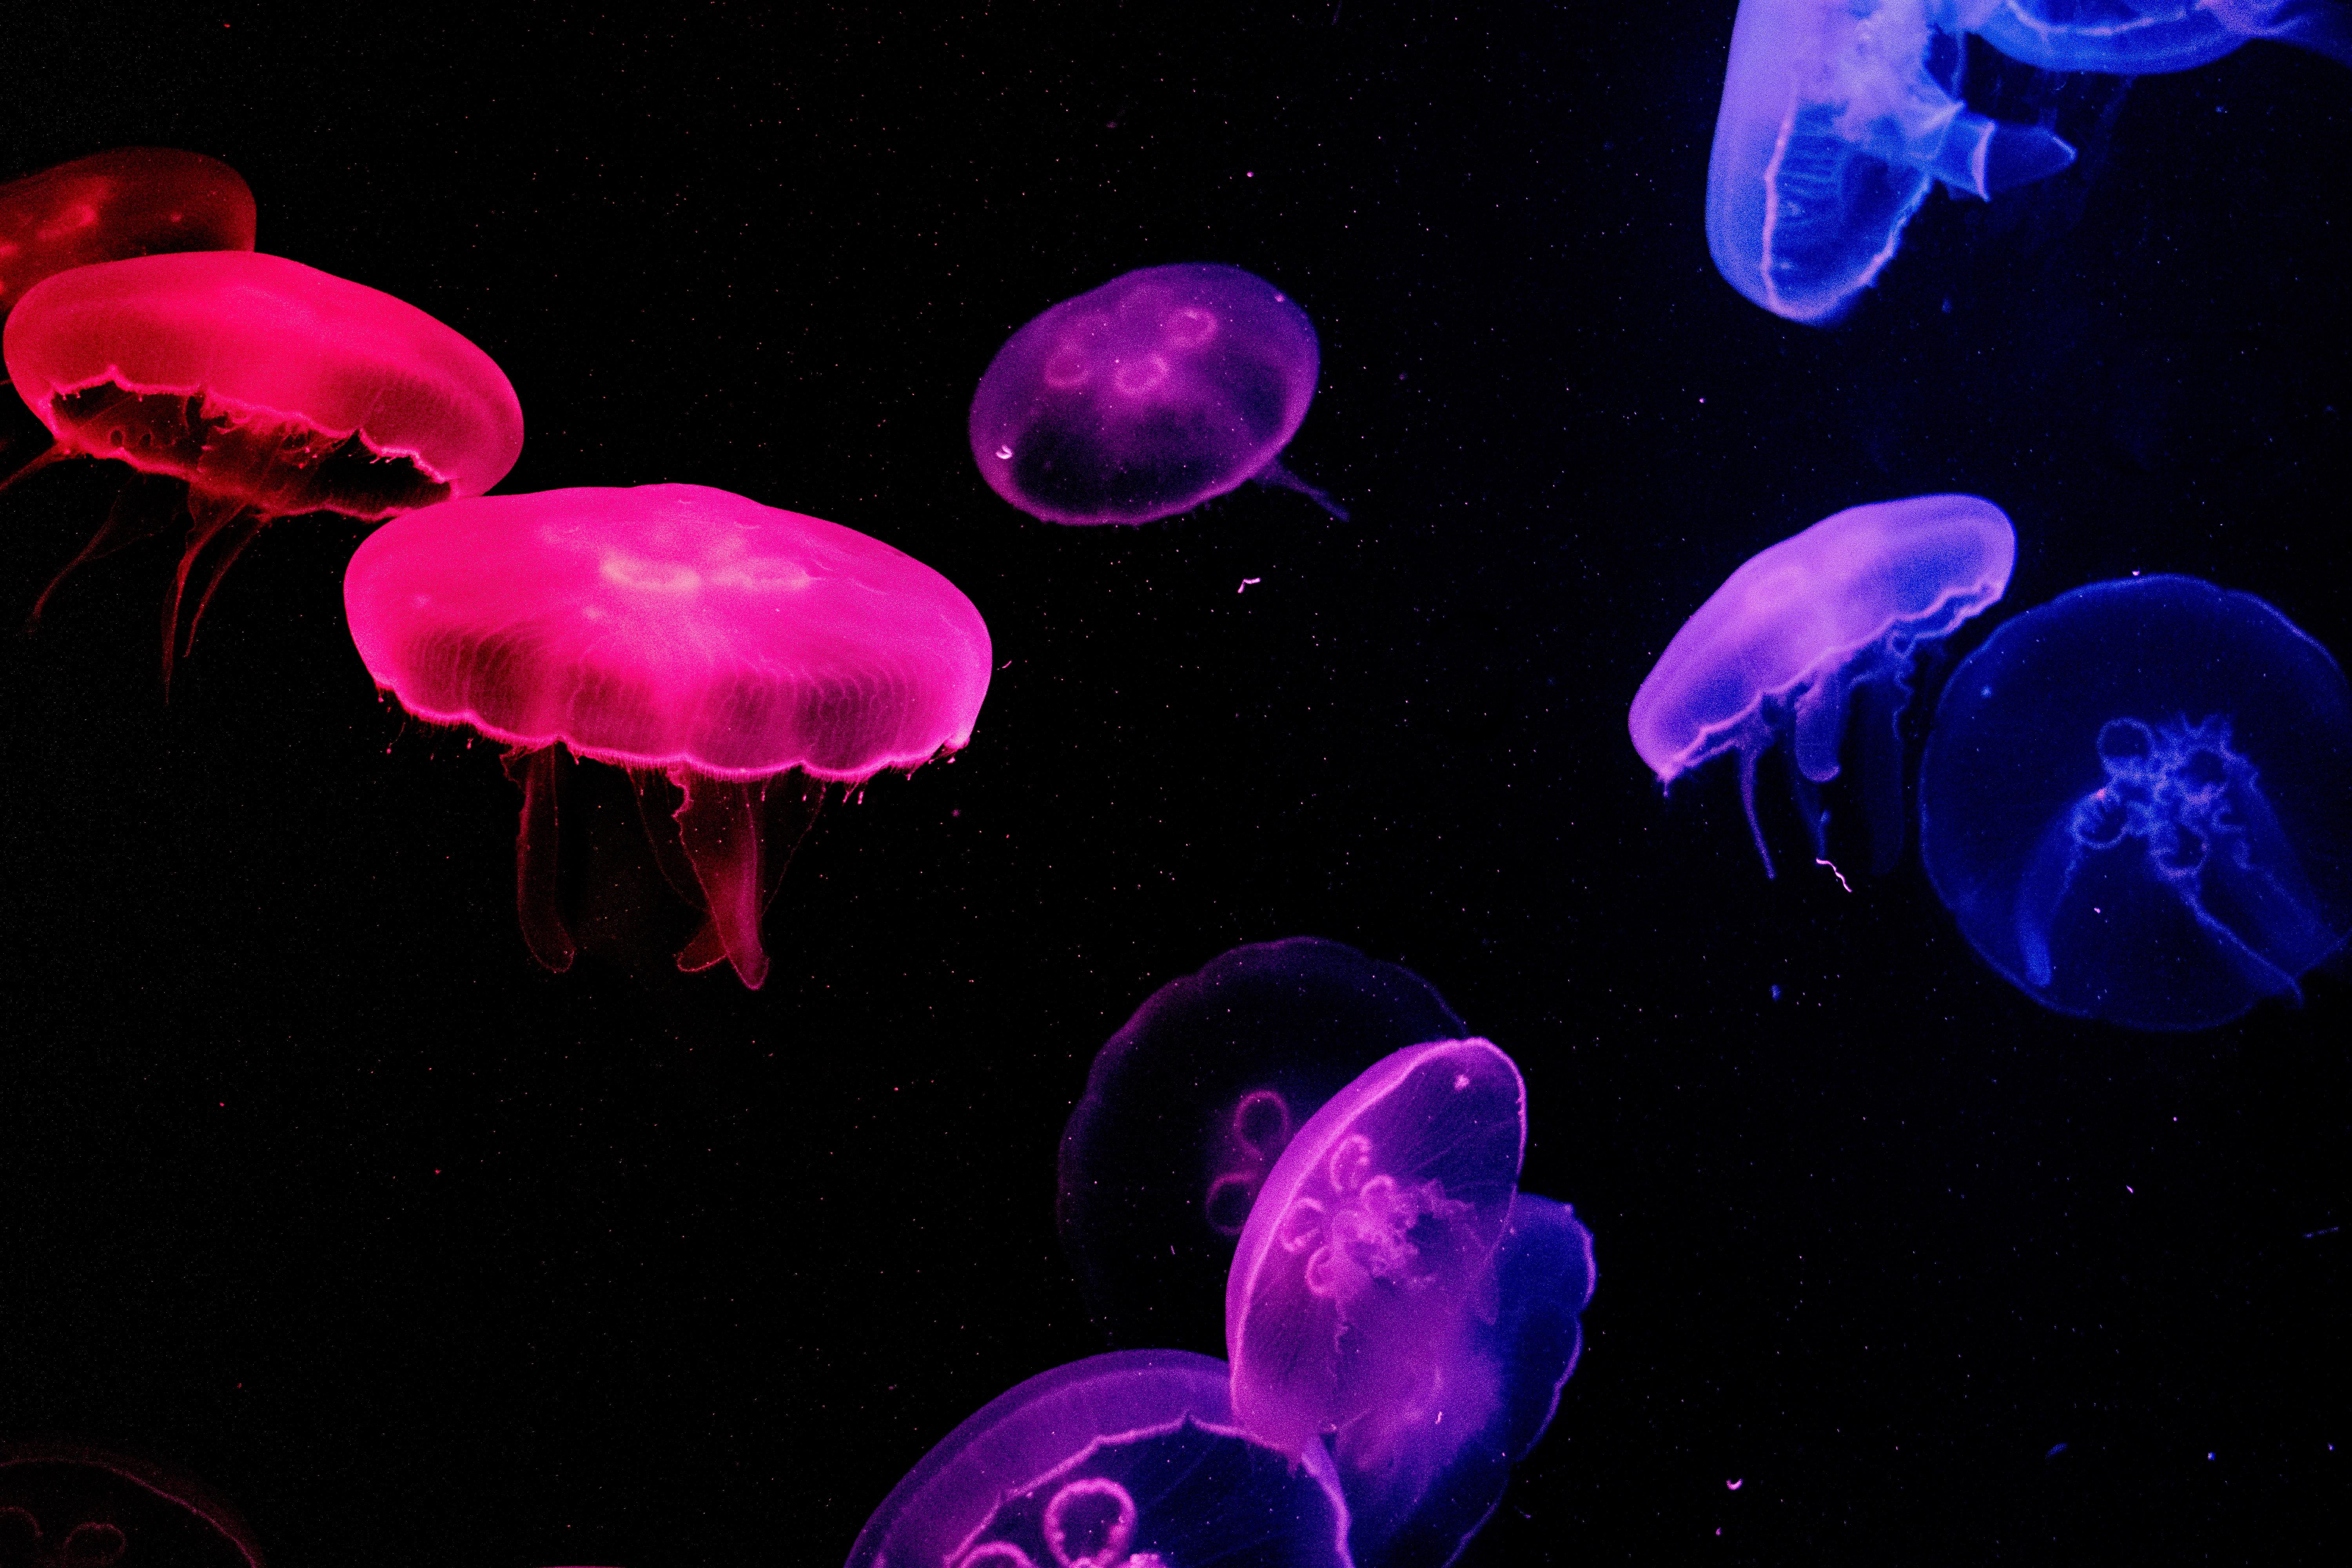
When facing a predator, single cells sometimes unite to defend themselves, paving the way for more complex multicellular life forms to evolve.
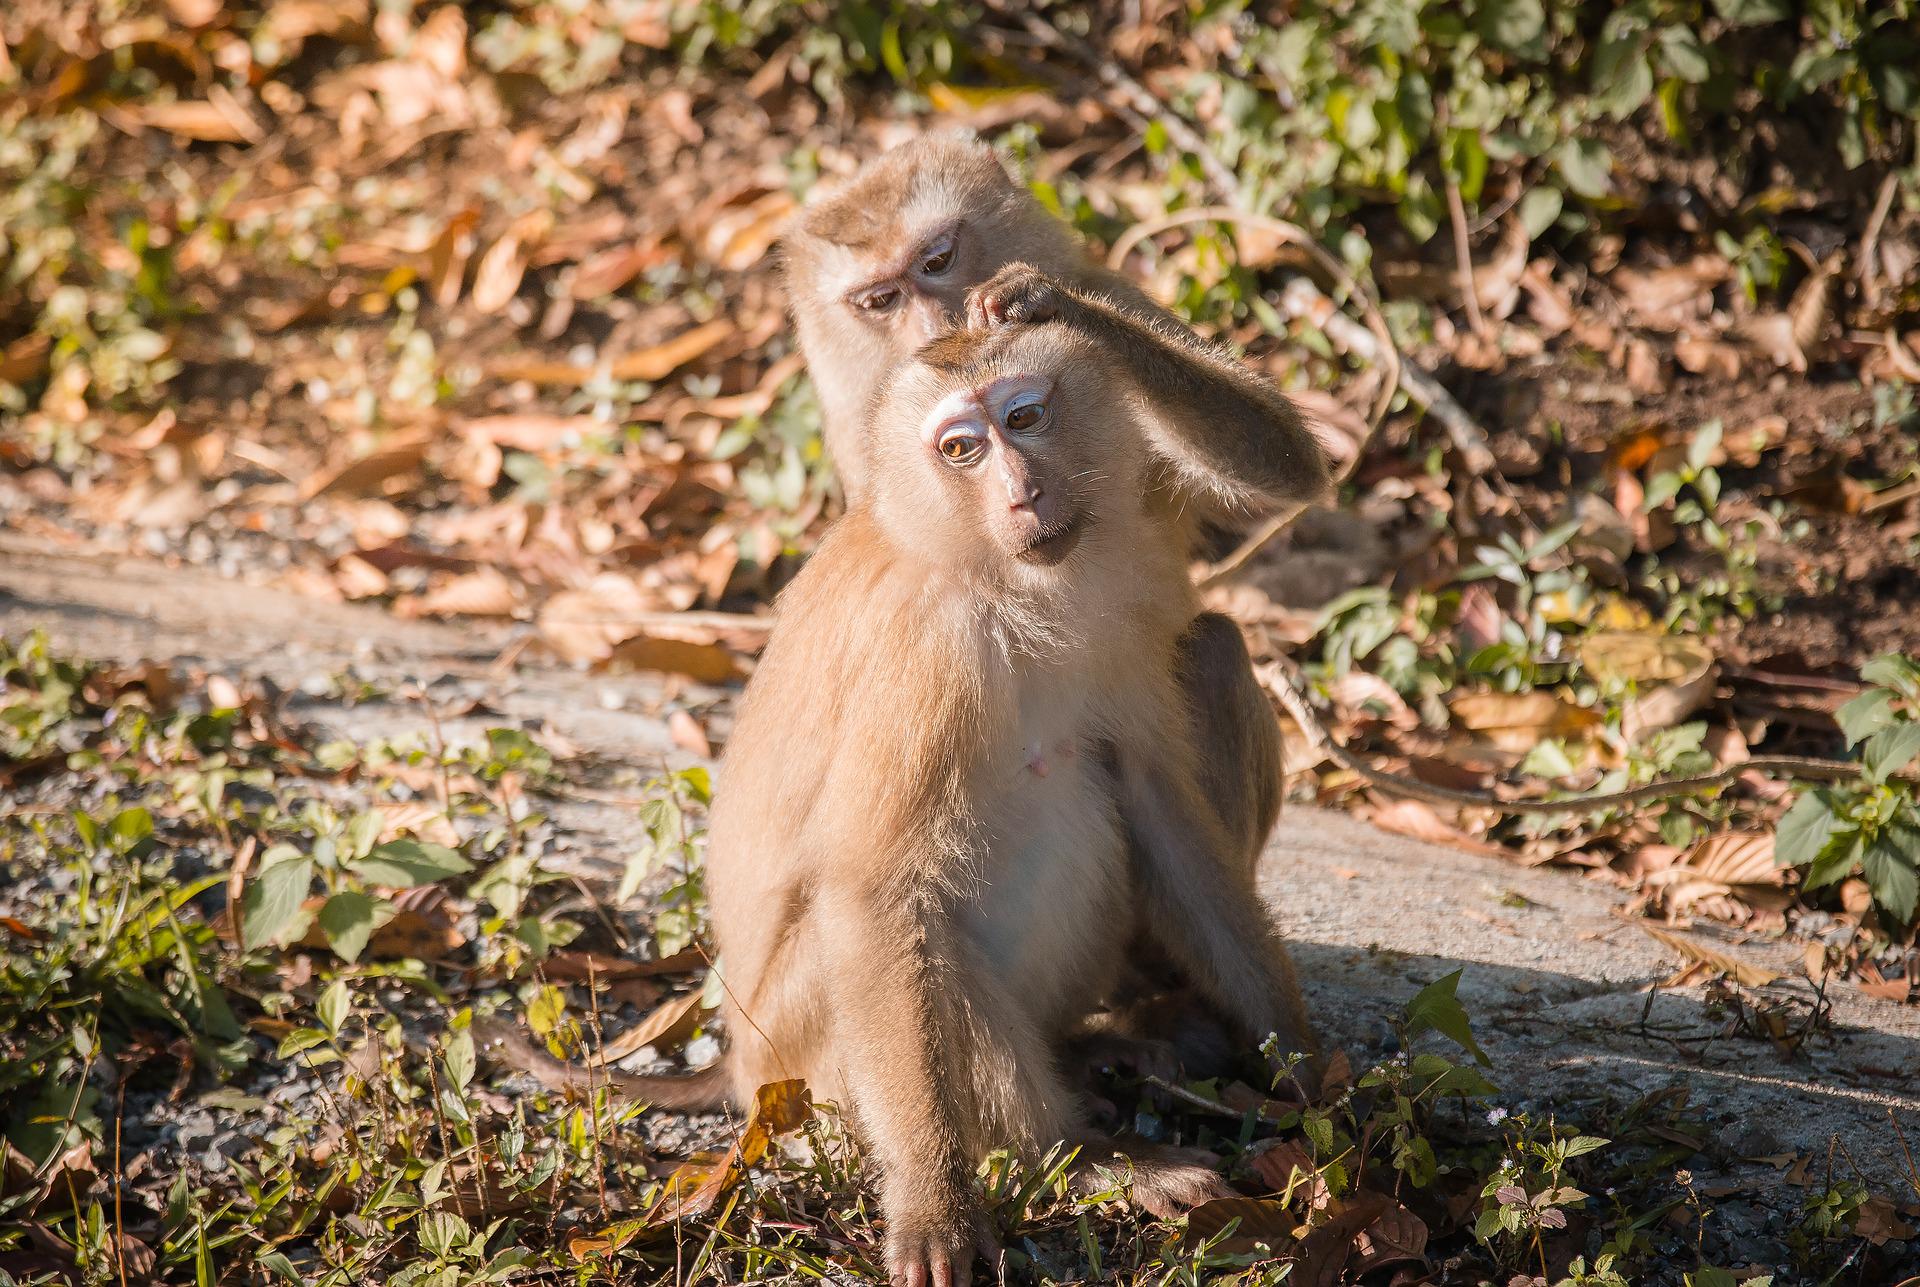
One man studied apes for 50 years. He says nature isn’t as cruel as you think.

He’s studied apes for 50 years – here’s what most people get wrong.
▸
6 min
—
with

Theoretical physicist Geoffrey West explains the science behind a unique hypothesis.

Geologists discover a rhythm to major geologic events.
Metal-like materials have been discovered in a very strange place.

A recent study of Iceland’s Krafla volcanic caldera suggests hidden magma pools may be lurking under many of the world’s volcanic systems.

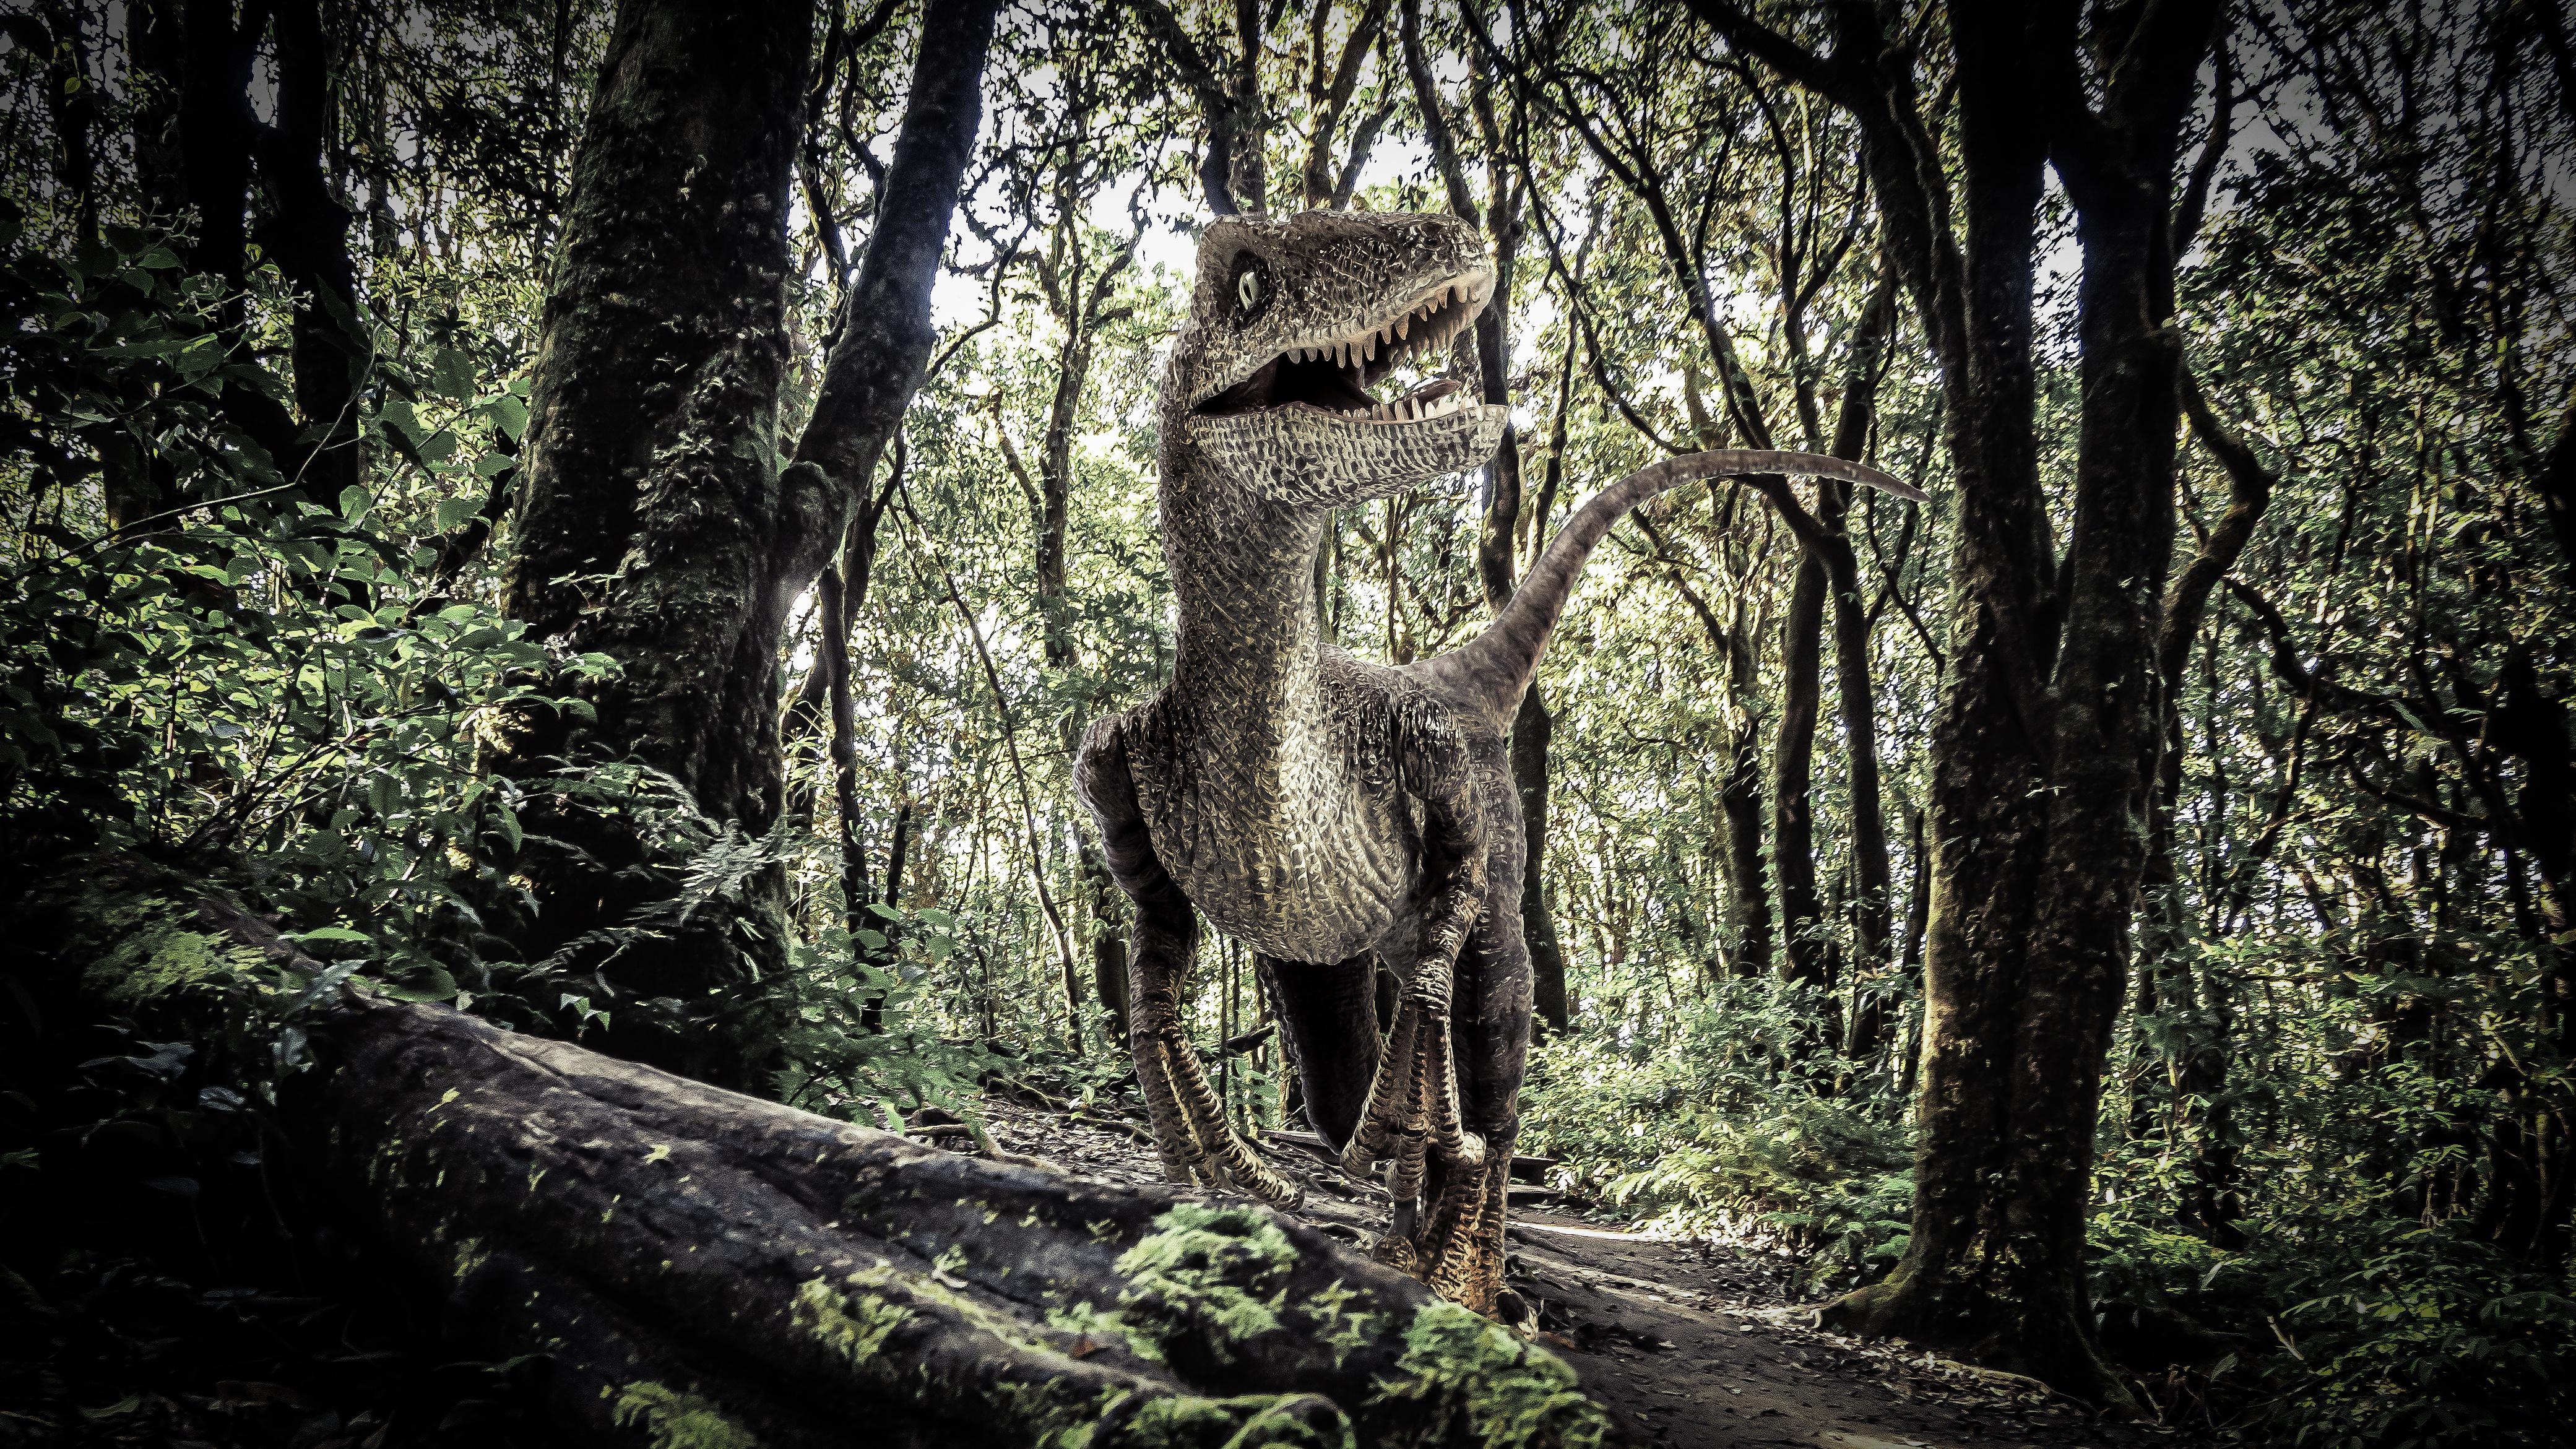
The ‘Monkeydactyl’ was a flying reptile that evolved highly specialized adaptations in the Mesozoic Era.

Satellite imagery can help better predict volcanic eruptions by monitoring changes in surface temperature near volcanoes.
The lush biodiversity of South America’s rainforests is rooted in one of the most cataclysmic events that ever struck Earth.

The uptick in Arctic lightning could cause more wildfires, potentially triggering a feedback loop that releases massive amounts of carbon into the atmosphere.

We’re cautiously optimistic about our new findings.

Snakes and mammals share common genetic building blocks necessary for producing venom.
75 years after Erwin Schrödinger’s prescient description of something like DNA, we still don’t know the “laws of life.”
Spirituality can be an uncomfortable word for atheists. But does it deserve the antagonism that it gets?
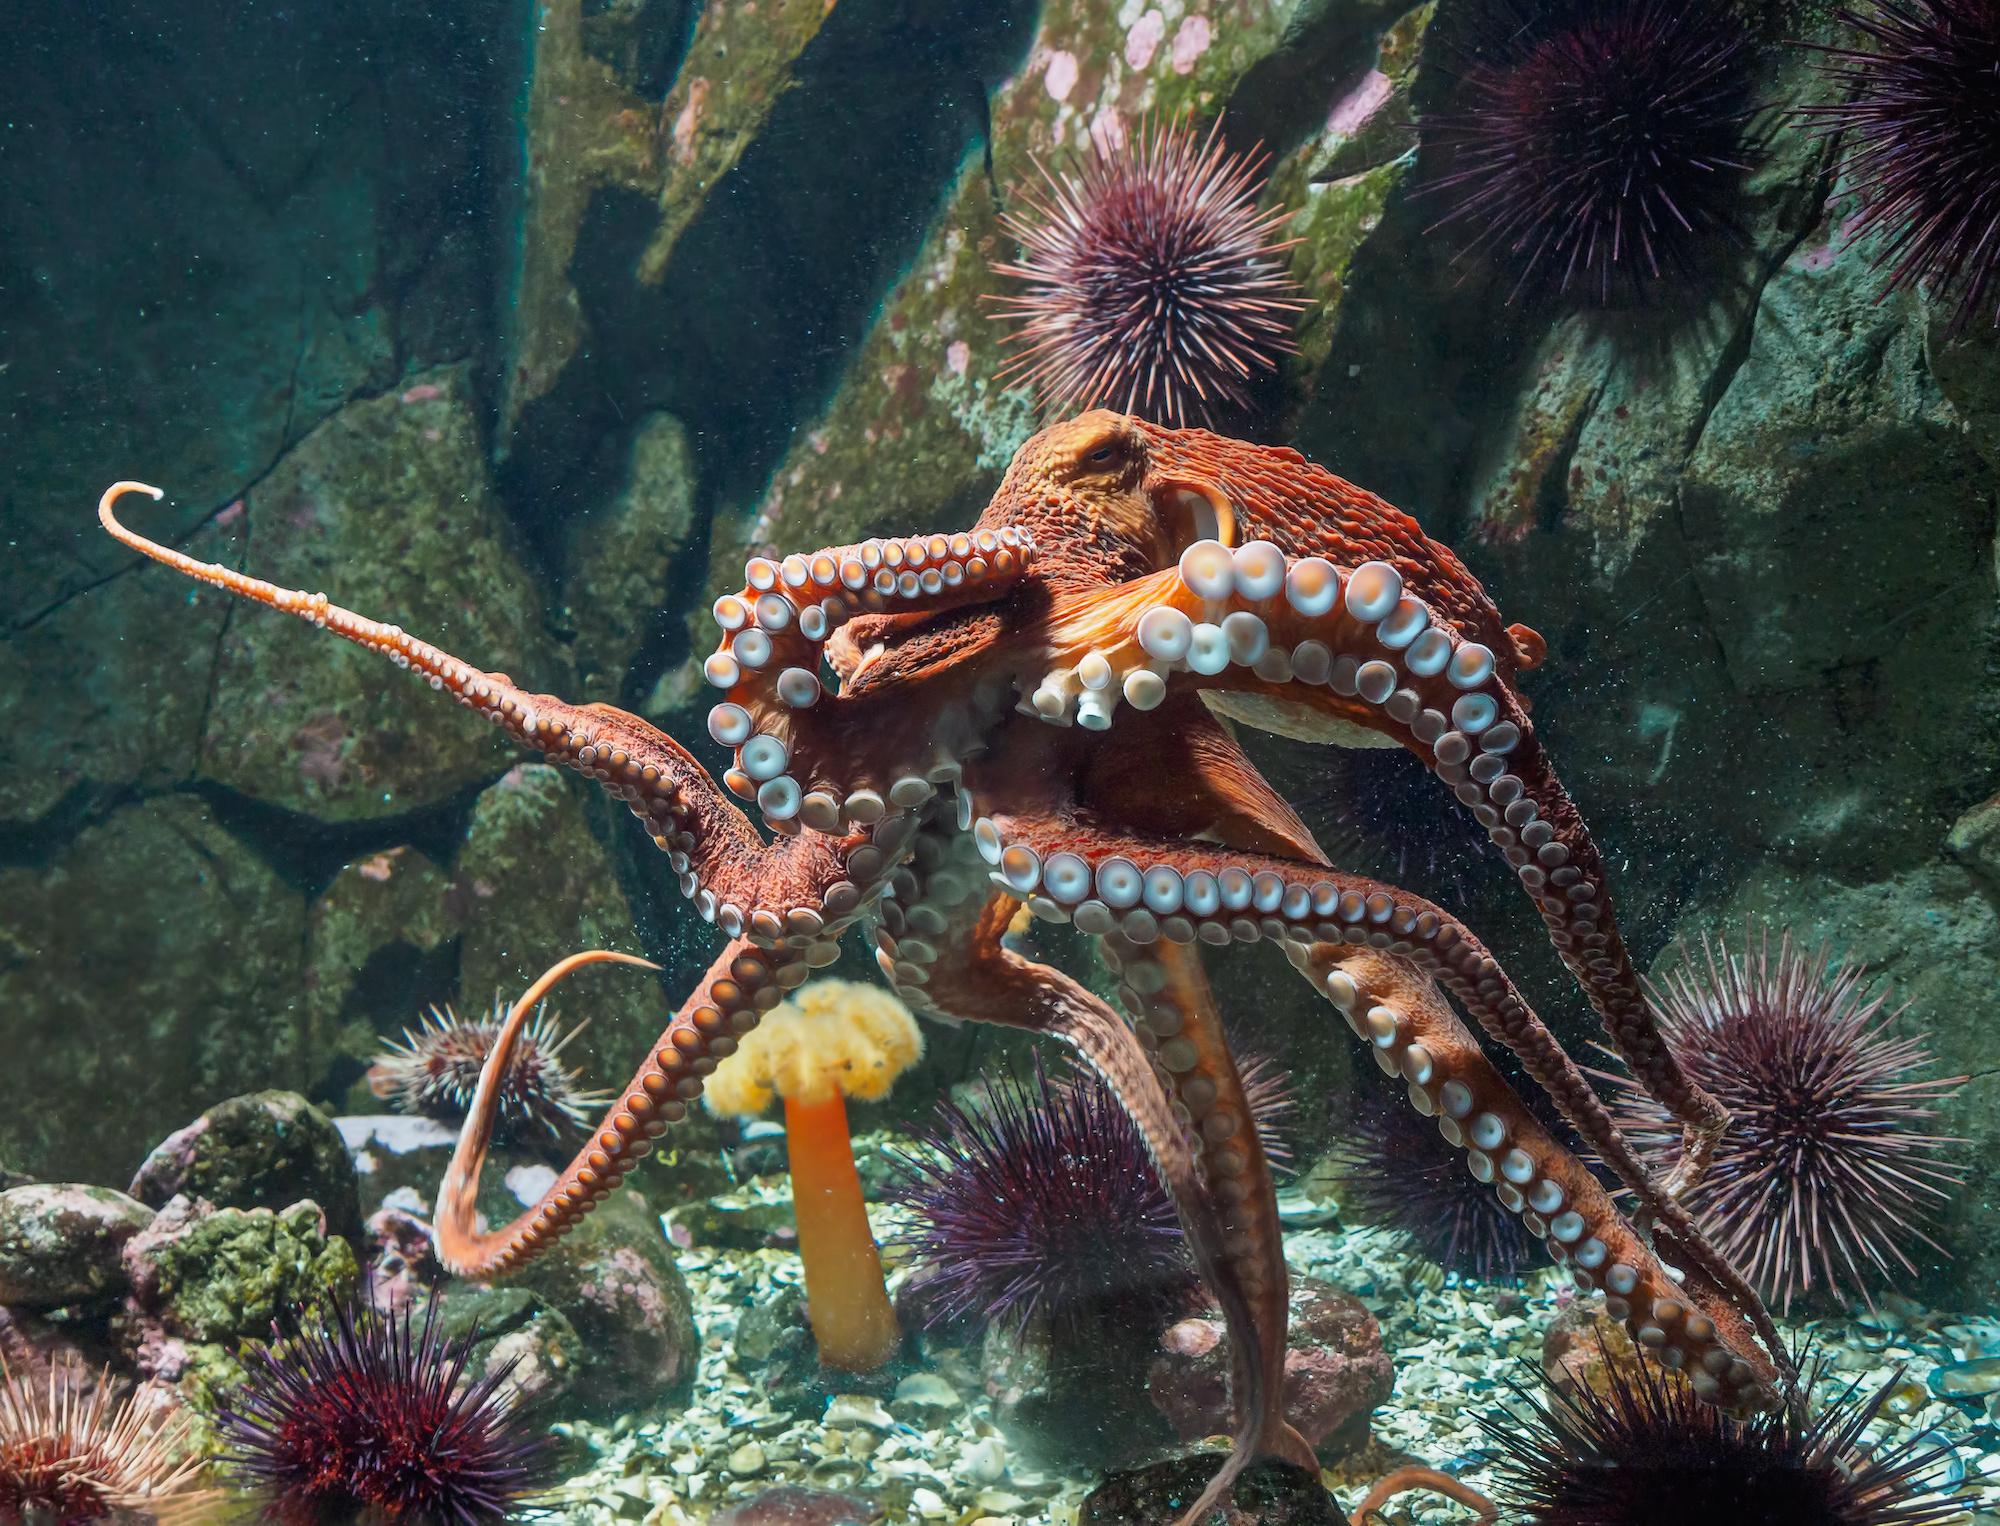
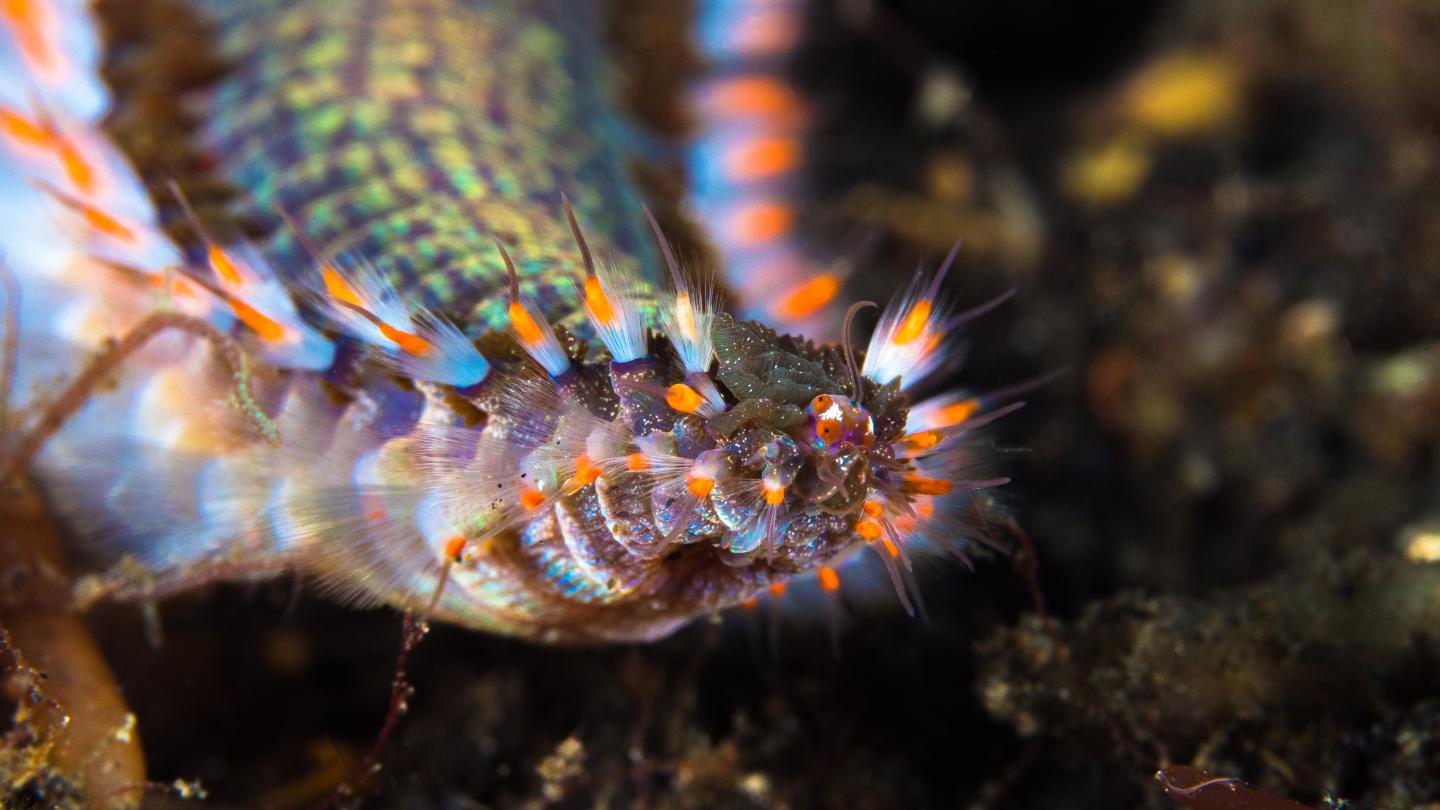
“Don’t tread on me” is a slogan of the deep sea, too.
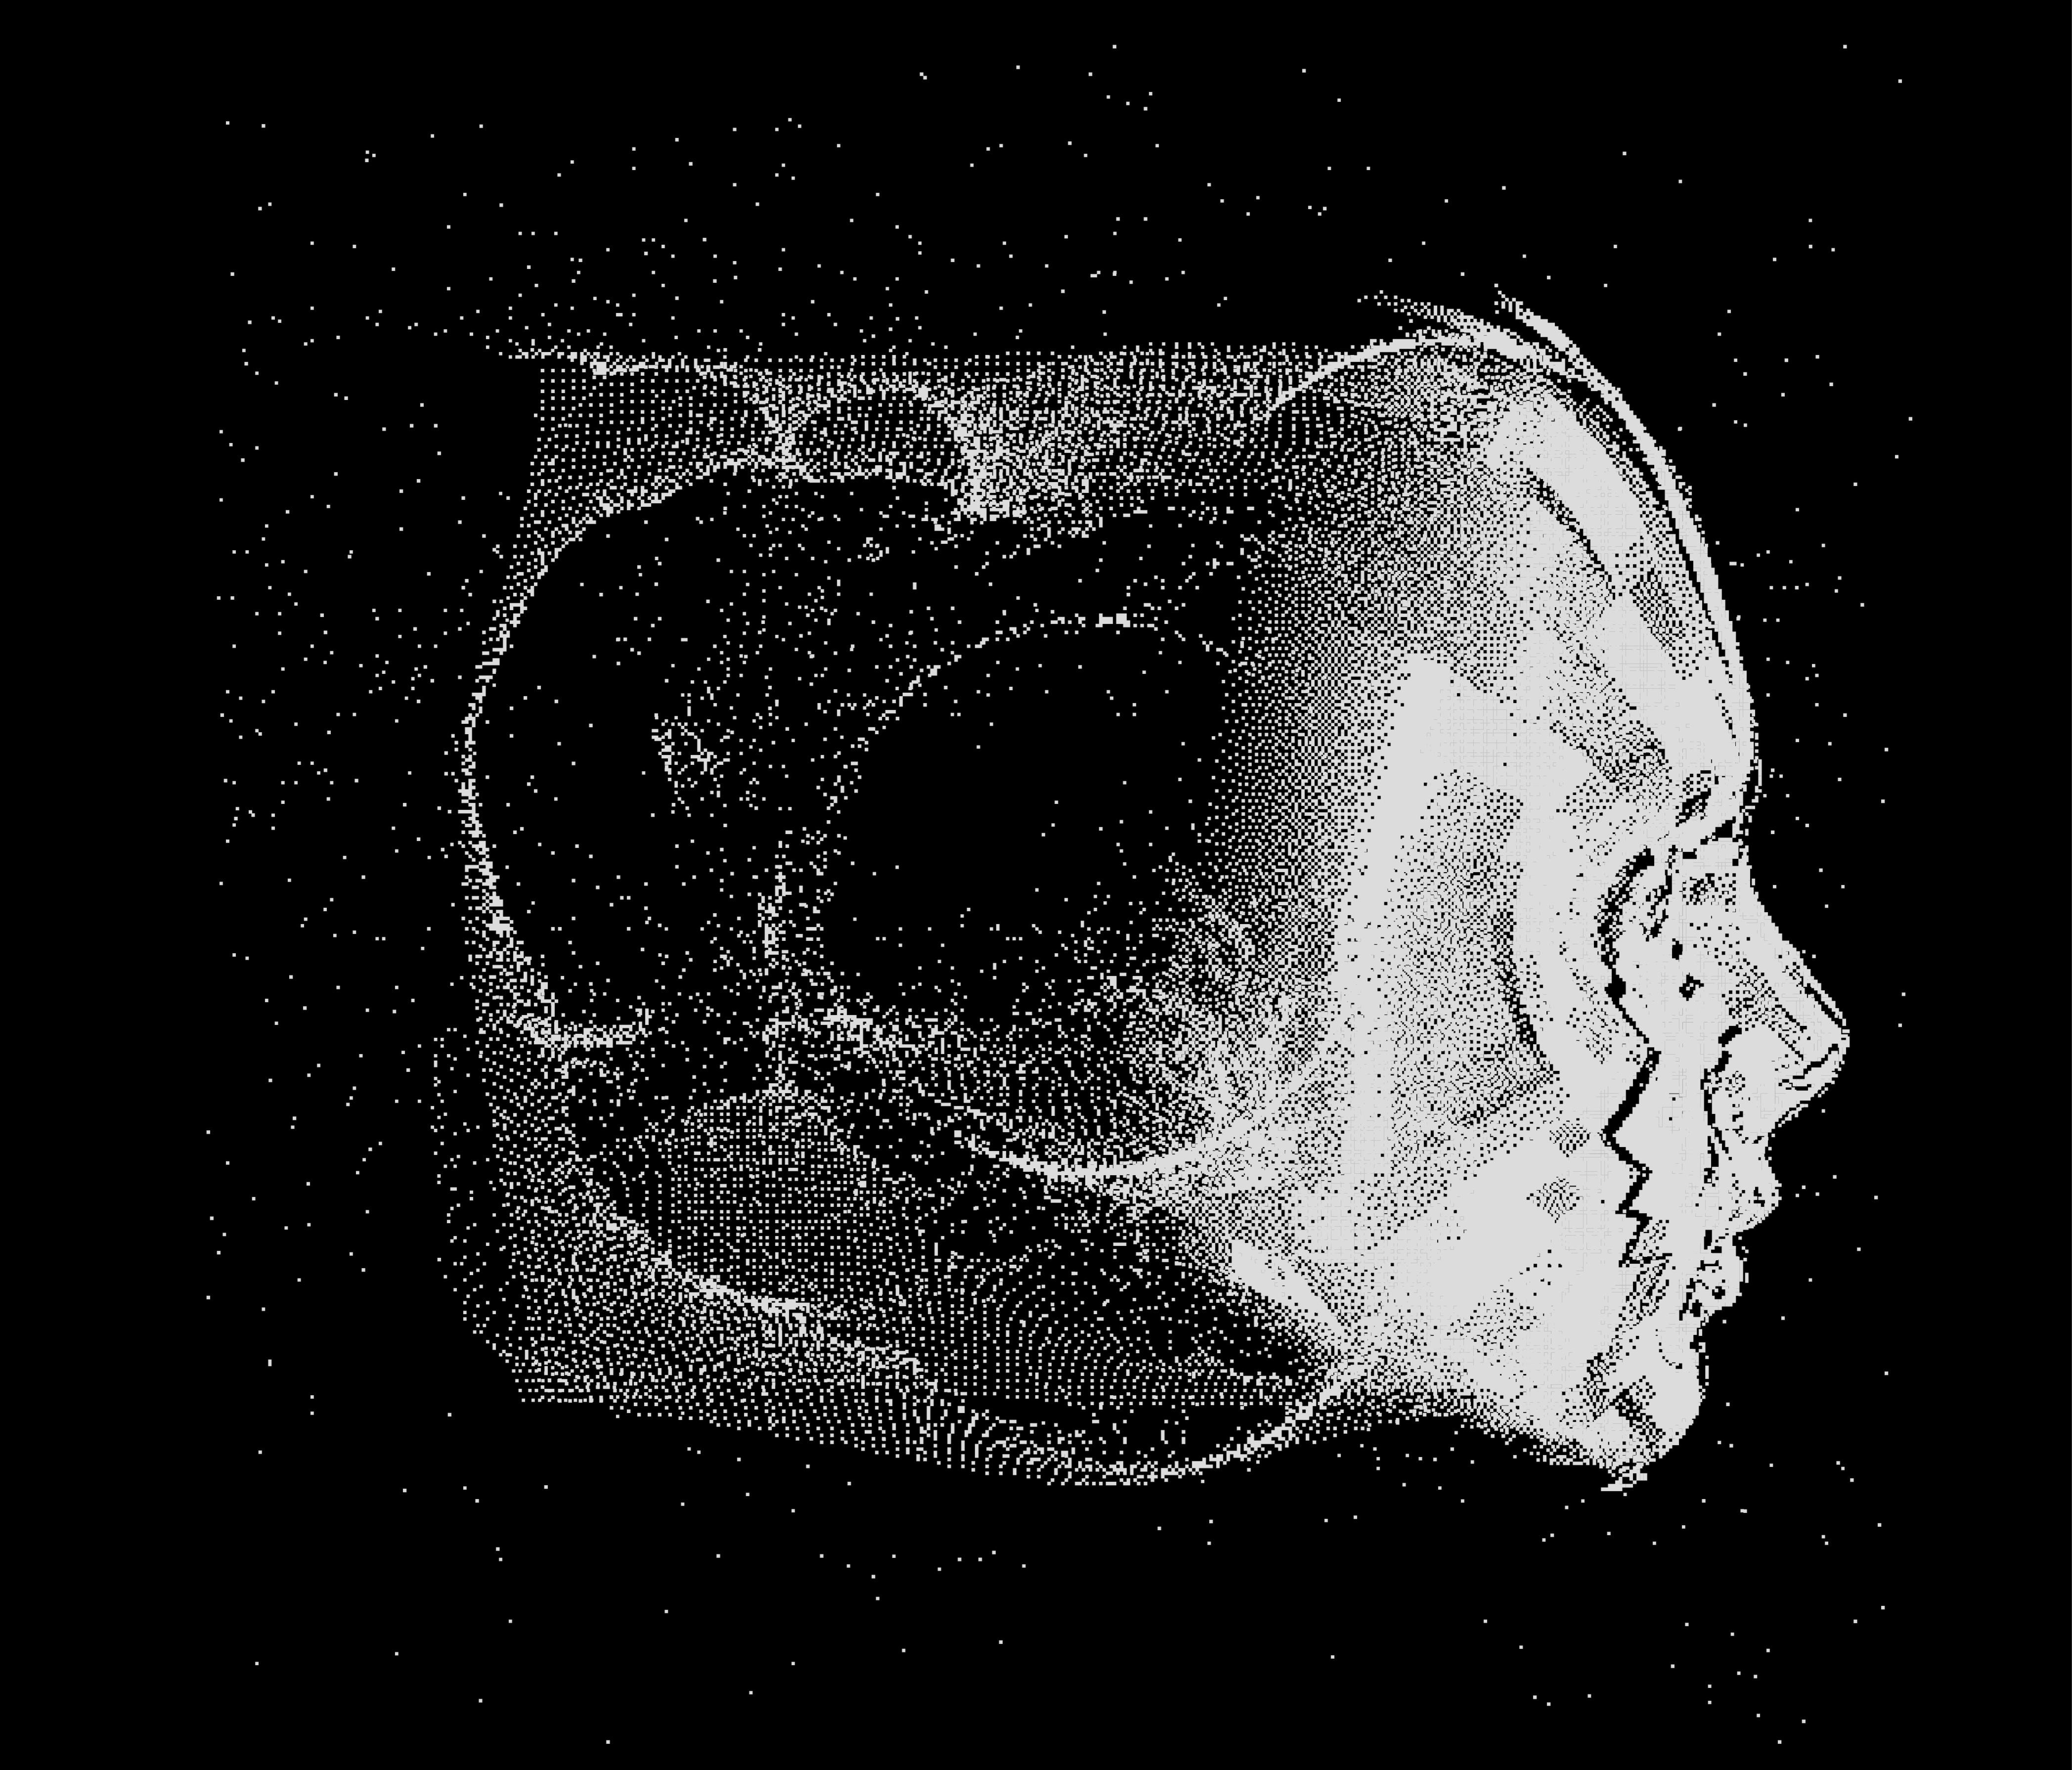
A physicist creates an AI algorithm that predicts natural events and may prove the simulation hypothesis.
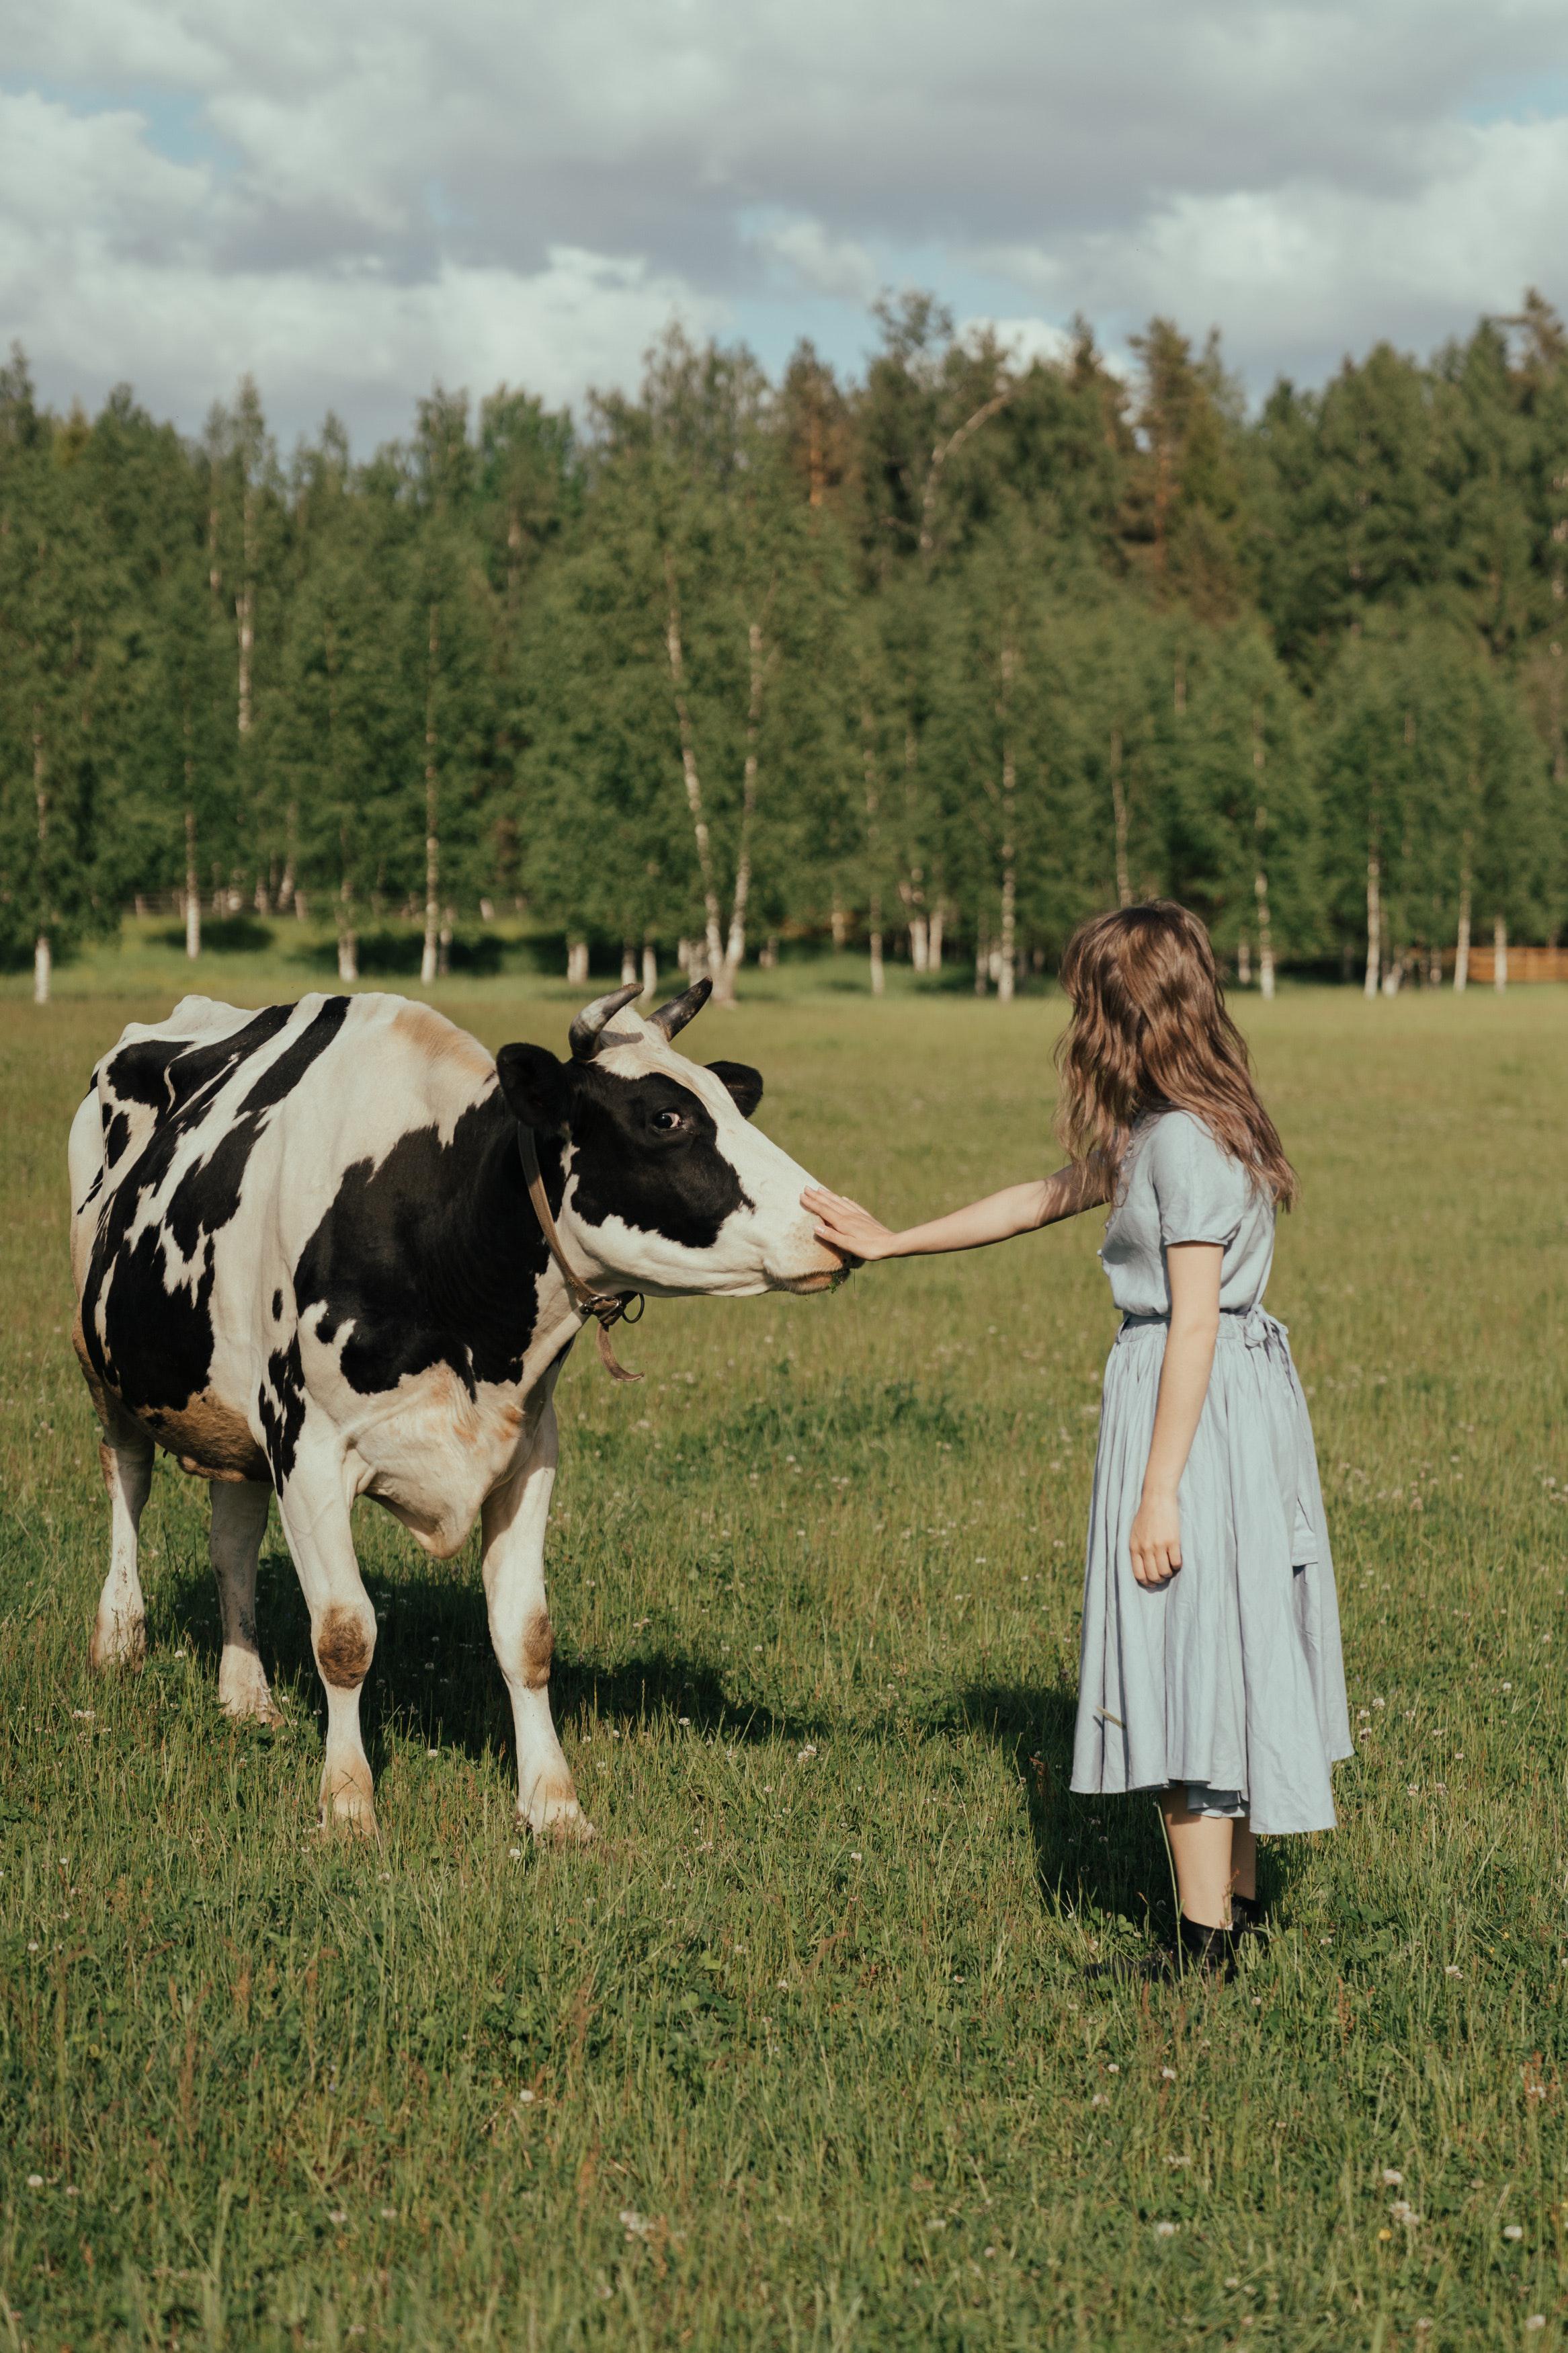
Cow cuddling is getting ever more popular, but what’s the science behind using animals for relaxation?
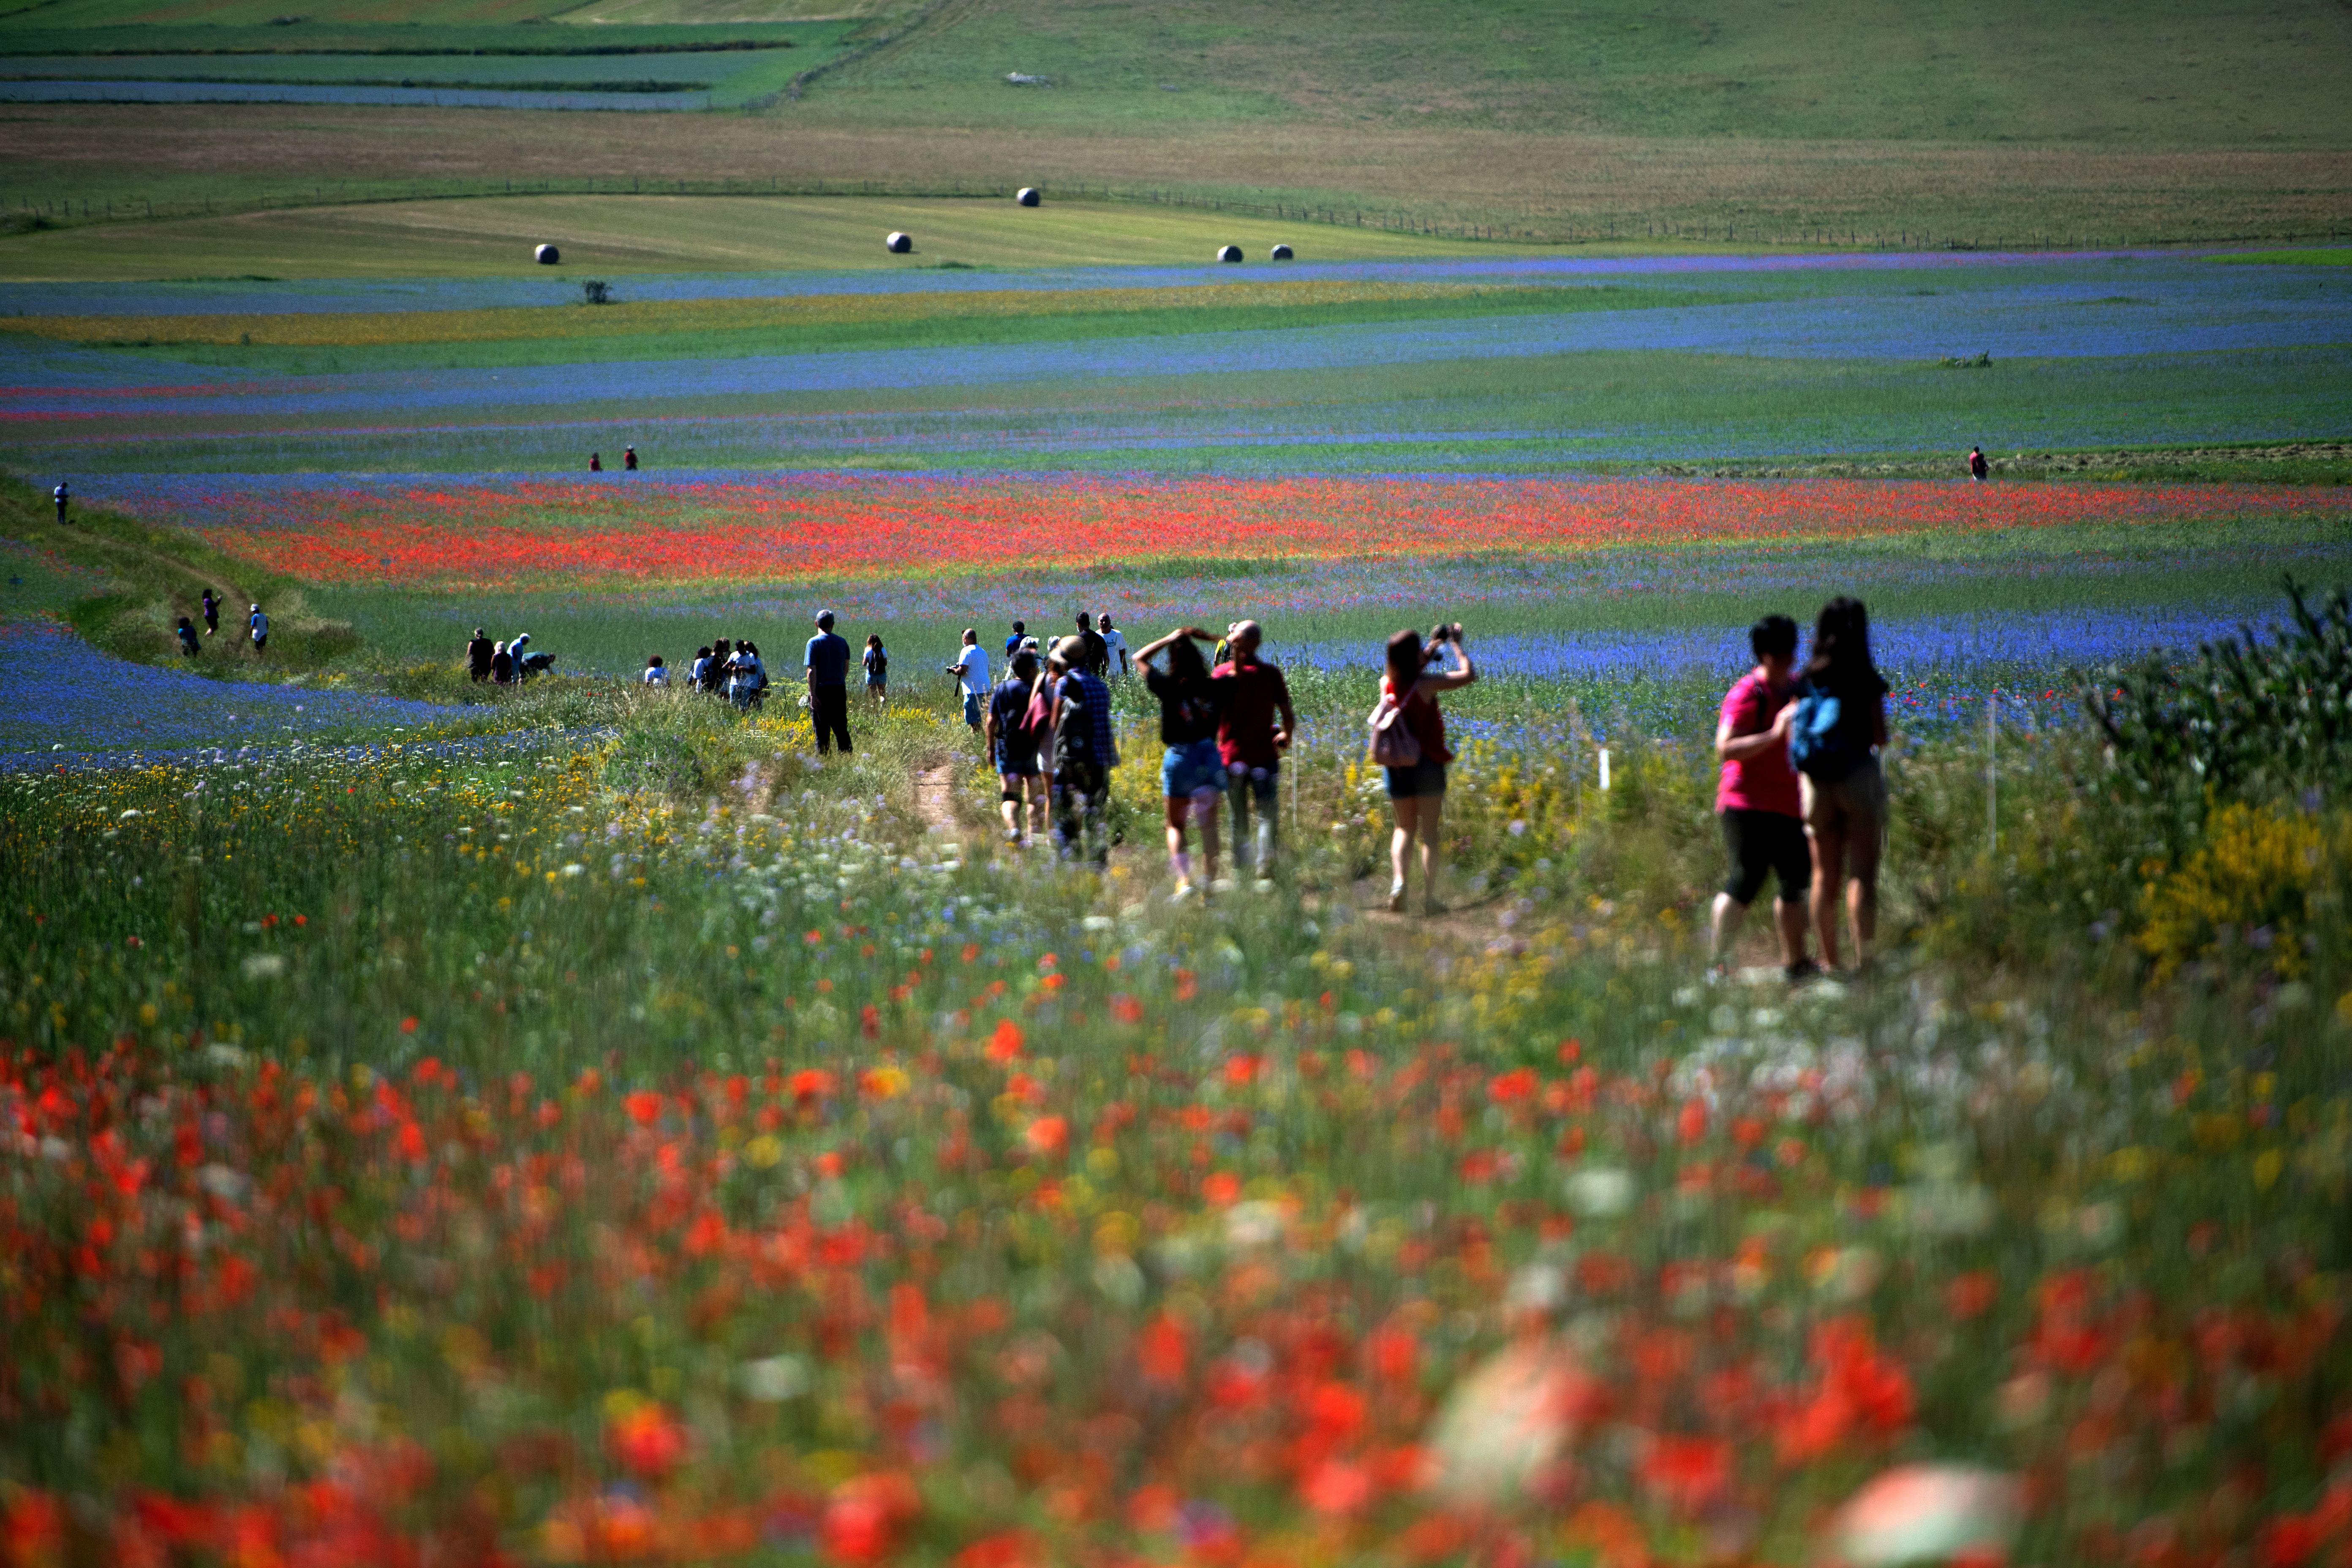
A tourist generally has an eye for the things that have become almost invisible to the resident.

One million year old mammoth DNA more than doubles the previous record and suggests that even older genomes could be found.
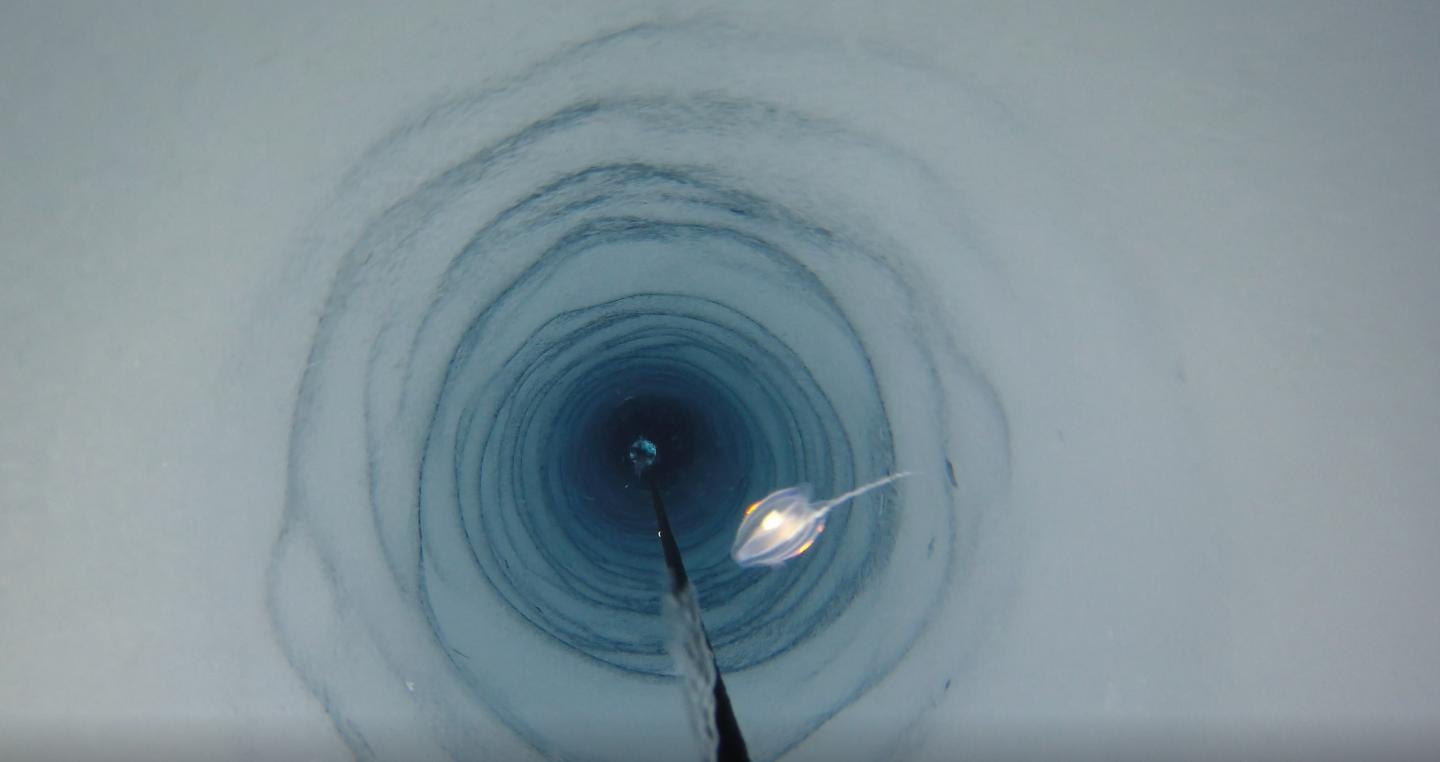
The organisms were anchored to a boulder 900 meters beneath the ice, living a cold, dark existence miles away from the open ocean.
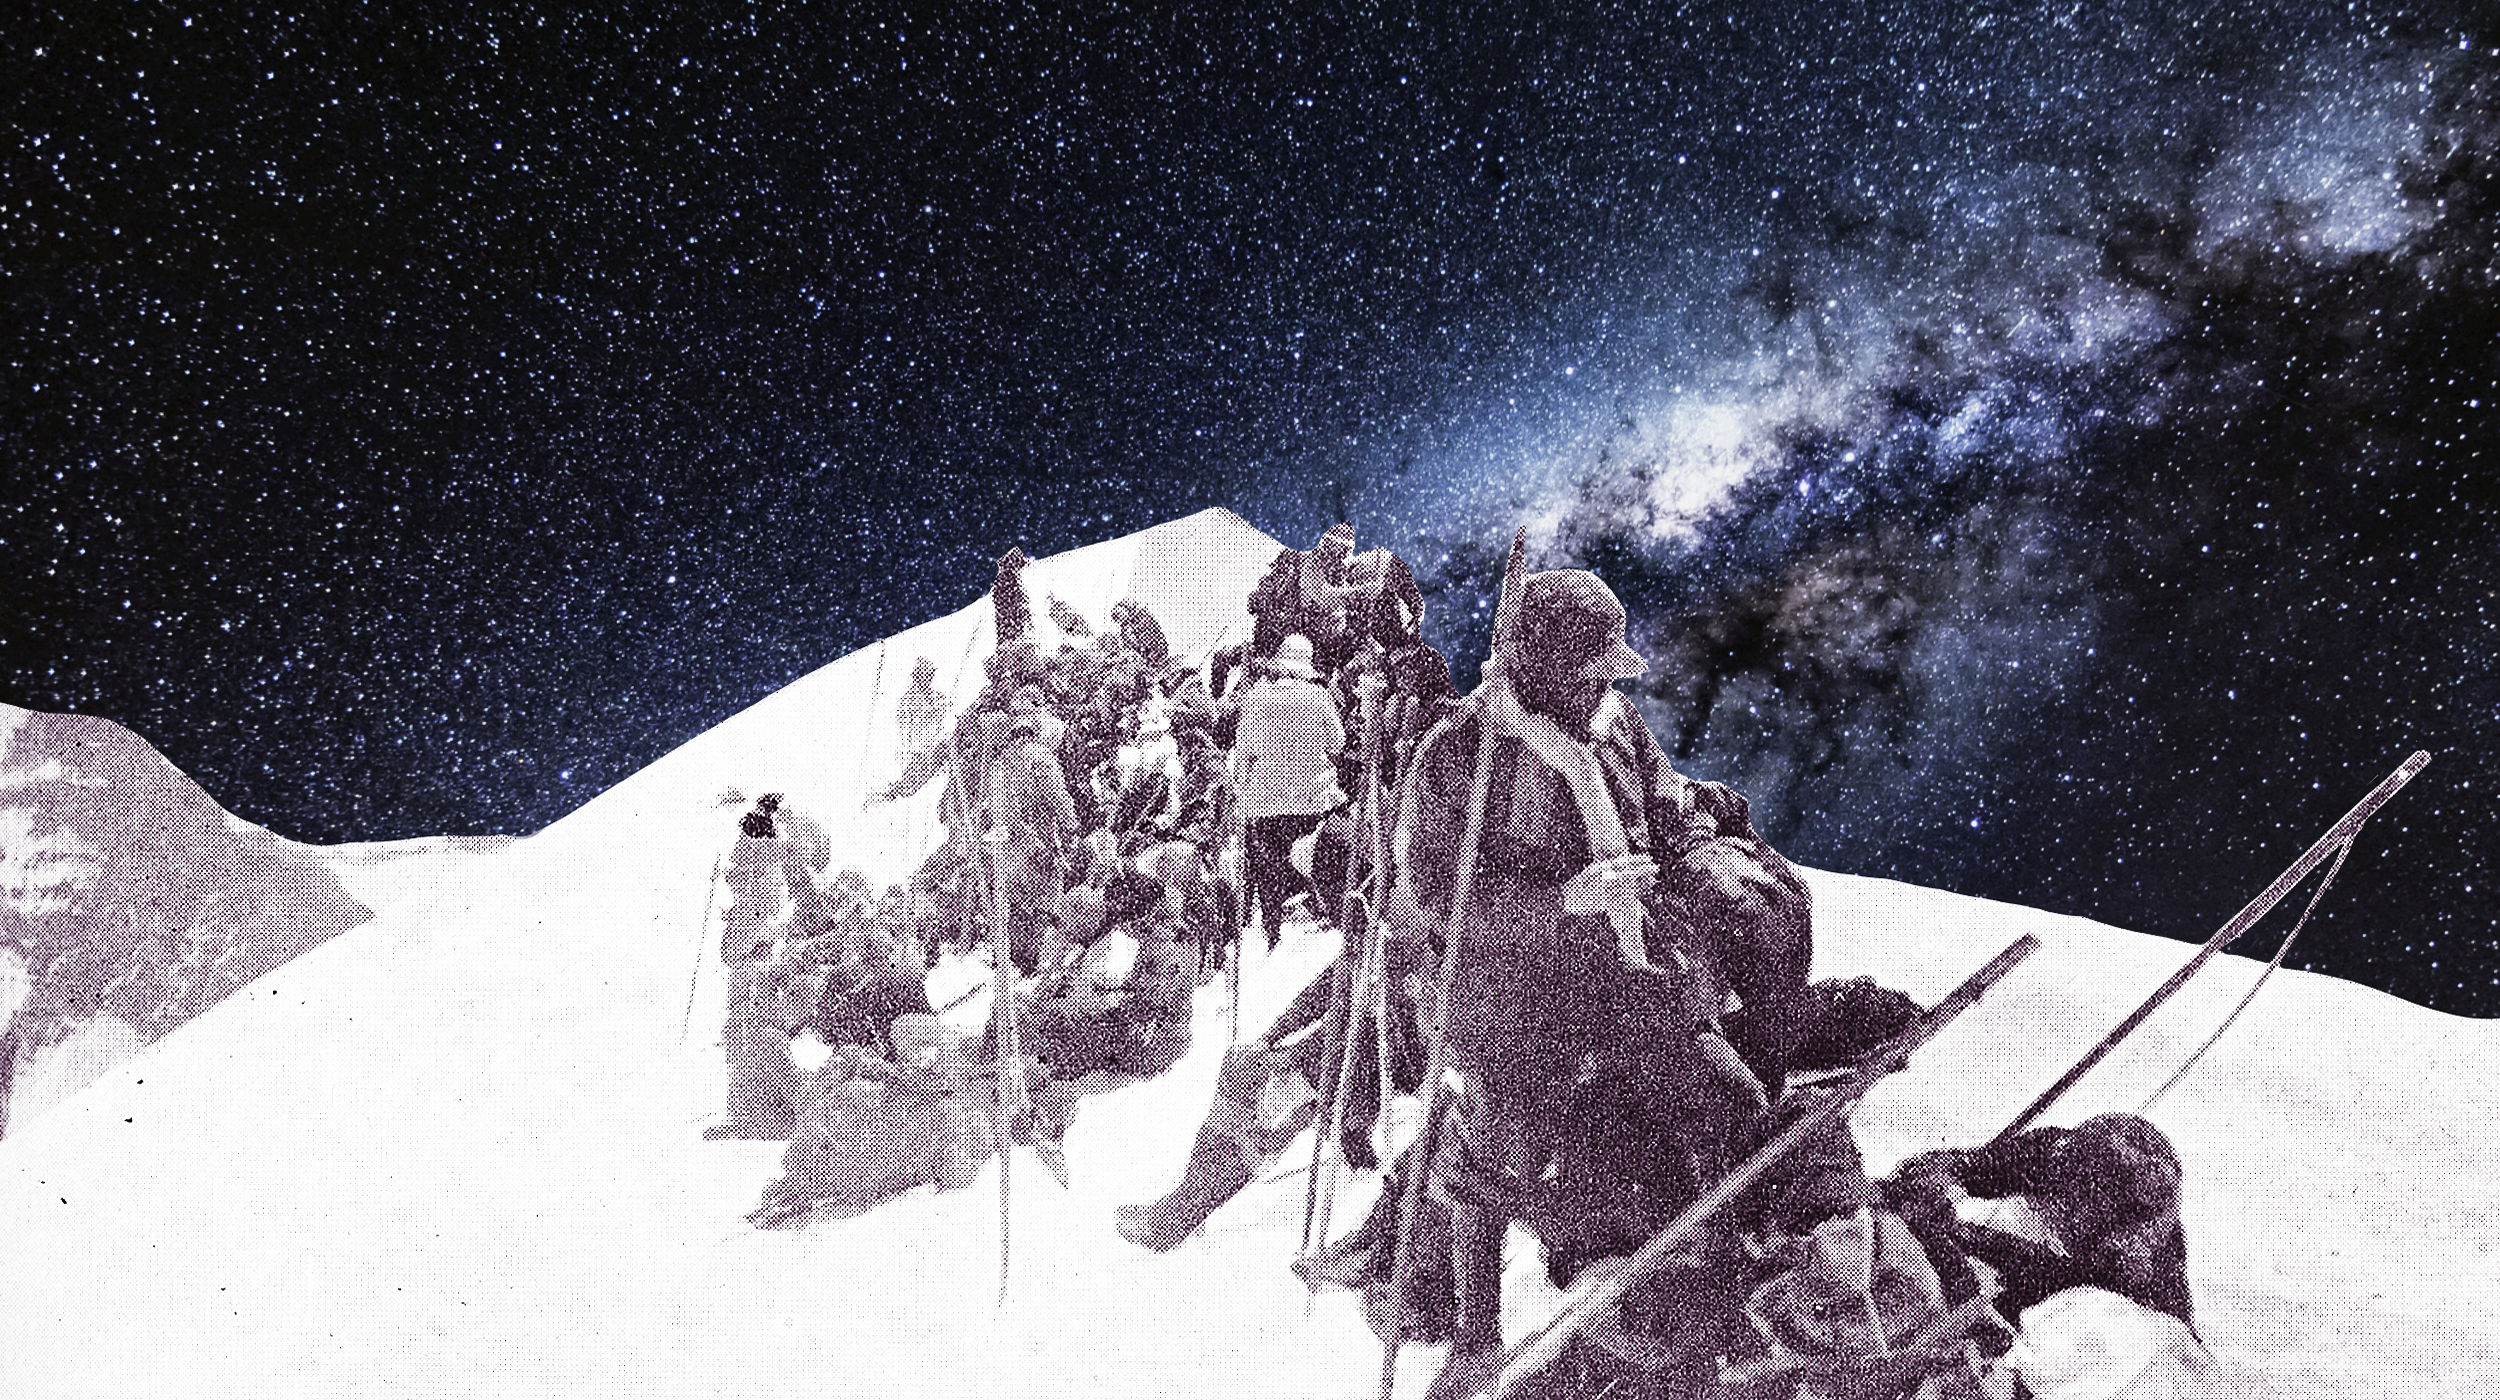
Some mysteries take generations to unfold.

To understand ourselves and our place in the universe, “we should have humility but also self-respect,” Frank Wilczek writes in a new book.
In a joint briefing at the 101st American Meteorological Society Annual Meeting, NASA and NOAA revealed 2020’s scorching climate data.
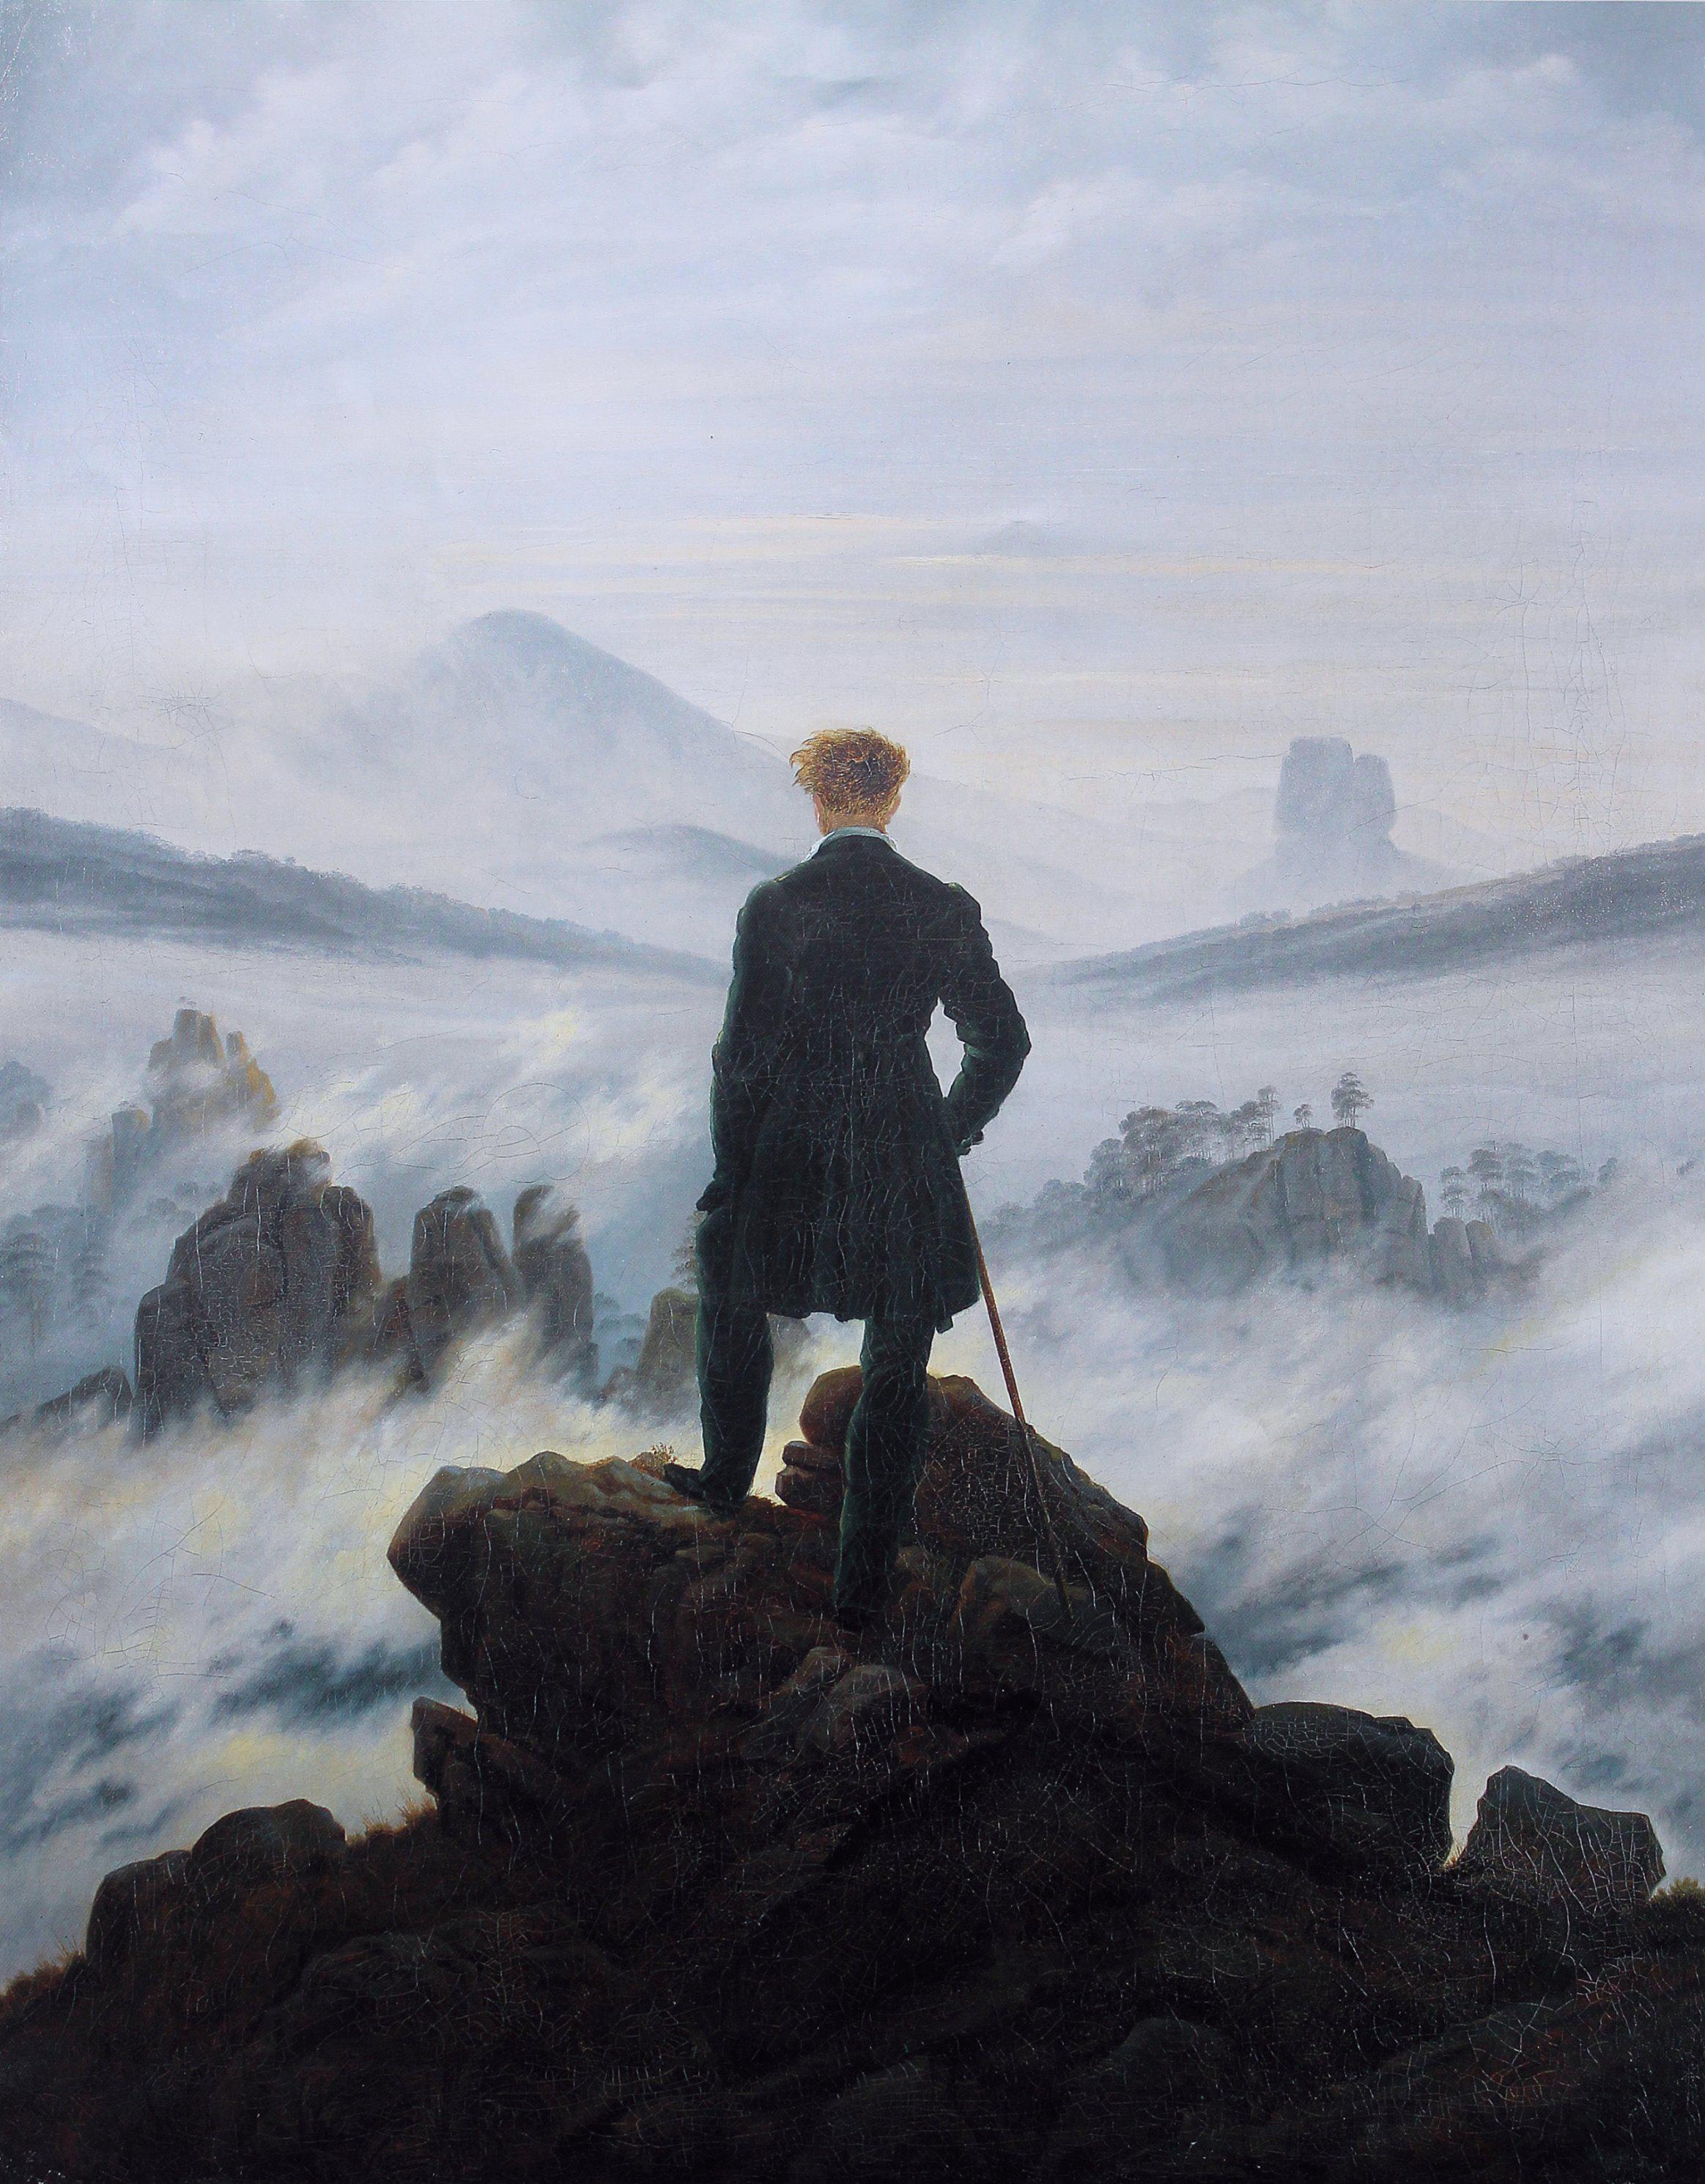
Take a journey through the maze of interpretations of one of the most famous paintings in history.

Perspective twisting books on biology, social science, medical science, cosmology, and tech.

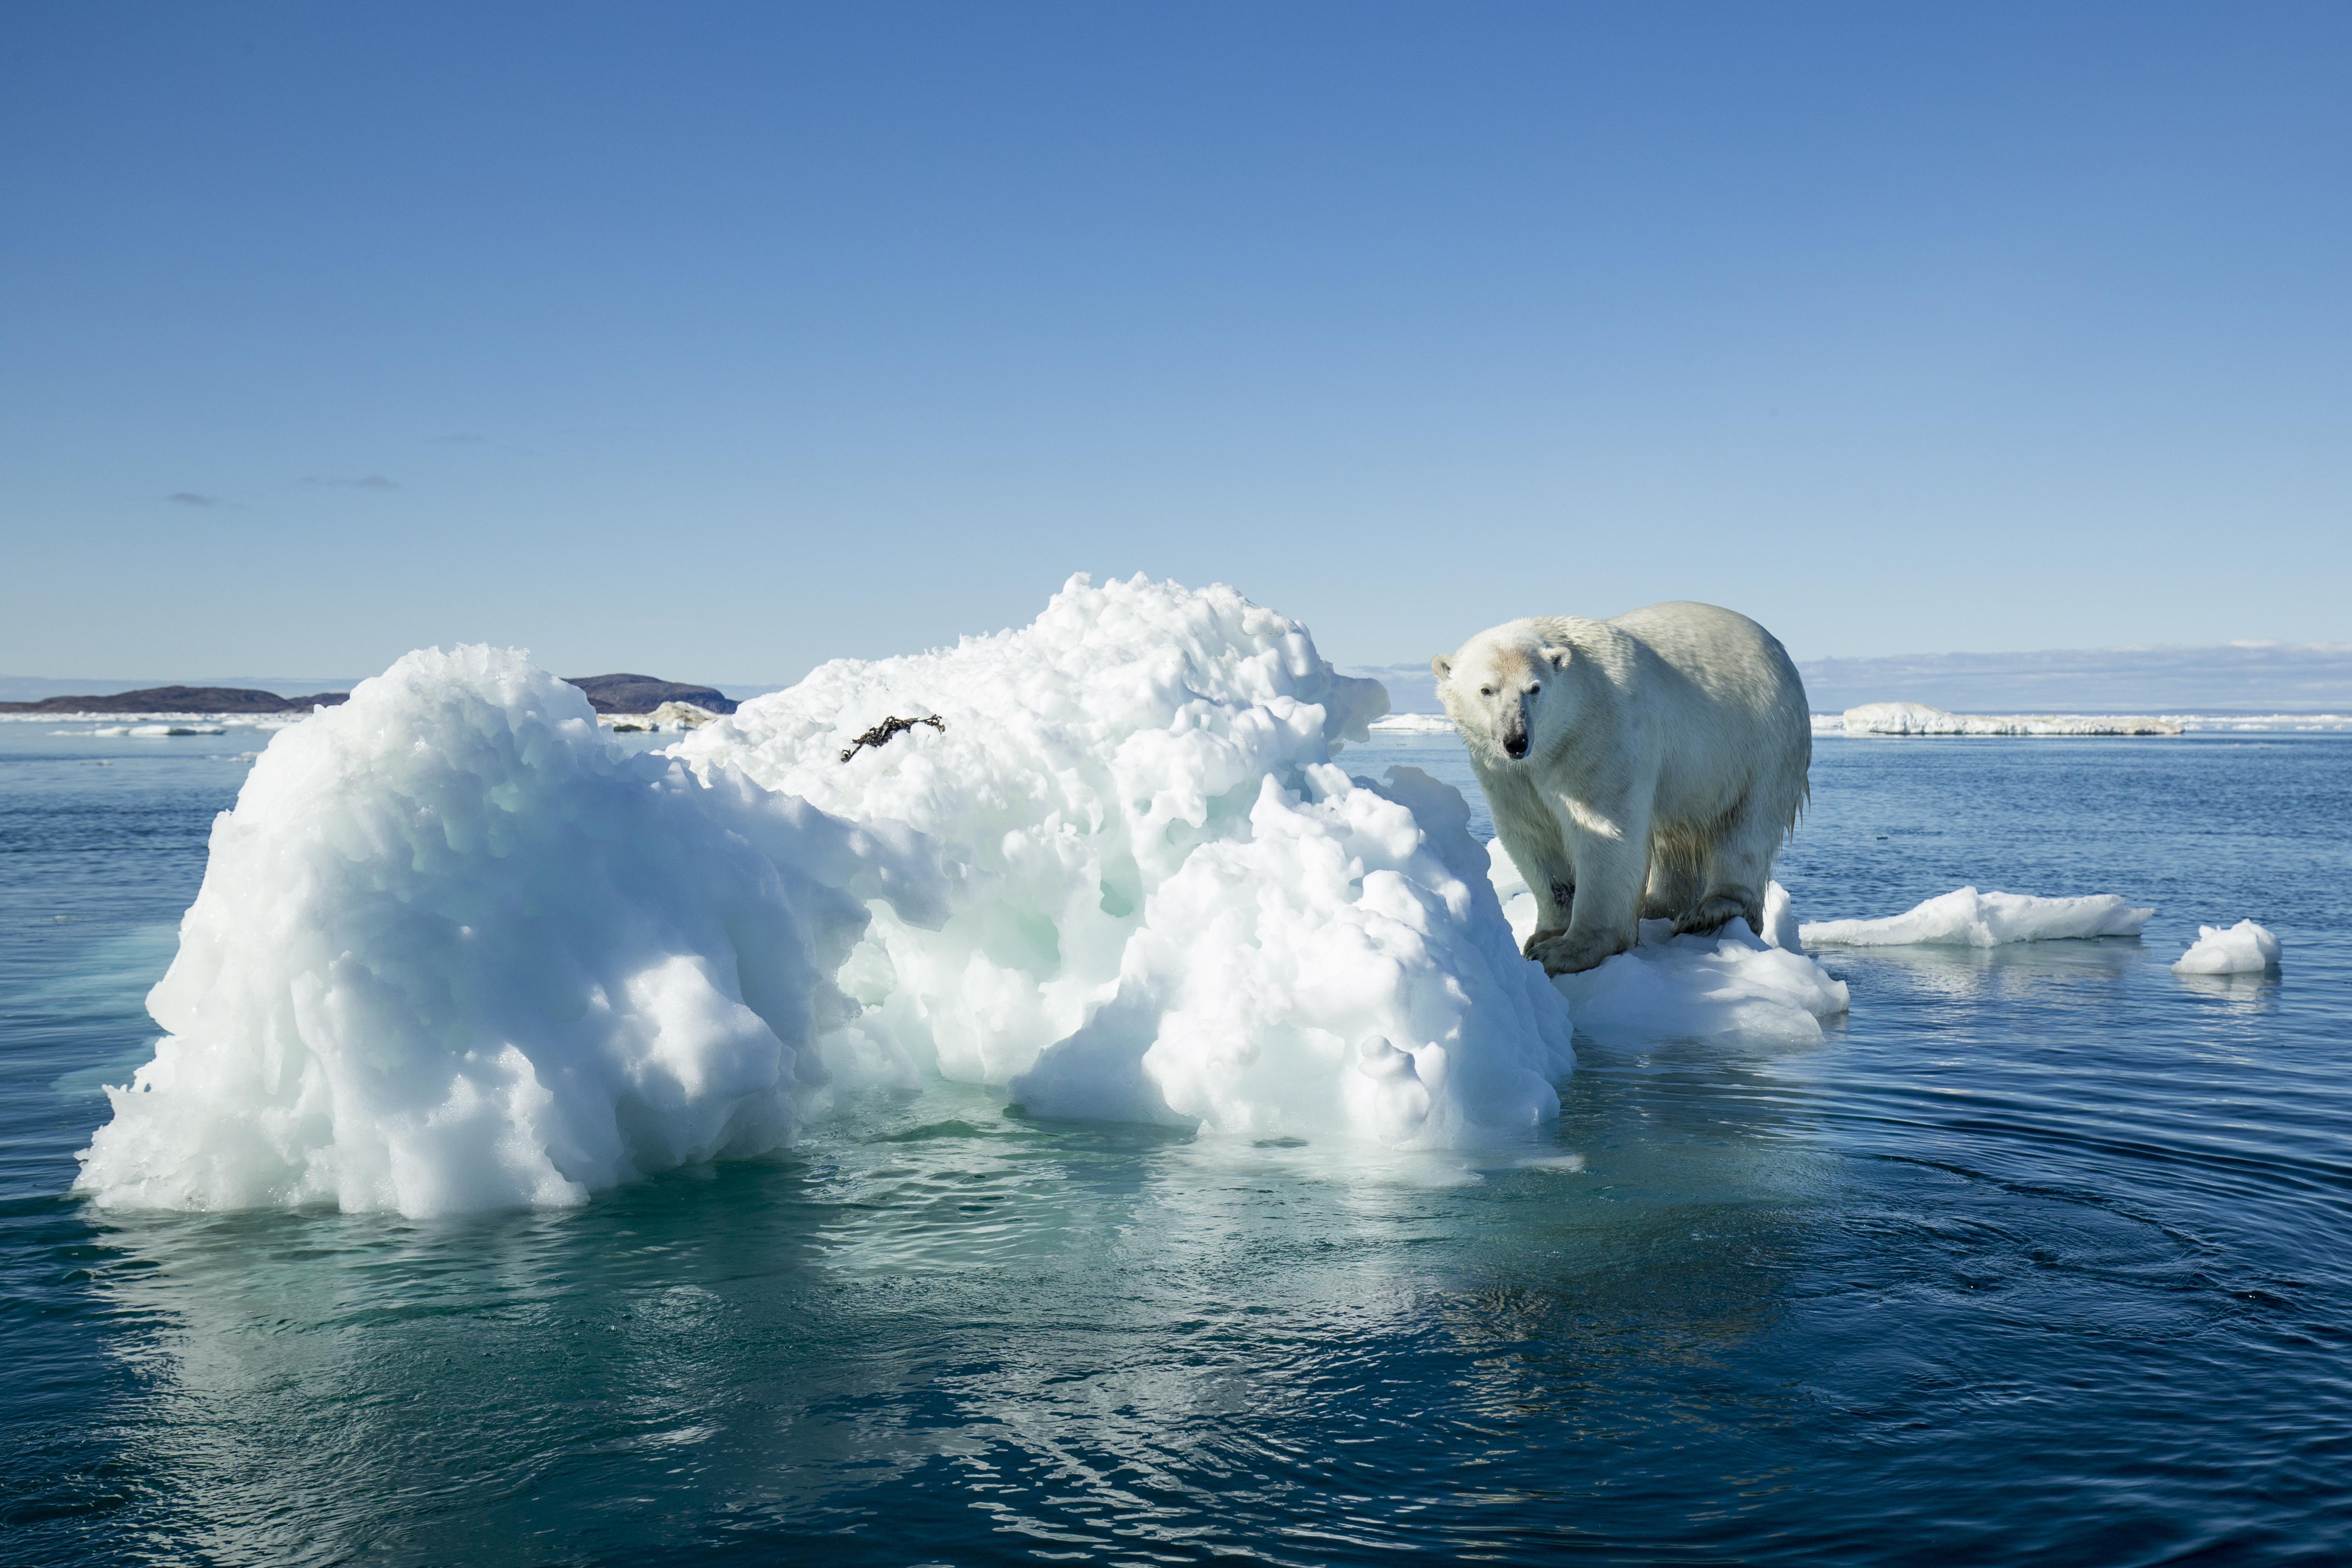
Researchers from Norway discover that the Moon’s tides influence the release of methane from the ocean floor.