natural resources
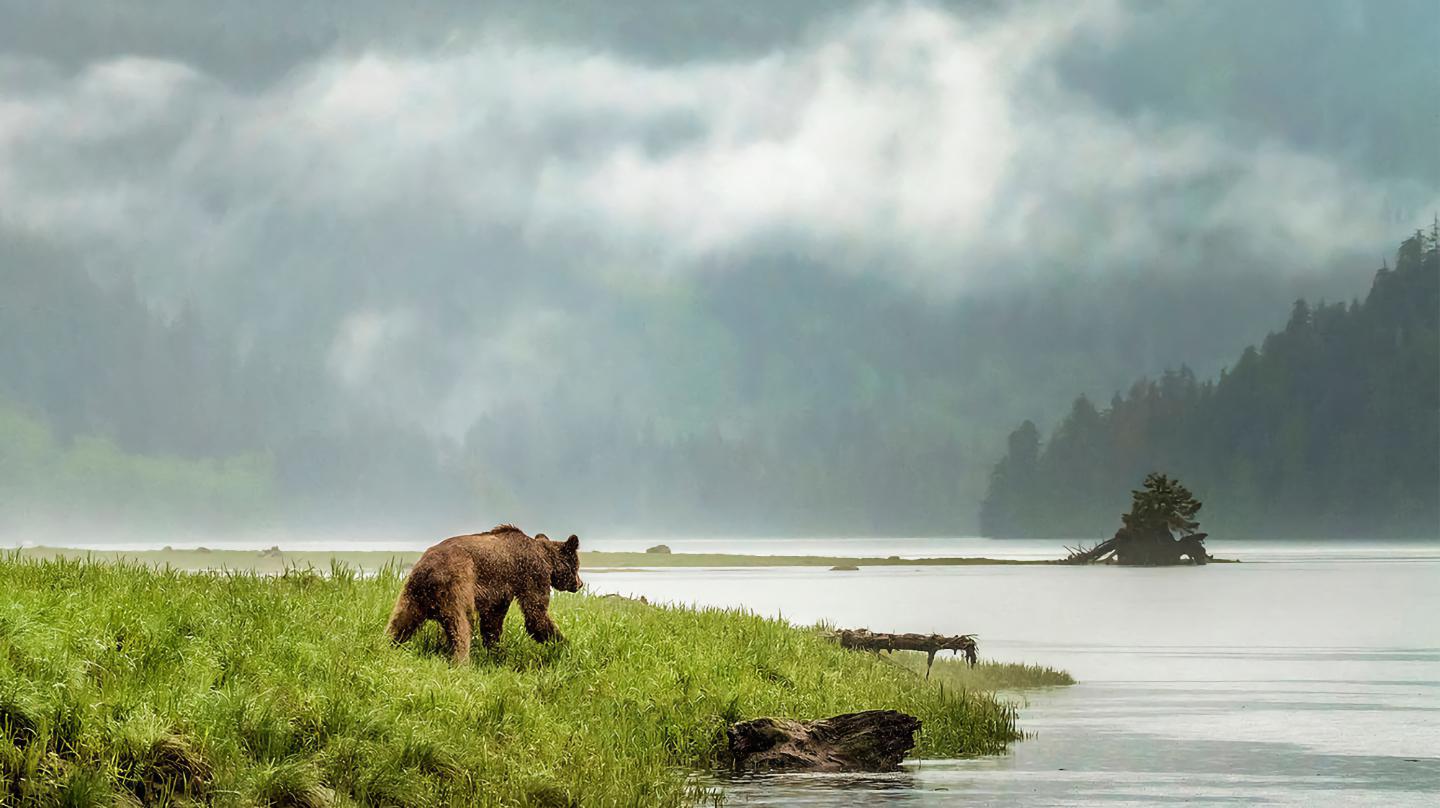
A genetic study of British Columbia grizzly bears finds a weird link to local human languages.
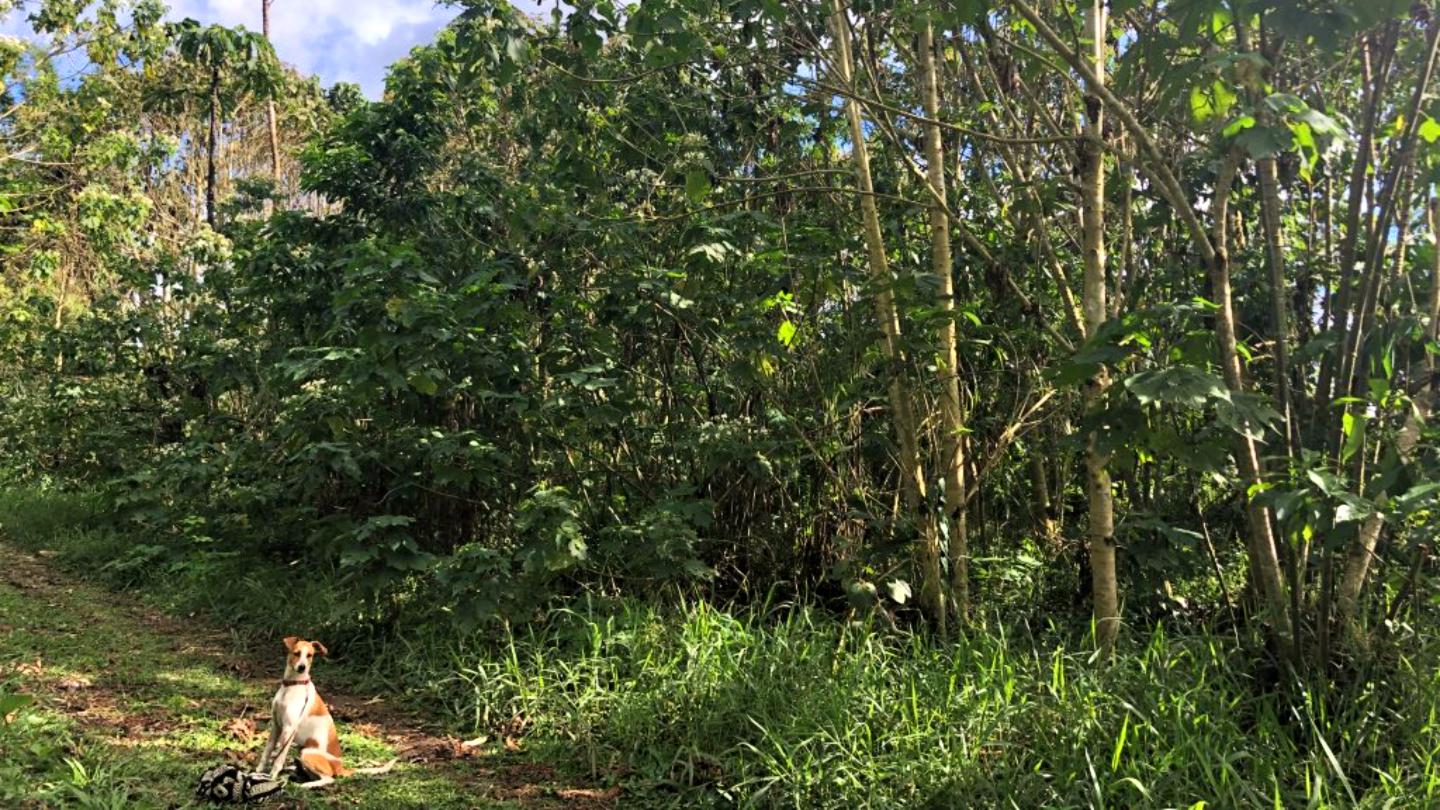
Researchers find that the coffee pulp is valuable in its own right.

Australian researchers figure out a new way to apply extreme pressure and squeeze out diamonds.
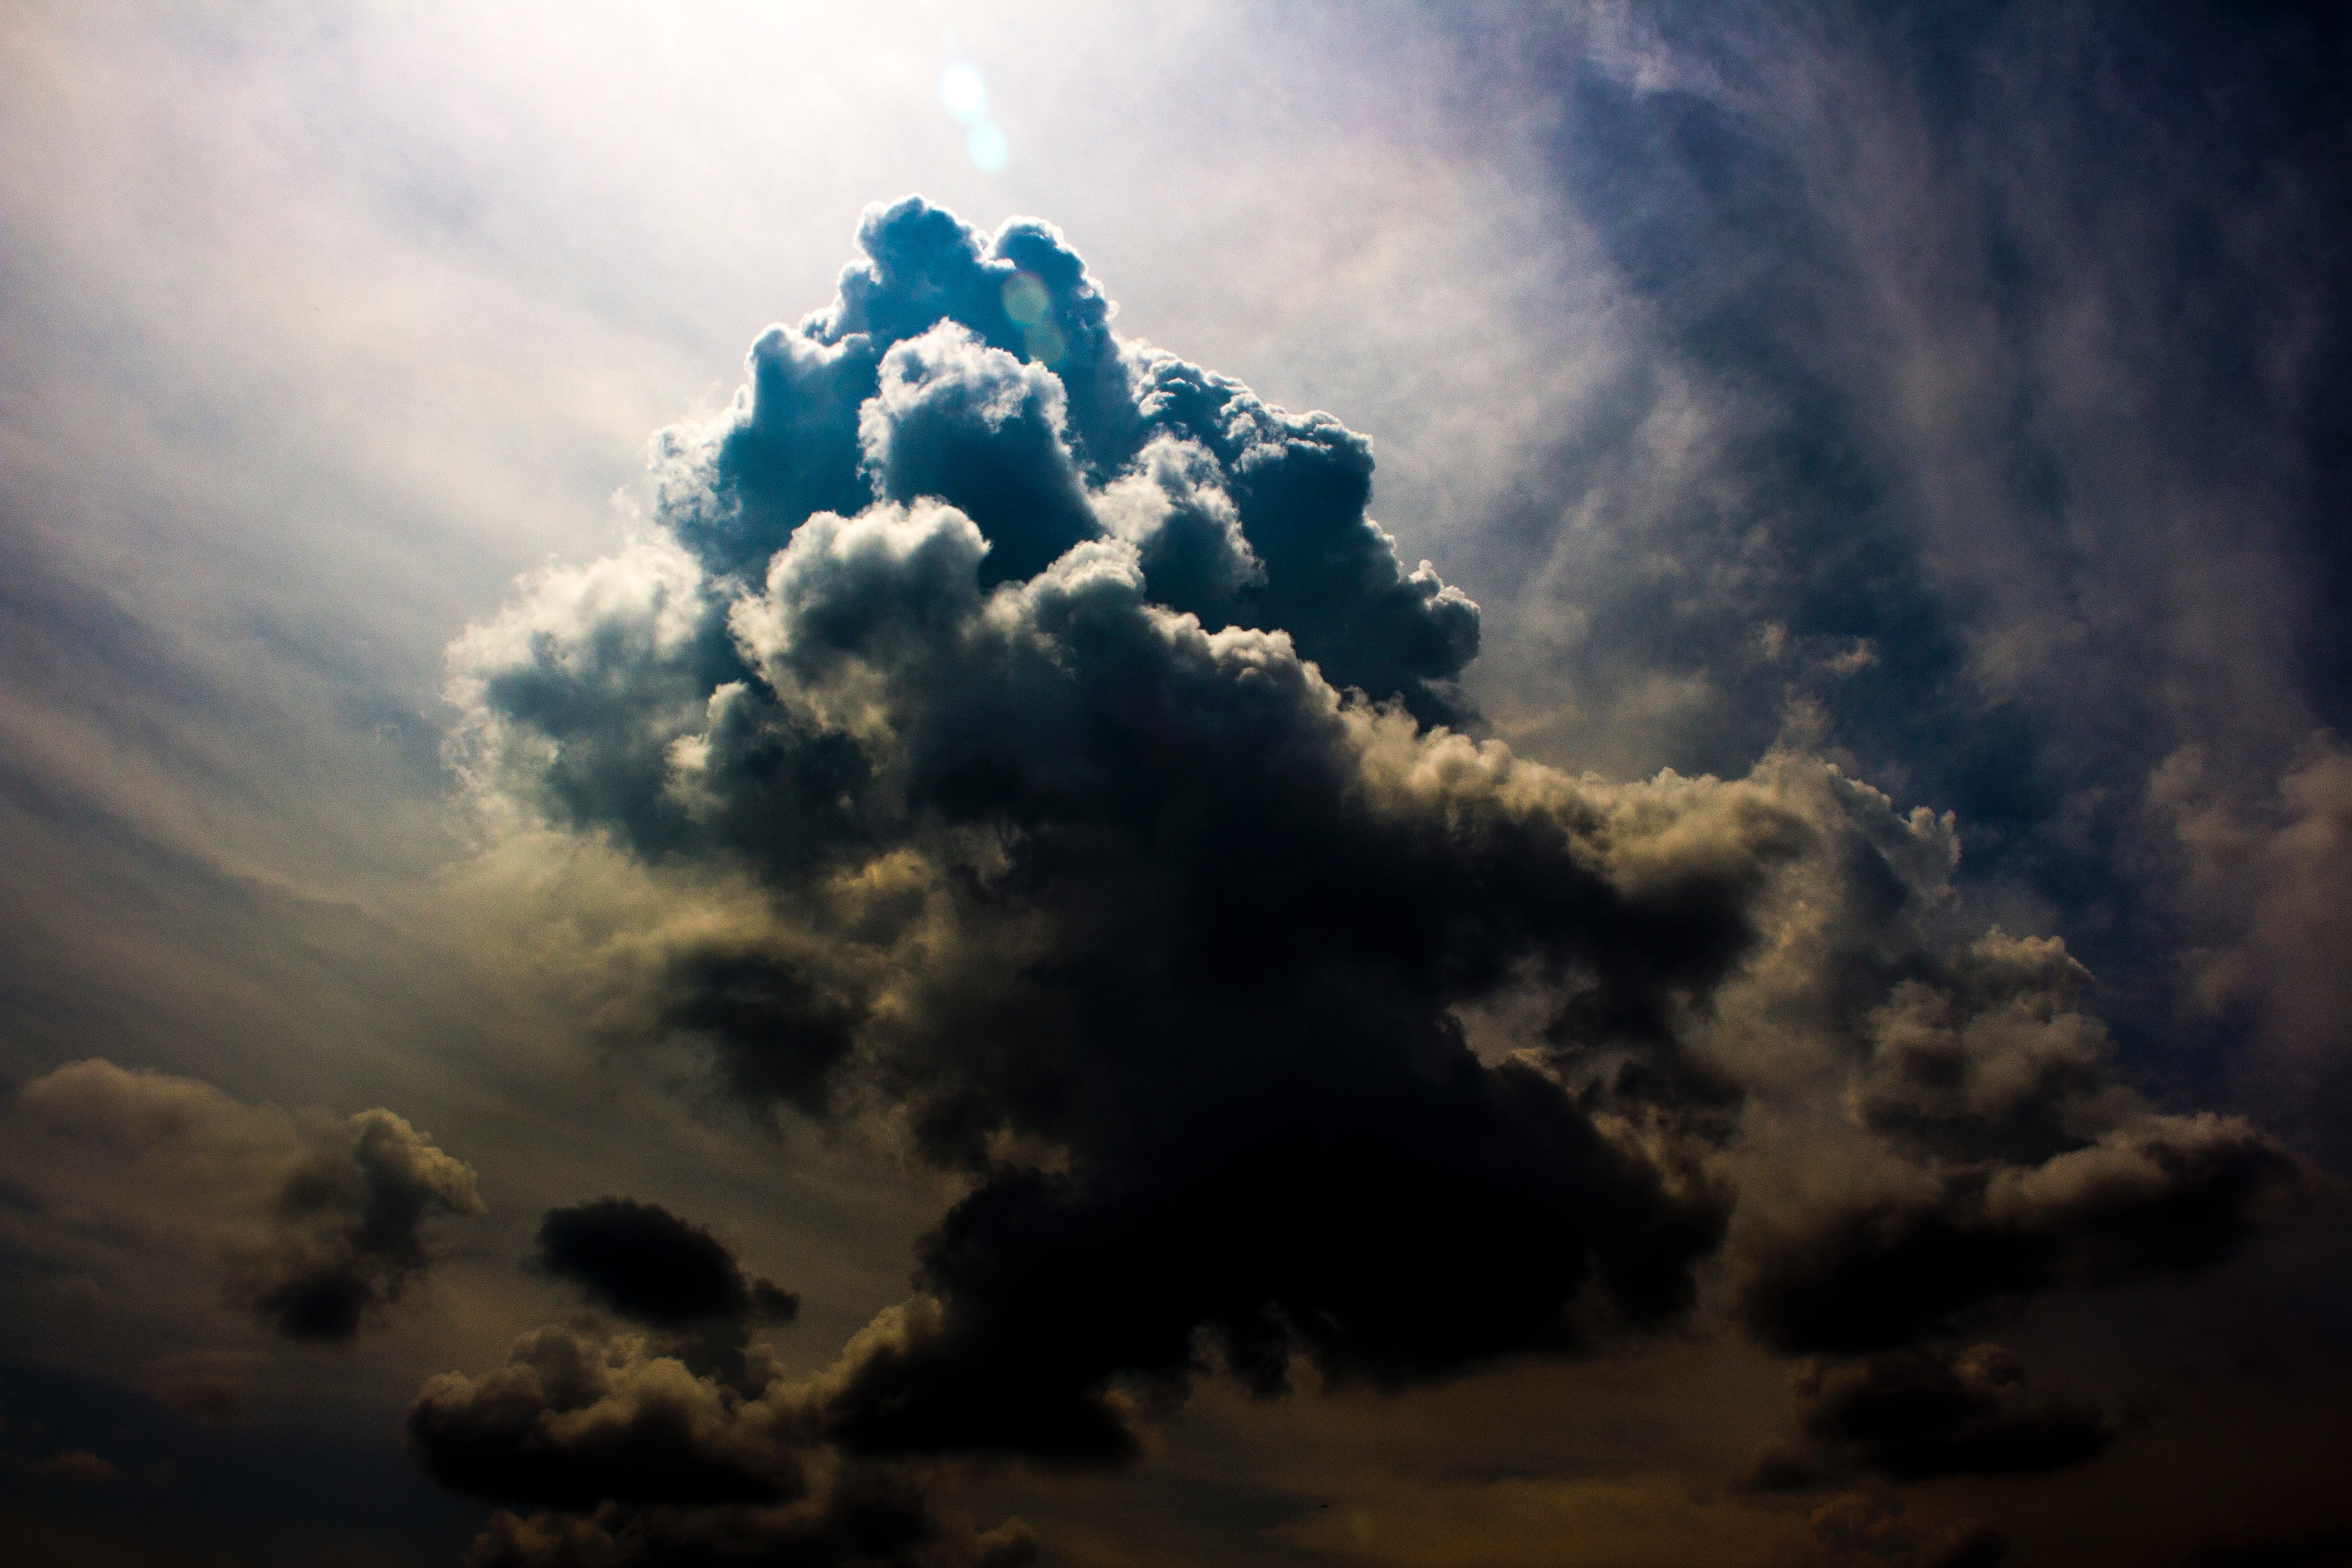
Researchers evaluated the best and worst ways to remove greenhouse gases from the atmosphere in a recent report.
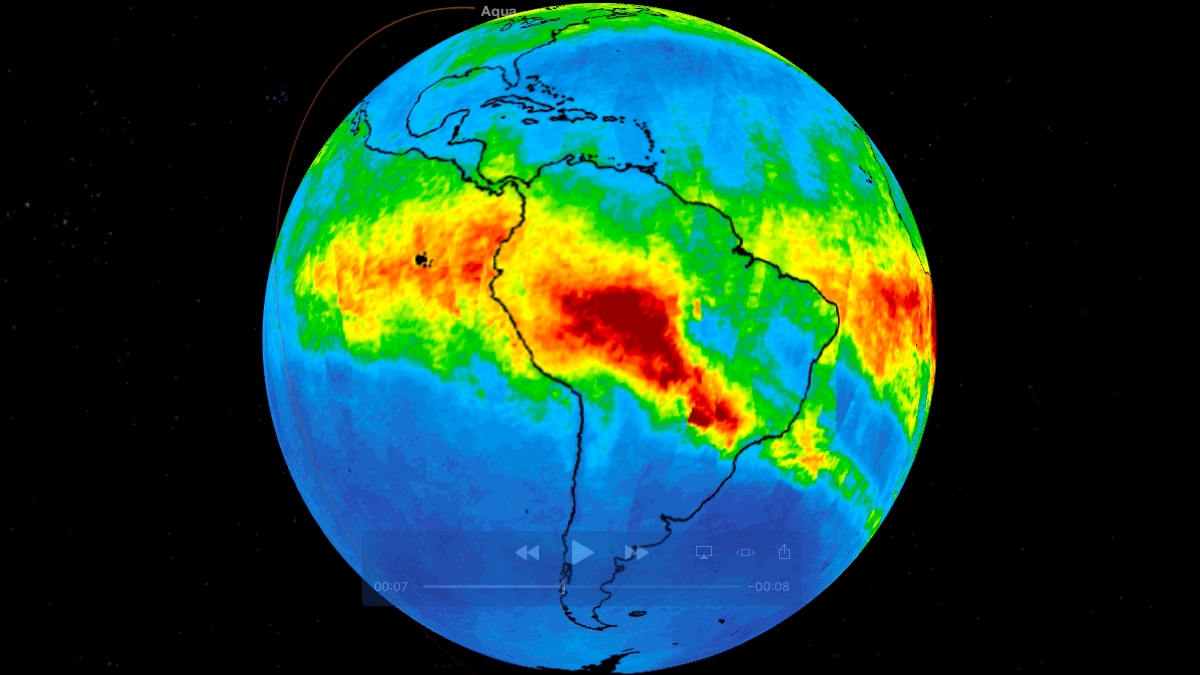
Satellite movie shows clouds of carbon monoxide drifting over South America.
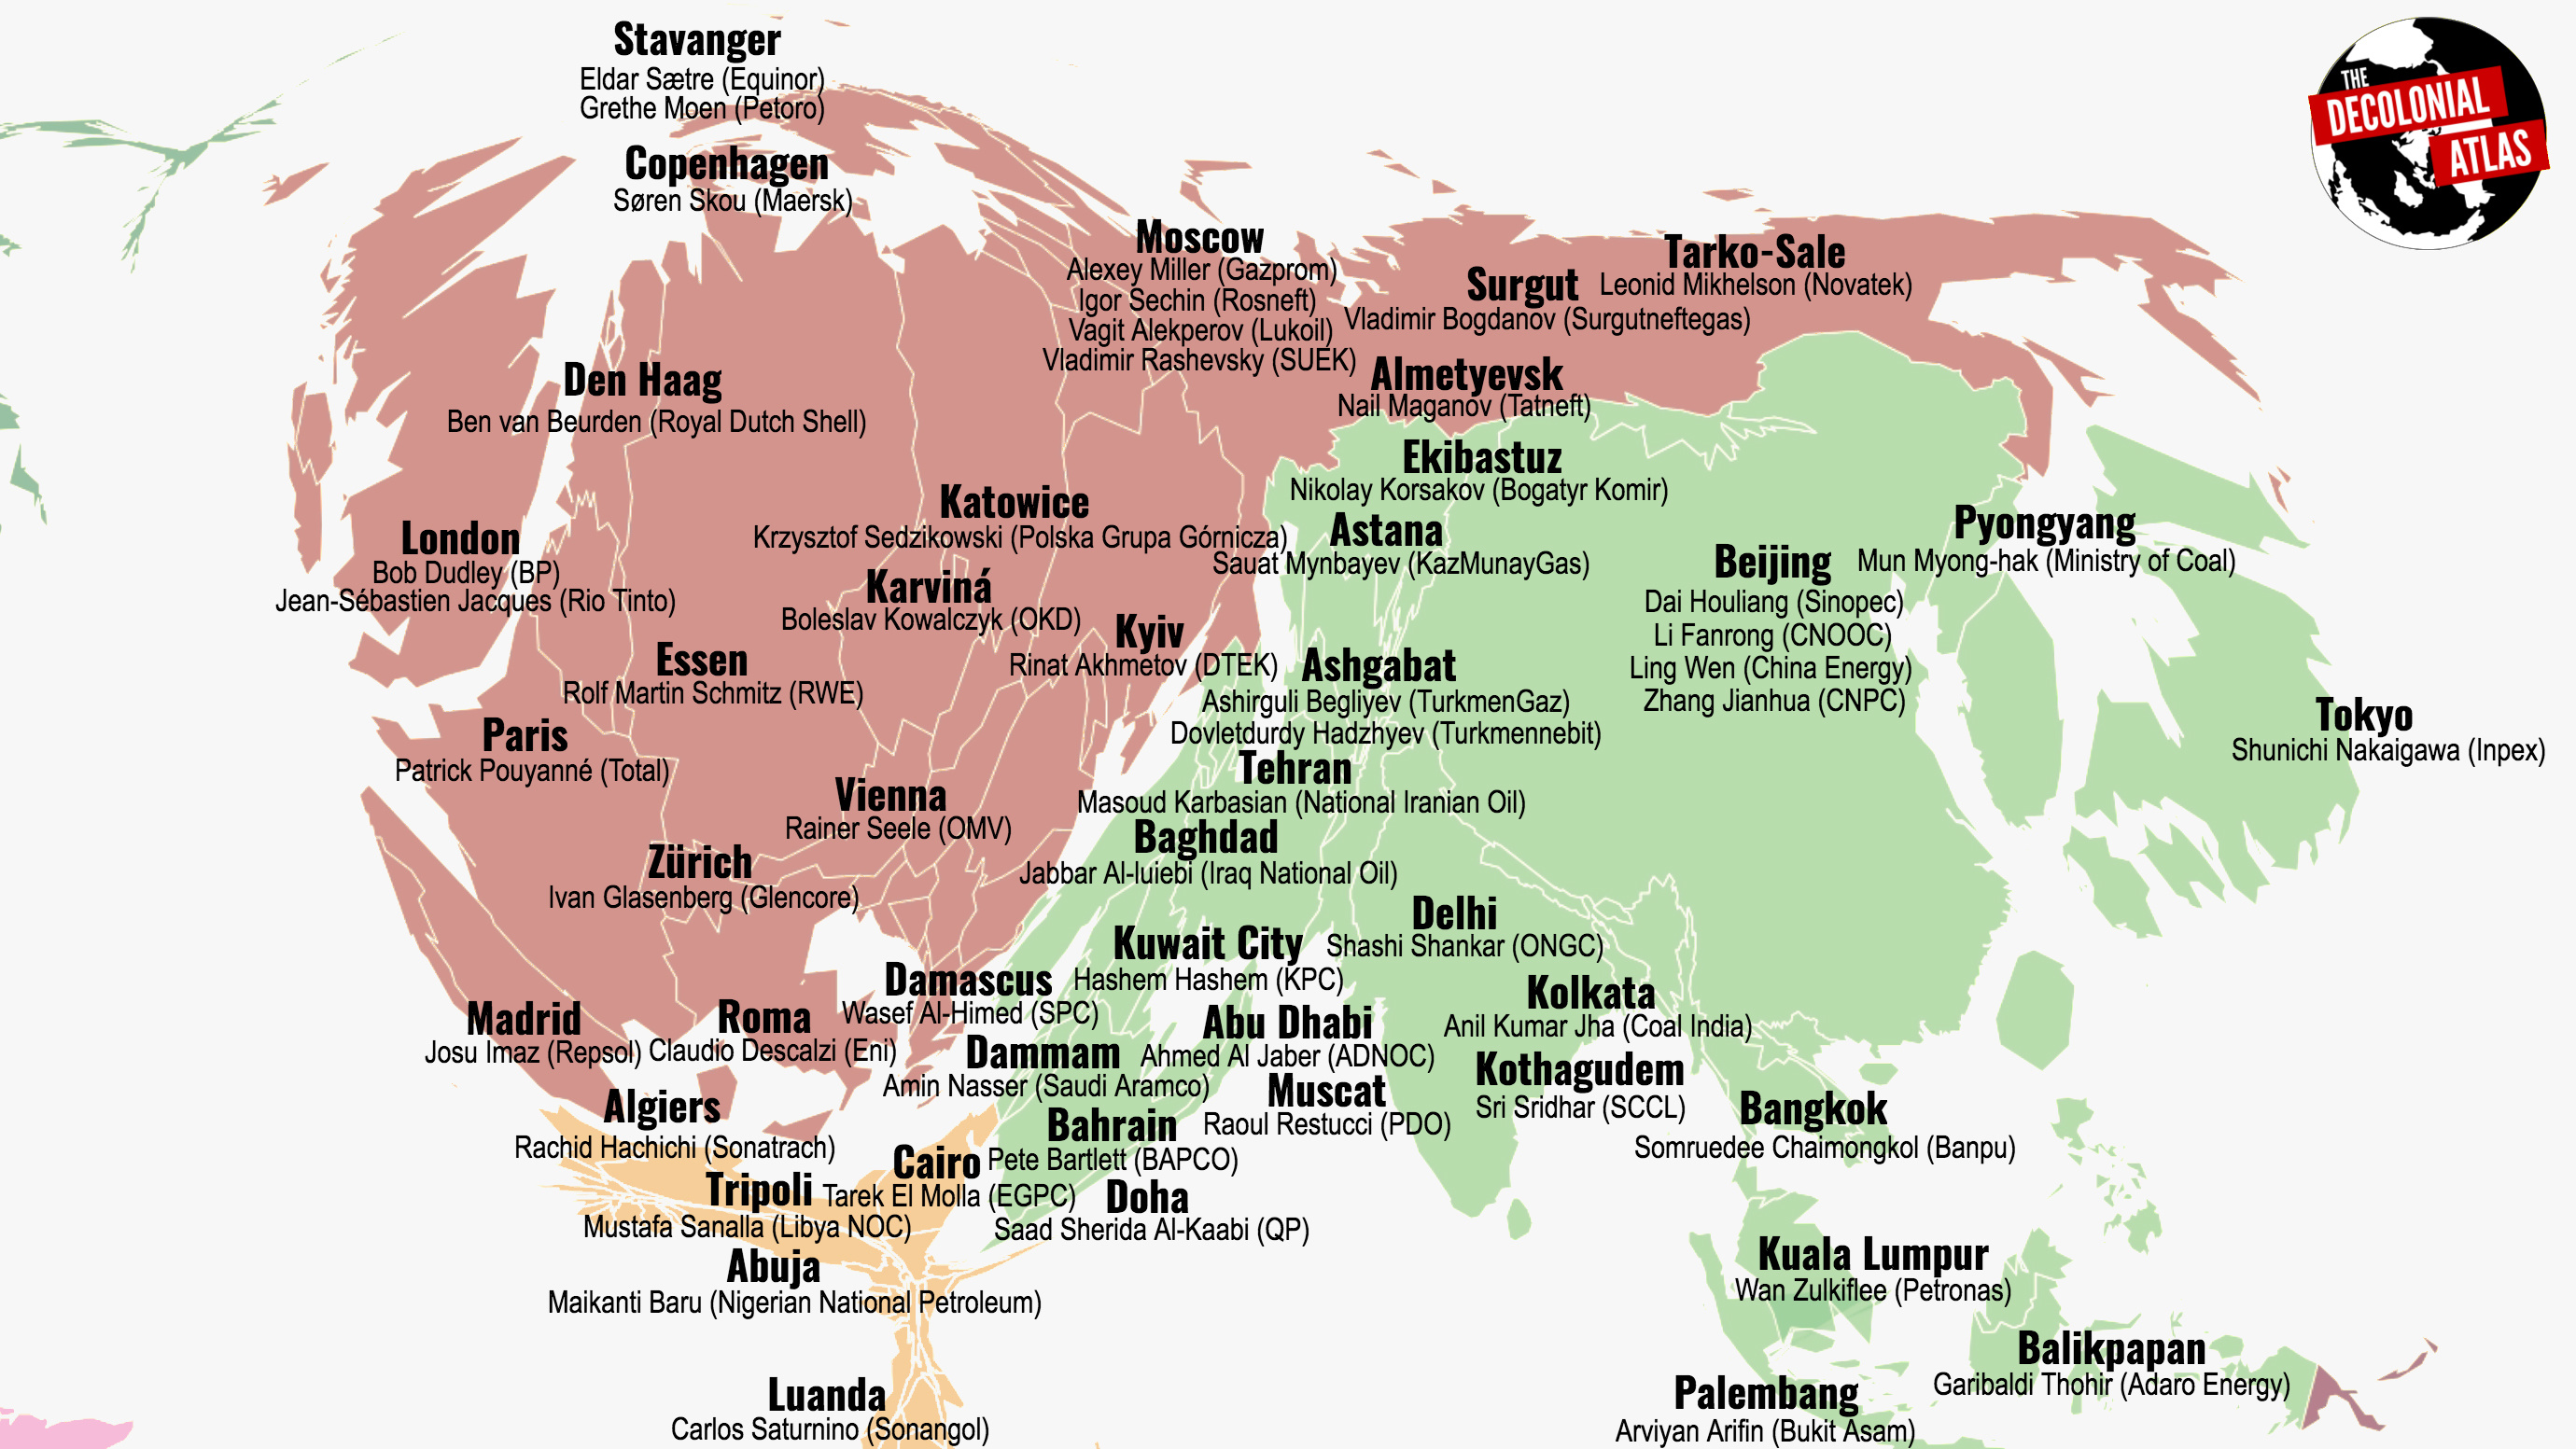
Controversial map names CEOs of 100 companies producing 71 percent of the world’s greenhouse gas emissions.
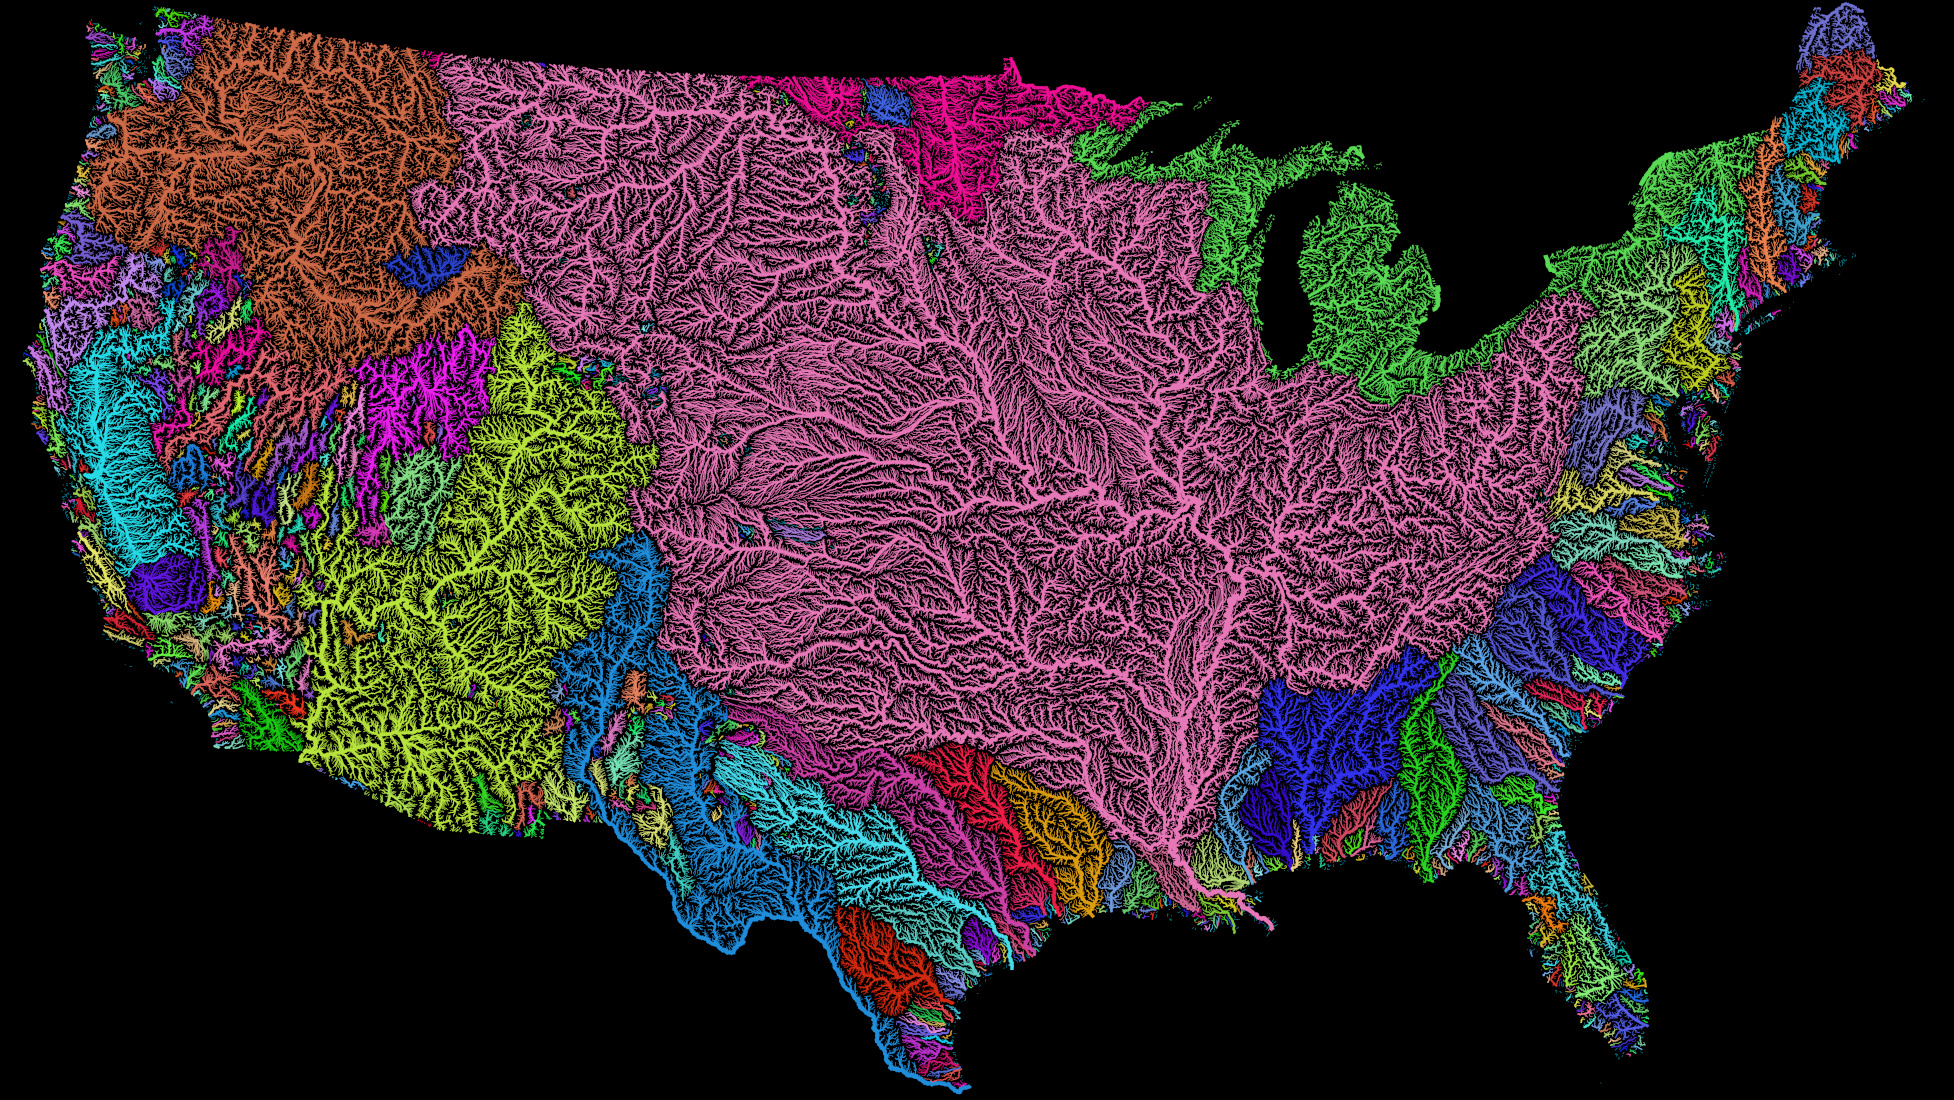
Hungarian cartographer travels the world while mapping its treasures.

Japan looks to replace China as the primary source of critical metals

Indiana ranks 3rd in coal consumption, but a primary energy utility there just declared the end of coal by 2028