Ask Ethan: Why is the Big Bang shown as a tube?
- According to the Big Bang, our Universe was once very hot, very dense, very uniform, but with a very small volume. It’s expanded, cooled, and evolved ever since, giving rise to our modern cosmos.
- But, as most commonly depicted, the Big Bang is shown as a tube that grows in one direction, having begun with some sort of “ignition-like” event where the tube is sealed.
- Of course, the Big Bang isn’t a tube, but an event that happened everywhere at once, triggering the birth of the Universe as-we-know-it. Here’s what that illustration really depicts, and why.
For thousands of untold generations, humanity has pondered our cosmic origins with a sense of awe and mystery, as though it were akin to pondering the nature of God. But over the course of the 20th century, a clear picture emerged as supported by an overwhelming suite of scientific evidence: the scenario of the hot Big Bang. A finite amount of time ago, the Universe began from a hot, dense, relatively uniform, but rapidly expanding state, and it has evolved and cooled ever since. Today, 13.8 billion years after that event, humanity has been able to reconstruct our cosmic history, from those earliest moments to the present day, explaining the formation of elements, atoms, stars, galaxies, the cosmic web, rocky planets, and eventually, intelligent life as well.
In many ways, it truly is the greatest story ever told: not a biblical or philosophical or poetic account of all of creation, but a scientific one. And yet, when we see it depicted, visually, it often looks like a fluted glass, tipped on its side, that flares at one end and closes on the other. Some have likened it to a tube or a cylinder, including Jennifer Daniels, who writes in to ask:
“Why is the Big Bang always depicted as a tube with an ignition point, and not a sphere?”
As is so often the case with scientific illustrations, it would be impossible to show the entire history of the Universe, in all its splendor, in a single, static image. Here’s what you so often see, and why it’s depicted in this particular fashion.

When it comes to the Big Bang, there are a lot of misconceptions. A lot of people view it as an explosion; a lot of people view it as having a particular point-of-origin in space; a lot of people conflate it with the notion of a singularity, or the birth of space and time itself. All of these notions are incorrect.
The Big Bang was not an explosion at all. Rather, the idea is rooted in the concept of expansion, and the fact that space itself does not remain static, but is compelled to either expand or contract dependent on the matter and energy distributed throughout it. The Universe expands, and that means that the distance between any two arbitrary points in space increases, or lengthens, over time, even if the objects within that space aren’t moving relative to the space they inhabit at all.
The Big Bang didn’t occur at a particular place, but rather occurred at a particular time in our past: 13.8 billion years ago, to be precise. Where did the Big Bang occur? The answer to that question, at least as far as we can tell from within our observable Universe, is everywhere, all at once. It’s why, as we look farther away to objects found at great cosmic distances, we’re seeing those objects as they were in the past: closer to the moment of the Big Bang.
And the idea of a singularity is outdated; the Big Bang didn’t begin from a singularity, but rather arose from a prior state where it wasn’t matter and radiation that dominated the Universe’s energy content, but energy that was woven into the fabric of space itself. This corresponds to a period of cosmic inflation, which precedes, sets up, and (when it ends) gives rise to the Big Bang.

It also makes tremendous amounts of sense to think of the observable Universe as being a sphere that expands over time, especially in the context of the Big Bang. That’s because the fastest speed that any signal can travel through the fabric of space is the speed of light, and that speed, 299,792,458 m/s, is absolutely universal: it applies equally well to all observers at all times. When only a tiny amount of time has elapsed since the start of the hot Big Bang, the amount of the Universe that a hypothetical observer can “see” is limited by the distance that a light signal could have propagated since that moment: since the hot Big Bang’s onset. As more time elapses, light from greater distances away can now arrive, increasing the size of what astrophysicists call our “cosmic horizon.”
By the time we reach the present day, our cosmic horizon is enormous: after 13.8 billion years, we can now observe signals up to a whopping 46 billion light-years away in all directions. That’s another thing that stumps many people: we can see farther away than the age of the Universe multiplied by the speed of light! This, again, is because the Universe has been expanding for all this time, and even though a light signal will only propagate a distance of 13.8 billion light-years through space over the course of 13.8 billion years, the object that could have emitted that light, at present, will be found 46 billion light-years away, as the animation below illustrates.

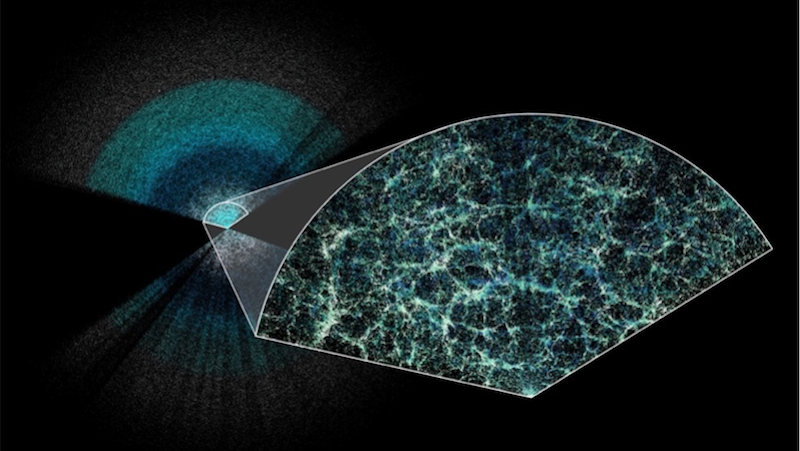
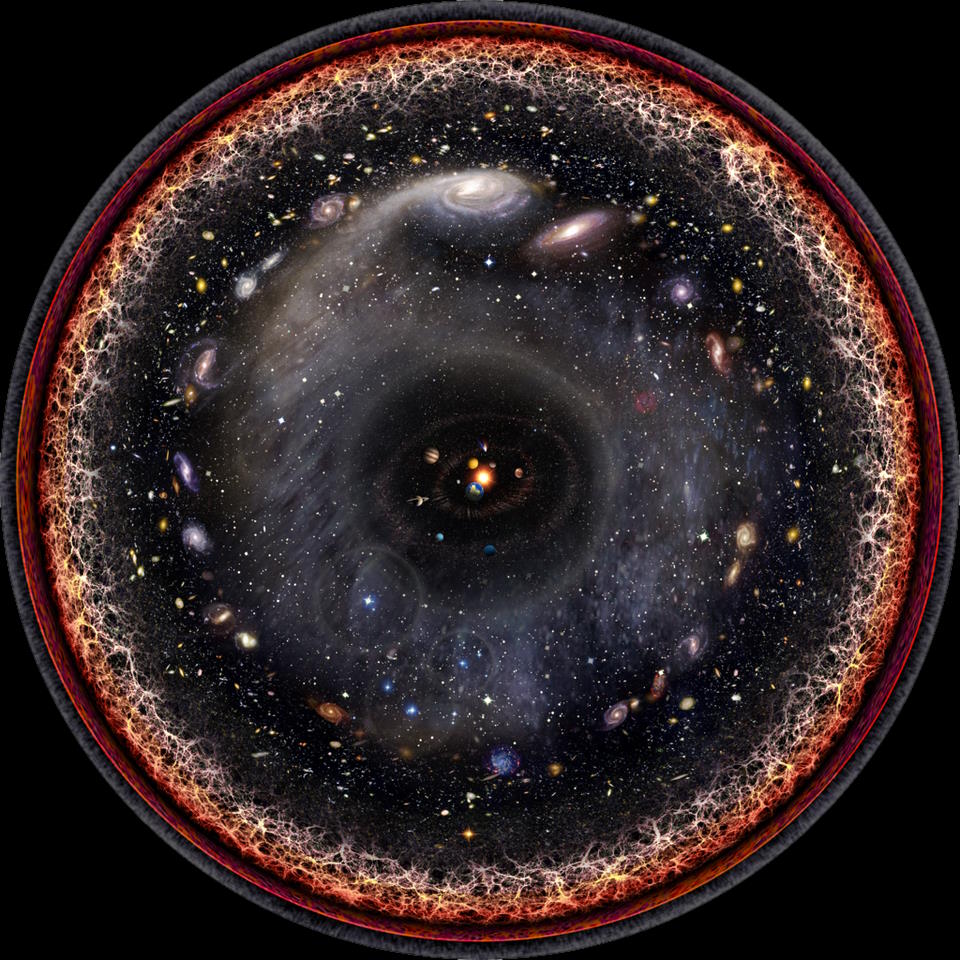
There are multiple possible ways to illustrate our cosmic history. One of the (deservedly) more famous “non-tube” or “non-cone” or “non-cylindrical” diagrams comes from Argentinian artist Pablo Carlos Budassi, whose representation of a logarithmic history of the Universe (below) shows the observable Universe as a sphere, where:
- Nearby, we’re seeing objects as they are 13.8 billion years after the Big Bang, like objects on Earth, in the Solar System, and throughout the Milky Way.
- Farther away, we’re seeing objects as they were younger in the Universe’s history, where light that’s traveled for billions of years is showing us objects as they were billions of years ago, revealing galaxies as they were in the cosmic past.
- Even farther away, we’re seeing even younger, less evolved objects, even from the first ~1 billion years of cosmic history. At these times, galaxies were less evolved, smaller, bluer, with fewer heavy elements, and greater in number, as most of the cosmic mergers that will take place have not yet occurred.
- And at even greater distances, we can see events from the early Universe, such as the first stars, the “dark ages” before any stars existed, the release of the background radiation left over from the Big Bang, an epoch before neutral atoms ever formed, an era before atomic nuclei or even protons and neutrons formed, etc.
We can extrapolate this all the way back to the first moments of the hot Big Bang itself: signatures that, if we could see them, would be found 46 billion light-years away and 13.8 billion years ago.
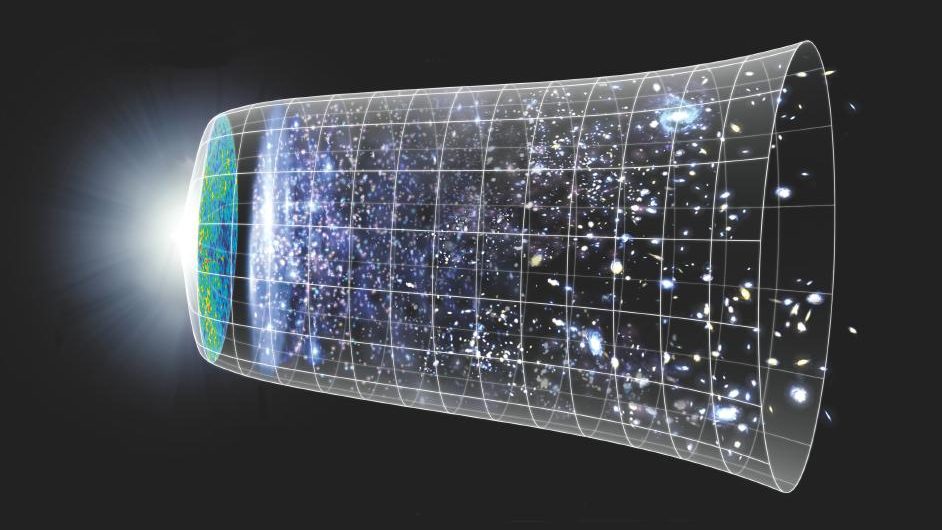
But this is not the most common depiction of the Big Bang, at least, artistically. Instead, we normally represent it by a funnel-like shape, which isn’t at all representative of how the Universe — either the observable part that we can access or the unobservable part that lies beyond the limits of what we can see — is actually shaped. Although there are enormous variations on the theme, there are a few things that they all have in common.
The biggest one, and one that’s not necessarily intuitive to us, is that all of these depictions not only reduce the Universe down to two dimensions (which you kind of have to do if you have only a flat, static image to use as your canvas), but that these aren’t meant to show two dimensions of space at all. Rather, the y-axis shows space, and in particular, the size of the observable Universe, while the x-axis shows time, and in particular, the amount of time that’s elapsed from the start of the hot Big Bang, which is usually shown beginning on the left, and evolves the Universe until it reaches the present day, which is shown all the way at the end on the right.
Even though this is how the Universe is commonly depicted, there are very few illustrations that actually inform you, with labels, that this is the short-cut being used.

Of course, this is hugely important! The Universe, as we know and understand it, on the largest of cosmic scales, is filled with various types (or species) of energy. In particular, it contains:
- dark energy, which today represents most of the energy in the Universe, to the tune of about 68%,
- dark matter, which is the second most abundant form of energy, making up about 27% of the Universe,
- normal matter, made up of the familiar protons, neutrons, and electrons, which makes up about 4.9% of the energy in the Universe,
- neutrinos, which are ghostly particles produced in nuclear interactions, exotic particle decays, radioactive decays, and the early stages of the Big Bang, which have a tiny but non-zero mass and make up about 0.1% of the energy in the Universe,
- and photons, or particles of light, which are primarily produced in the Big Bang and also, secondarily, in stars, and make up only around 0.01% of the energy in the Universe today.
However, these different forms of energy had different levels of relative importance in the past, as an expanding Universe increases in volume over time, but keeps the number of particles within it a constant. As a result, dark energy was initially very unimportant, but with a constant energy density, has become the dominant factor in the expanding Universe only recently: over the past few billion years. Before that, matter dominated the scene for a long time: from about 9000 years after the Big Bang until dark energy’s takeover a few billion years ago. But in the very early stages, radiation, mostly in the form of photons, was the dominant species of energy, which is what put the “hot” in the hot Big Bang.
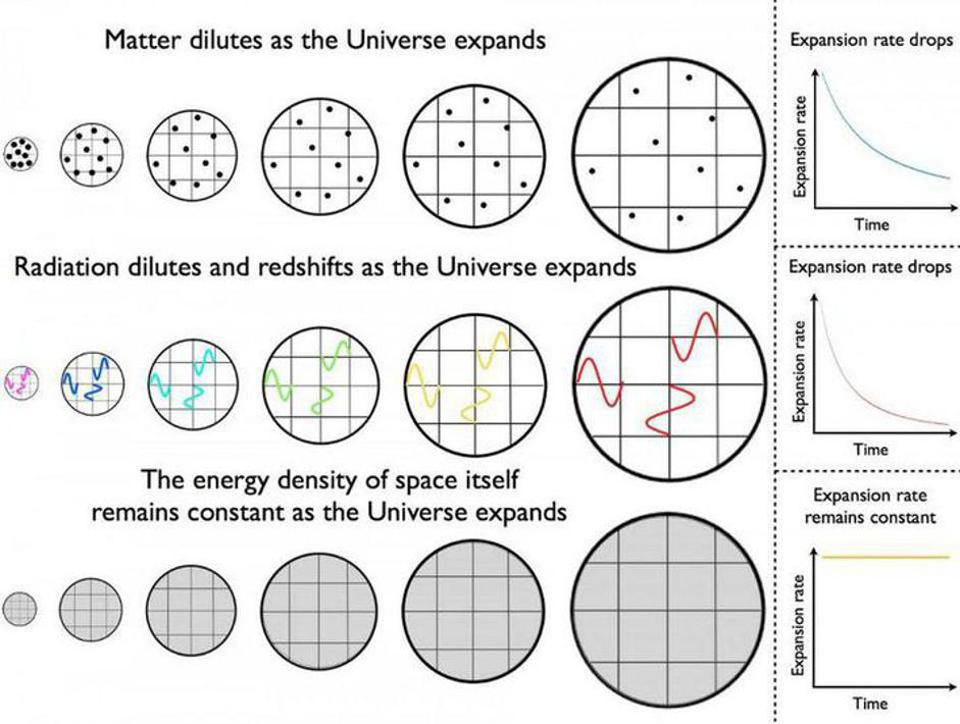
Because the energy density of the Universe and the rate at which the Universe expands are directly linked, that means that the Universe’s expansion rate has changed — specifically, has decreased — precipitously over time. Early on, the Universe was expanding very rapidly, and was dominated by high-energy radiation, with large number densities of photons, each with very high energies. As the Universe expanded, that radiation cooled off as it got stretched to longer and longer wavelengths. As the radiation cooled and the number density of particles diluted, the expansion rate dropped, all while progressively more and more distant light sources came into view.
When the Universe transitions from radiation domination to matter domination, the fact that the Universe is “cooling,” and that the radiation within it is being stretched to longer wavelengths and lower energies, is no longer important. It’s only the heavy, massive matter particles that play a major role, and so the energy density (and the expansion rate) drops as the volume of the Universe increases. Finally, when dark energy takes over, the expansion rate ceases to drop, and instead asymptotes to a constant value.
We can do this calculation for ourselves, and graph “the scale of the Universe” on the y-axis against “the age of the Universe” on the x-axis, and see how these two quantities change together.

This graph, generated by me, above, describes the expansion of the Universe from the early stages of the hot Big Bang until the present day. You can see that the Universe was much smaller in the past, but what’s perhaps more important to recognize is that there are two features in the graph above: one subtle and one obvious. The subtle feature, which you can check out for yourself by holding a straightedge (like a sheet of paper) up to your screen, is that the slope of what appears to be a straight line changes very slightly from the radiation-dominated epoch to the matter-dominated epoch. That’s because, when radiation dominates, the “cooling” aspect significantly affects the expansion rate, and hence, the scale of the Universe, while once matter comes to dominate, that aspect then becomes irrelevant.
But the second, more obvious feature is what arises when dark energy begins to dominate the cosmic story: the curve takes an “uptick” and stops being a straight line. This is because dark energy is a form of energy that acts as though it’s intrinsic to space itself: when space expands, additional quantities of “new space” get created in between the gaps of particles, and this new space has the same, constant energy density that all other locations in space do: you cannot have space without also having dark energy inherent to it. The scale of the Universe sharply increases because of the properties of dark energy, and this is what gives the familiar “cone” or “funnel” its flare-like shape near the end.

Of course, that doesn’t account for absolutely everything; there are two more aspects to the cosmic story encoded in these diagrams.
First, the Universe as we understand it didn’t actually begin with the hot Big Bang, but rather a phase known as cosmic inflation preceded and set up the hot Big Bang. During inflation, the way that cosmic expansion worked was very similar to the way it works during dark energy domination: the energy density remains constant and the expansion rate doesn’t decrease, causing the separation distance between any two points to increase exponentially as time goes on. Only, unlike today’s dark energy dominated phase, the expansion rate during inflation was tremendous!
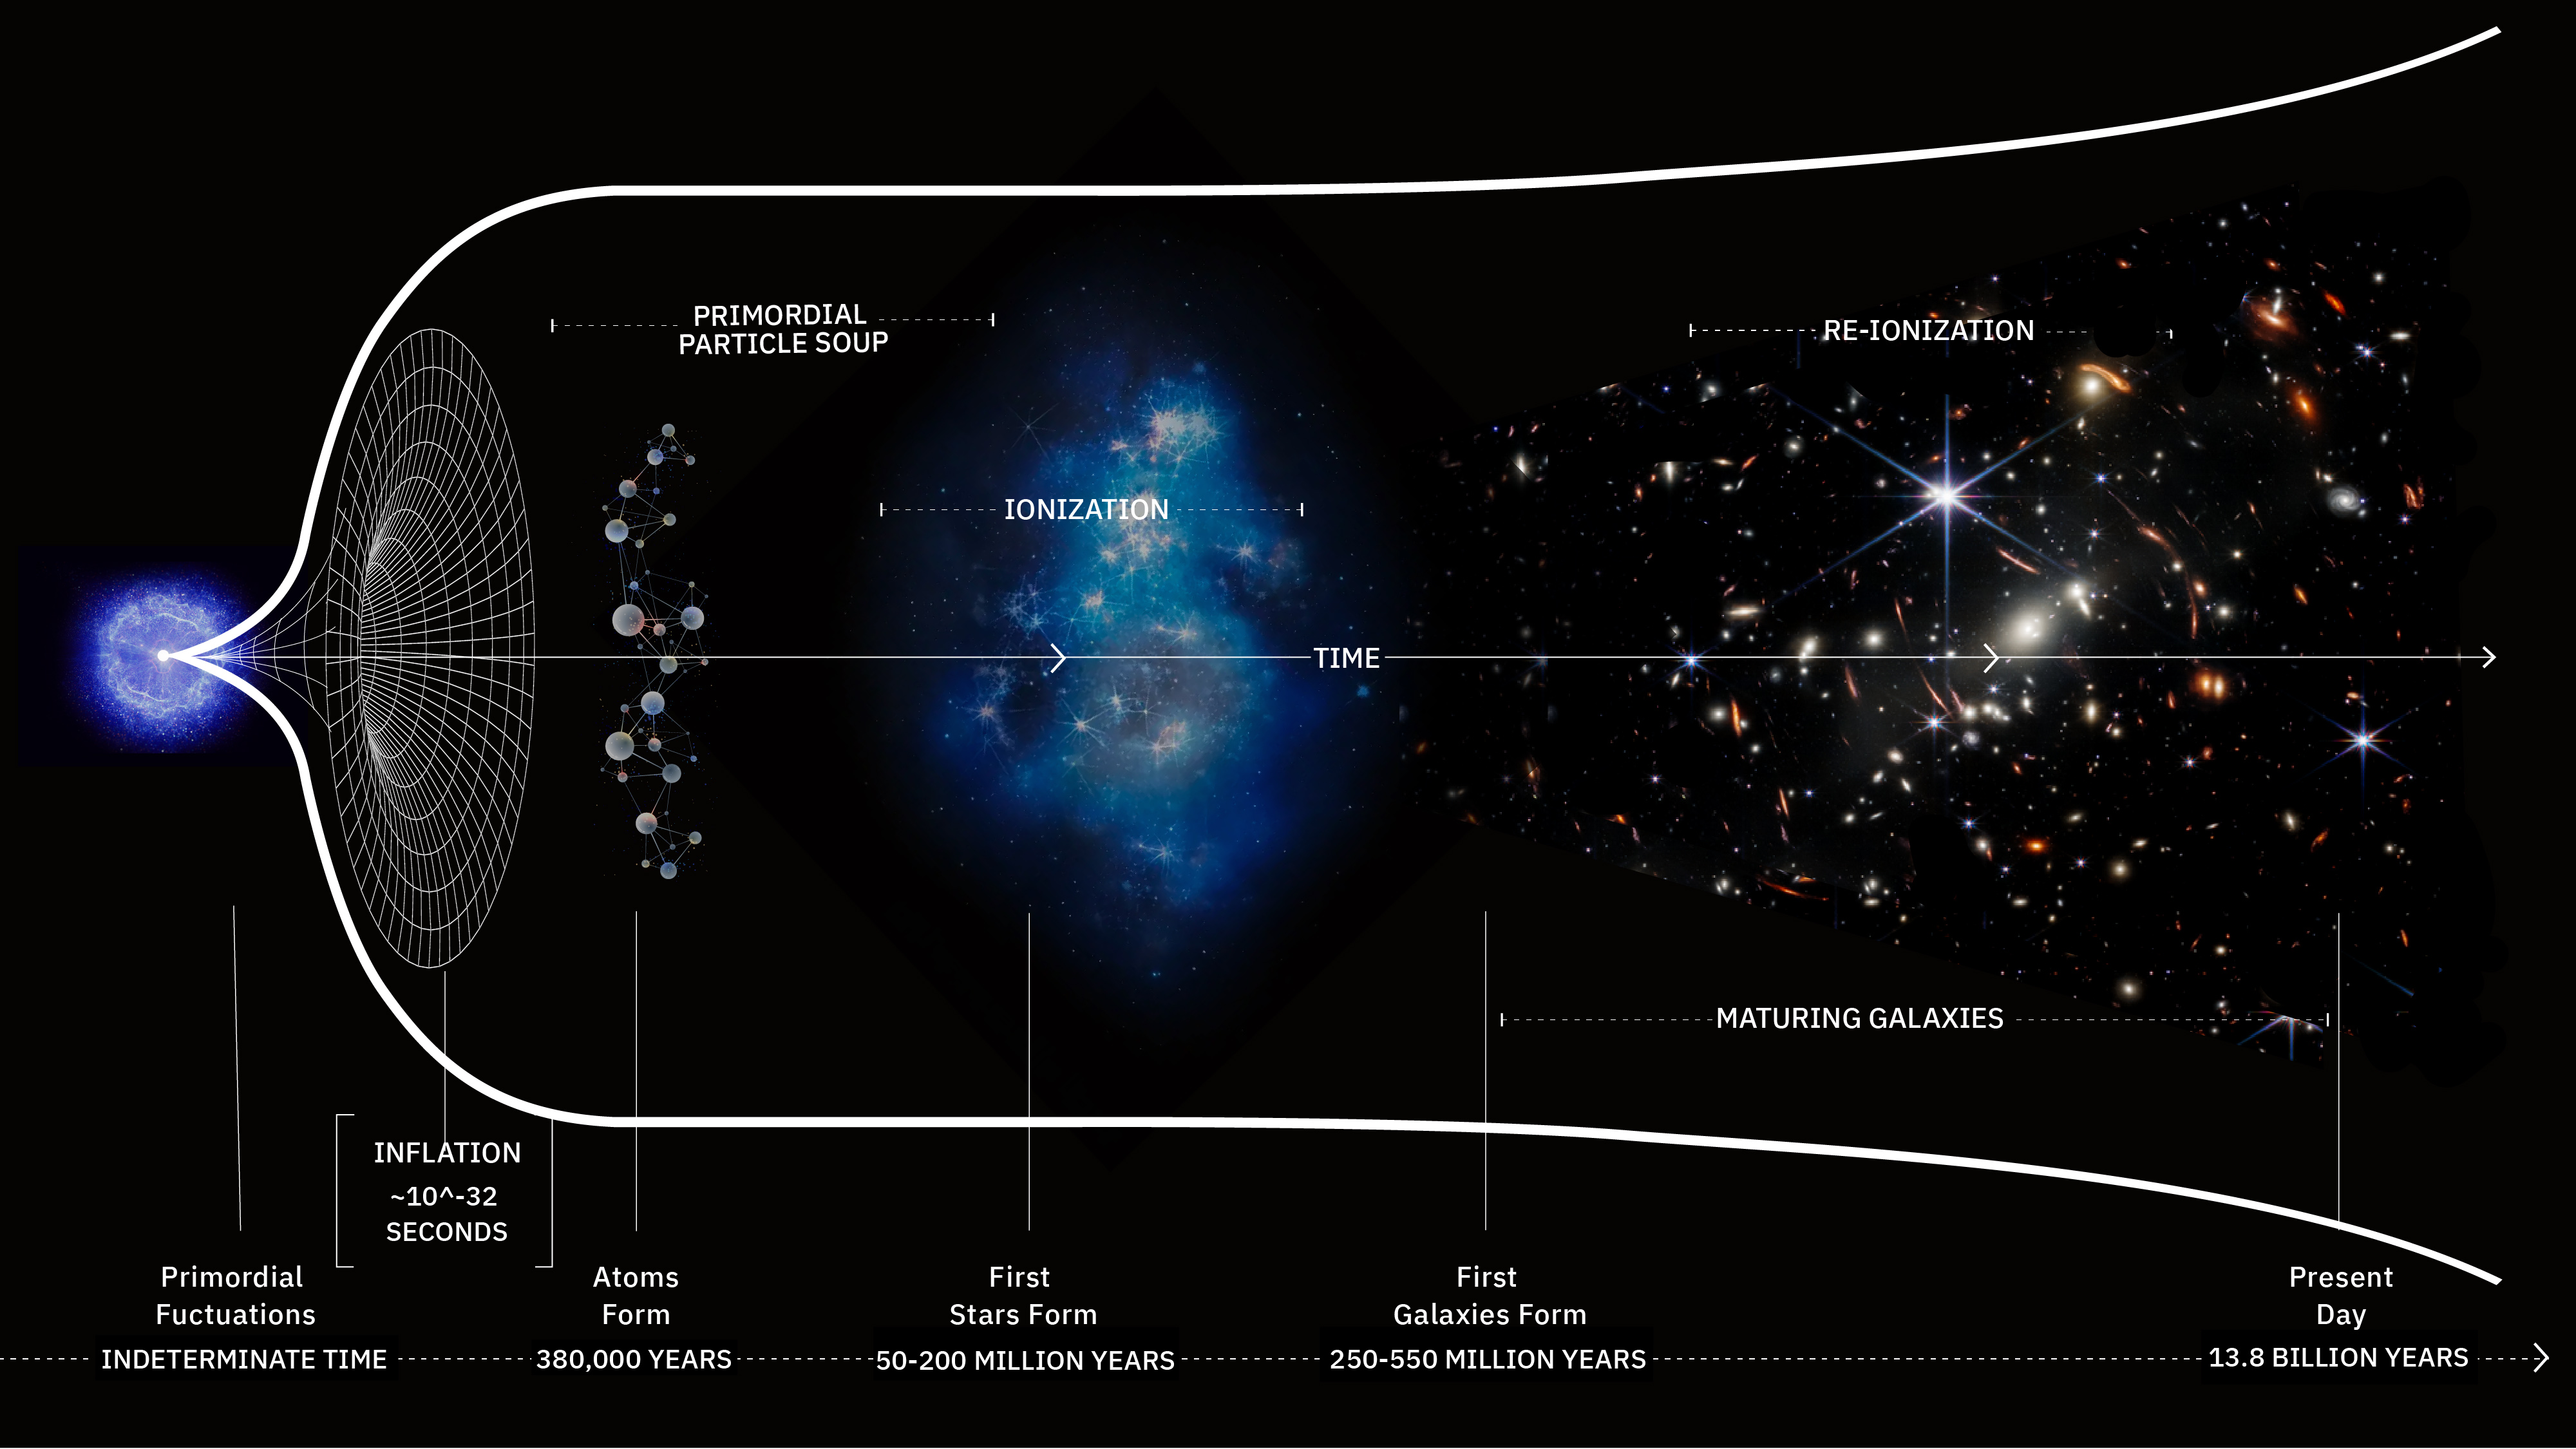
And second, once inflation ends and the hot Big Bang begins, the transition to a radiation-dominated phase is immediate, and this causes the Universe to rapidly evolve in the way we’re familiar with since the start of the hot Big Bang. Everything begins as a hot, dense, almost-uniform primordial particle soup, and then, as the Universe expands and cools:
- matter and antimatter annihilate away,
- protons and neutrons form,
- nuclear fusion creates the light elements,
- neutral atoms form,
- the earliest stars and galaxies form,
- and eventually, an intricate cosmic web, networking galaxies and the large-scale structure of the Universe together, comes into existence.
This story, of cosmic evolution in an expanding Universe containing the known species of energy in the proper ratios, is what these “cone-like” or “tube-like” illustrations attempt to encode.
There are fundamental limitations to what we can show with only a two-dimensional canvas and a four-dimensional (three of space and one of time) Universe. The most common depiction sacrifices showing the “sphere-like” nature of our observable Universe in order to more properly depict the evolution of time. However, this doesn’t mean (and was never intended to mean) that the Universe is shaped like a cone, tube, cylinder, or funnel; that shape appears because we are attempting to illustrate how the size/scale of the observable Universe grows with time: as we evolve from the left-end of the picture to the right, as time continues to pass.
If it were up to me, I would make an even more accurate version than what’s been created so far. I would label the axes and put scale marks on them, so you’d know what was evolving and by how much. I would clearly demarcate what epochs correspond to inflation, radiation-domination, matter-domination, and dark energy-domination. I wouldn’t have an “ignition point” at the beginning, because we have no information about whether inflation was preceded by a singularity or not. And, most importantly, I’d share with people that the x-axis represents the forward march of time, not any aspect of space.
Despite these fundamental limitations, the illustrations shown here (and others like it) truly do depict our expanding Universe in rich detail. But the misconceptions you have aren’t your fault; they’re representative of the breakdown in communication that’s certain to arise whenever too many short-cuts are taken.
Send in your Ask Ethan questions to startswithabang at gmail dot com!