Get smarter, faster. Subscribe to our daily newsletter.
The Nationalization of Congressional Elections
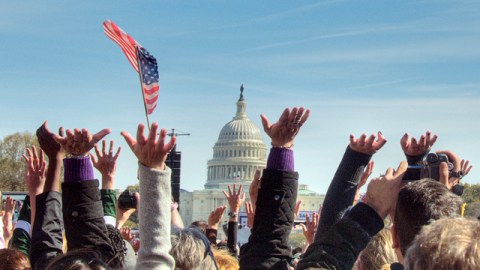
"Wave elections" may be becoming more common because of the intense political polarization that has emerged.

As demonstrated again in the 2010 elections, the single most significant fact about American politics over the last generation is the emergence of hyperpolarized political parties. The parties are both internally more unified than in prior decades and more sharply differentiated from each other. This is not a transient fact. This polarization has began roughly in the 1980s and has been increasing constantly ever since. Indeed, the 2010 election cycle saw an even further purification of the parties, as a number of more centrist or moderate figures were eliminated during the primary process. As I have written about, this hyperpolarization will have numerous consequences for both elections and governance, one of which was played out yesterday: congressional elections are likely to be more nationalized. They will be much more referenda on the political parties and their leaders than individualized judgments about particular House and Senate candidates. Candidates will rise and fall with the fate of their political parties more than in the past. And the fate of the parties will be heavily determined by public judgments about the party’s leaders, particularly, for the party in power, the President. That is the best explanation, I believe, of why we have now experienced three cycles in a row of “wave” elections, with yesterday’s being the most dramatic example.
Here’s the data to support the view that “wave elections” are becoming more common. From 1976-2004, there was only one year in which the shift (or “swing,” in the more technical jargon) in the aggregate, nationwide vote for the parties from one election cycle to the next exceeded 5% (for data, I am relying on this paper by Nagler and Issacharoff). That was in 1994, when the Republicans took over the House. On average during this period, the swing between the parties was 2.18% (if we include the dramatic 1994 election) and 1.89% (if we exclude 1994). But in 2006, the swing from 2004 was 7%, in favor of the Democrats. That is because the 2006 elections were a national referendum, in effect, on the Bush presidency at a moment at which that presidency had become widely unpopular, as demonstrated in Gary Jacobson’s analysis of those elections. Initial analysis from Nate Silver of yesterday’s results indicate that there was a swing of 6.7% for the Republicans from the prior election. The 2010 election, again, was a nationalized referenda, this time on the first two years of the Obama administration. Though individual factors influenced many races, the general pattern was again one in which candidates rose and fell with their party moreso than in earlier decades. From 1964-2004, there were only two elections with a swing of 6% or more, 1966 and 1994. We have now had at least two elections involving this kind of swing in the last four years.
Why are “wave elections” becoming so much more common? My hypothesis is that it’s because of the intense polarization of the parties that has emerged. This polarization does not guarantee that we will see much more dramatic swings for and against the parties; voters might have stable preferences between the parties over long periods of time, even if the parties are sharply polarized. But this polarization makes wave elections more likely. When the party labels represent clearly identifiable brands that are sharply distinct from each other, voters are more able, and more likely, to link the fates of individual candidates to each other through the party label. Parties always try to nationalize congressional elections, if they think that’s in their favor, or make them about individual candidates, if they think that’s in their favor. But the effort to nationalize these elections is likely to be much more effective in our era, in which the parties represent so much more of a consistent, unified, and sharply differentiated brand. Hence, polarization, nationalization of elections, and waves of shift in support between the parties all go hand in hand.
Many other implications follow from the way polarization makes nationalization of elections more likely. Briefly, here’s another one—I sometimes get asked why, if congressional districts are so gerrymandered, has there been so much turnover in Congress in 2006, 2008, and now 2010? The answer, I believe, is nationalization of the elections. Congressional seats are safer than in the past: it takes a much greater shift in votes to the opposite party to throw out those who were elected in the new districts created after the 2000 Census. But, those much larger shifts are now more likely, as we have seen in these last three election cycles. These tidal waves are large enough to overcome the extent to which gerrymanders are able to insulate seats. If this is too brief to be clear, I will elaborate in another posting. But for now, I want to emphasize the link between party polarization and nationalization of elections, and begin to raise issues about the consequences for various aspects of elections and governance.
How New York's largest hospital system is predicting COVID-19 spikes
Northwell Health is using insights from website traffic to forecast COVID-19 hospitalizations two weeks in the future.
- The machine-learning algorithm works by analyzing the online behavior of visitors to the Northwell Health website and comparing that data to future COVID-19 hospitalizations.
- The tool, which uses anonymized data, has so far predicted hospitalizations with an accuracy rate of 80 percent.
- Machine-learning tools are helping health-care professionals worldwide better constrain and treat COVID-19.
The value of forecasting
<img type="lazy-image" data-runner-src="https://assets.rebelmouse.io/eyJhbGciOiJIUzI1NiIsInR5cCI6IkpXVCJ9.eyJpbWFnZSI6Imh0dHBzOi8vYXNzZXRzLnJibC5tcy8yNTA0Njk2OC9vcmlnaW4uanBnIiwiZXhwaXJlc19hdCI6MTYyMzM2NDQzOH0.rid9regiDaKczCCKBsu7wrHkNQ64Vz_XcOEZIzAhzgM/img.jpg?width=980" id="2bb93" class="rm-shortcode" data-rm-shortcode-id="31345afbdf2bd408fd3e9f31520c445a" data-rm-shortcode-name="rebelmouse-image" data-width="1546" data-height="1056" />Northwell emergency departments use the dashboard to monitor in real time.
Credit: Northwell Health
<p>One unique benefit of forecasting COVID-19 hospitalizations is that it allows health systems to better prepare, manage and allocate resources. For example, if the tool forecasted a surge in COVID-19 hospitalizations in two weeks, Northwell Health could begin:</p><ul><li>Making space for an influx of patients</li><li>Moving personal protective equipment to where it's most needed</li><li>Strategically allocating staff during the predicted surge</li><li>Increasing the number of tests offered to asymptomatic patients</li></ul><p>The health-care field is increasingly using machine learning. It's already helping doctors develop <a href="https://care.diabetesjournals.org/content/early/2020/06/09/dc19-1870" target="_blank">personalized care plans for diabetes patients</a>, improving cancer screening techniques, and enabling mental health professionals to better predict which patients are at <a href="https://healthitanalytics.com/news/ehr-data-fuels-accurate-predictive-analytics-for-suicide-risk" target="_blank" rel="noopener noreferrer">elevated risk of suicide</a>, to name a few applications.</p><p>Health systems around the world have already begun exploring how <a href="https://www.ncbi.nlm.nih.gov/pmc/articles/PMC7315944/" target="_blank" rel="noopener noreferrer">machine learning can help battle the pandemic</a>, including better COVID-19 screening, diagnosis, contact tracing, and drug and vaccine development.</p><p>Cruzen said these kinds of tools represent a shift in how health systems can tackle a wide variety of problems.</p><p>"Health care has always used the past to predict the future, but not in this mathematical way," Cruzen said. "I think [Northwell Health's new predictive tool] really is a great first example of how we should be attacking a lot of things as we go forward."</p>Making machine-learning tools openly accessible
<p>Northwell Health has made its predictive tool <a href="https://github.com/northwell-health/covid-web-data-predictor" target="_blank">available for free</a> to any health system that wishes to utilize it.</p><p>"COVID is everybody's problem, and I think developing tools that can be used to help others is sort of why people go into health care," Dr. Cruzen said. "It was really consistent with our mission."</p><p>Open collaboration is something the world's governments and health systems should be striving for during the pandemic, said Michael Dowling, Northwell Health's president and CEO.</p><p>"Whenever you develop anything and somebody else gets it, they improve it and they continue to make it better," Dowling said. "As a country, we lack data. I believe very, very strongly that we should have been and should be now working with other countries, including China, including the European Union, including England and others to figure out how to develop a health surveillance system so you can anticipate way in advance when these things are going to occur."</p><p>In all, Northwell Health has treated more than 112,000 COVID patients. During the pandemic, Dowling said he's seen an outpouring of goodwill, collaboration, and sacrifice from the community and the tens of thousands of staff who work across Northwell.</p><p>"COVID has changed our perspective on everything—and not just those of us in health care, because it has disrupted everybody's life," Dowling said. "It has demonstrated the value of community, how we help one another."</p>3,000-pound Triceratops skull unearthed in South Dakota
"You dream about these kinds of moments when you're a kid," said lead paleontologist David Schmidt.
Excavation of a triceratops skull in South Dakota.
- The triceratops skull was first discovered in 2019, but was excavated over the summer of 2020.
- It was discovered in the South Dakota Badlands, an area where the Triceratops roamed some 66 million years ago.
- Studying dinosaurs helps scientists better understand the evolution of all life on Earth.
Credit: David Schmidt / Westminster College
<p style="margin-left: 20px;">"We had to be really careful," Schmidt told St. Louis Public Radio. "We couldn't disturb anything at all, because at that point, it was under law enforcement investigation. They were telling us, 'Don't even make footprints,' and I was thinking, 'How are we supposed to do that?'"</p><p>Another difficulty was the mammoth size of the skull: about 7 feet long and more than 3,000 pounds. (For context, the largest triceratops skull ever unearthed was about <a href="https://www.tandfonline.com/doi/abs/10.1080/02724634.2010.483632" target="_blank">8.2 feet long</a>.) The skull of Schmidt's dinosaur was likely a <em>Triceratops prorsus, </em>one of two species of triceratops that roamed what's now North America about 66 million years ago.</p>Credit: David Schmidt / Westminster College
<p>The triceratops was an herbivore, but it was also a favorite meal of the T<em>yrannosaurus rex</em>. That probably explains why the Dakotas contain many scattered triceratops bone fragments, and, less commonly, complete bones and skulls. In summer 2019, for example, a separate team on a dig in North Dakota made <a href="https://www.nytimes.com/2019/07/26/science/triceratops-skull-65-million-years-old.html" target="_blank">headlines</a> after unearthing a complete triceratops skull that measured five feet in length.</p><p>Michael Kjelland, a biology professor who participated in that excavation, said digging up the dinosaur was like completing a "multi-piece, 3-D jigsaw puzzle" that required "engineering that rivaled SpaceX," he jokingly told the <a href="https://www.nytimes.com/2019/07/26/science/triceratops-skull-65-million-years-old.html" target="_blank">New York Times</a>.</p>Morrison Formation in Colorado
James St. John via Flickr
Triceratops illustration
Credit: Nobu Tamura/Wikimedia Commons |
World's oldest work of art found in a hidden Indonesian valley
Archaeologists discover a cave painting of a wild pig that is now the world's oldest dated work of representational art.
Pig painting at Leang Tedongnge in Indonesia, made at 45,500 years ago.
- Archaeologists find a cave painting of a wild pig that is at least 45,500 years old.
- The painting is the earliest known work of representational art.
- The discovery was made in a remote valley on the Indonesian island of Sulawesi.
Oldest Cave Art Found in Sulawesi
<span style="display:block;position:relative;padding-top:56.25%;" class="rm-shortcode" data-rm-shortcode-id="a9734e306f0914bfdcbe79a1e317a7f0"><iframe type="lazy-iframe" data-runner-src="https://www.youtube.com/embed/b-wAYtBxn7E?rel=0" width="100%" height="auto" frameborder="0" scrolling="no" style="position:absolute;top:0;left:0;width:100%;height:100%;"></iframe></span>What can Avicenna teach us about the mind-body problem?
The Persian polymath and philosopher of the Islamic Golden Age teaches us about self-awareness.
The incredible physics behind quantum computing
Can computers do calculations in multiple universes? Scientists are working on it. Step into the world of quantum computing.