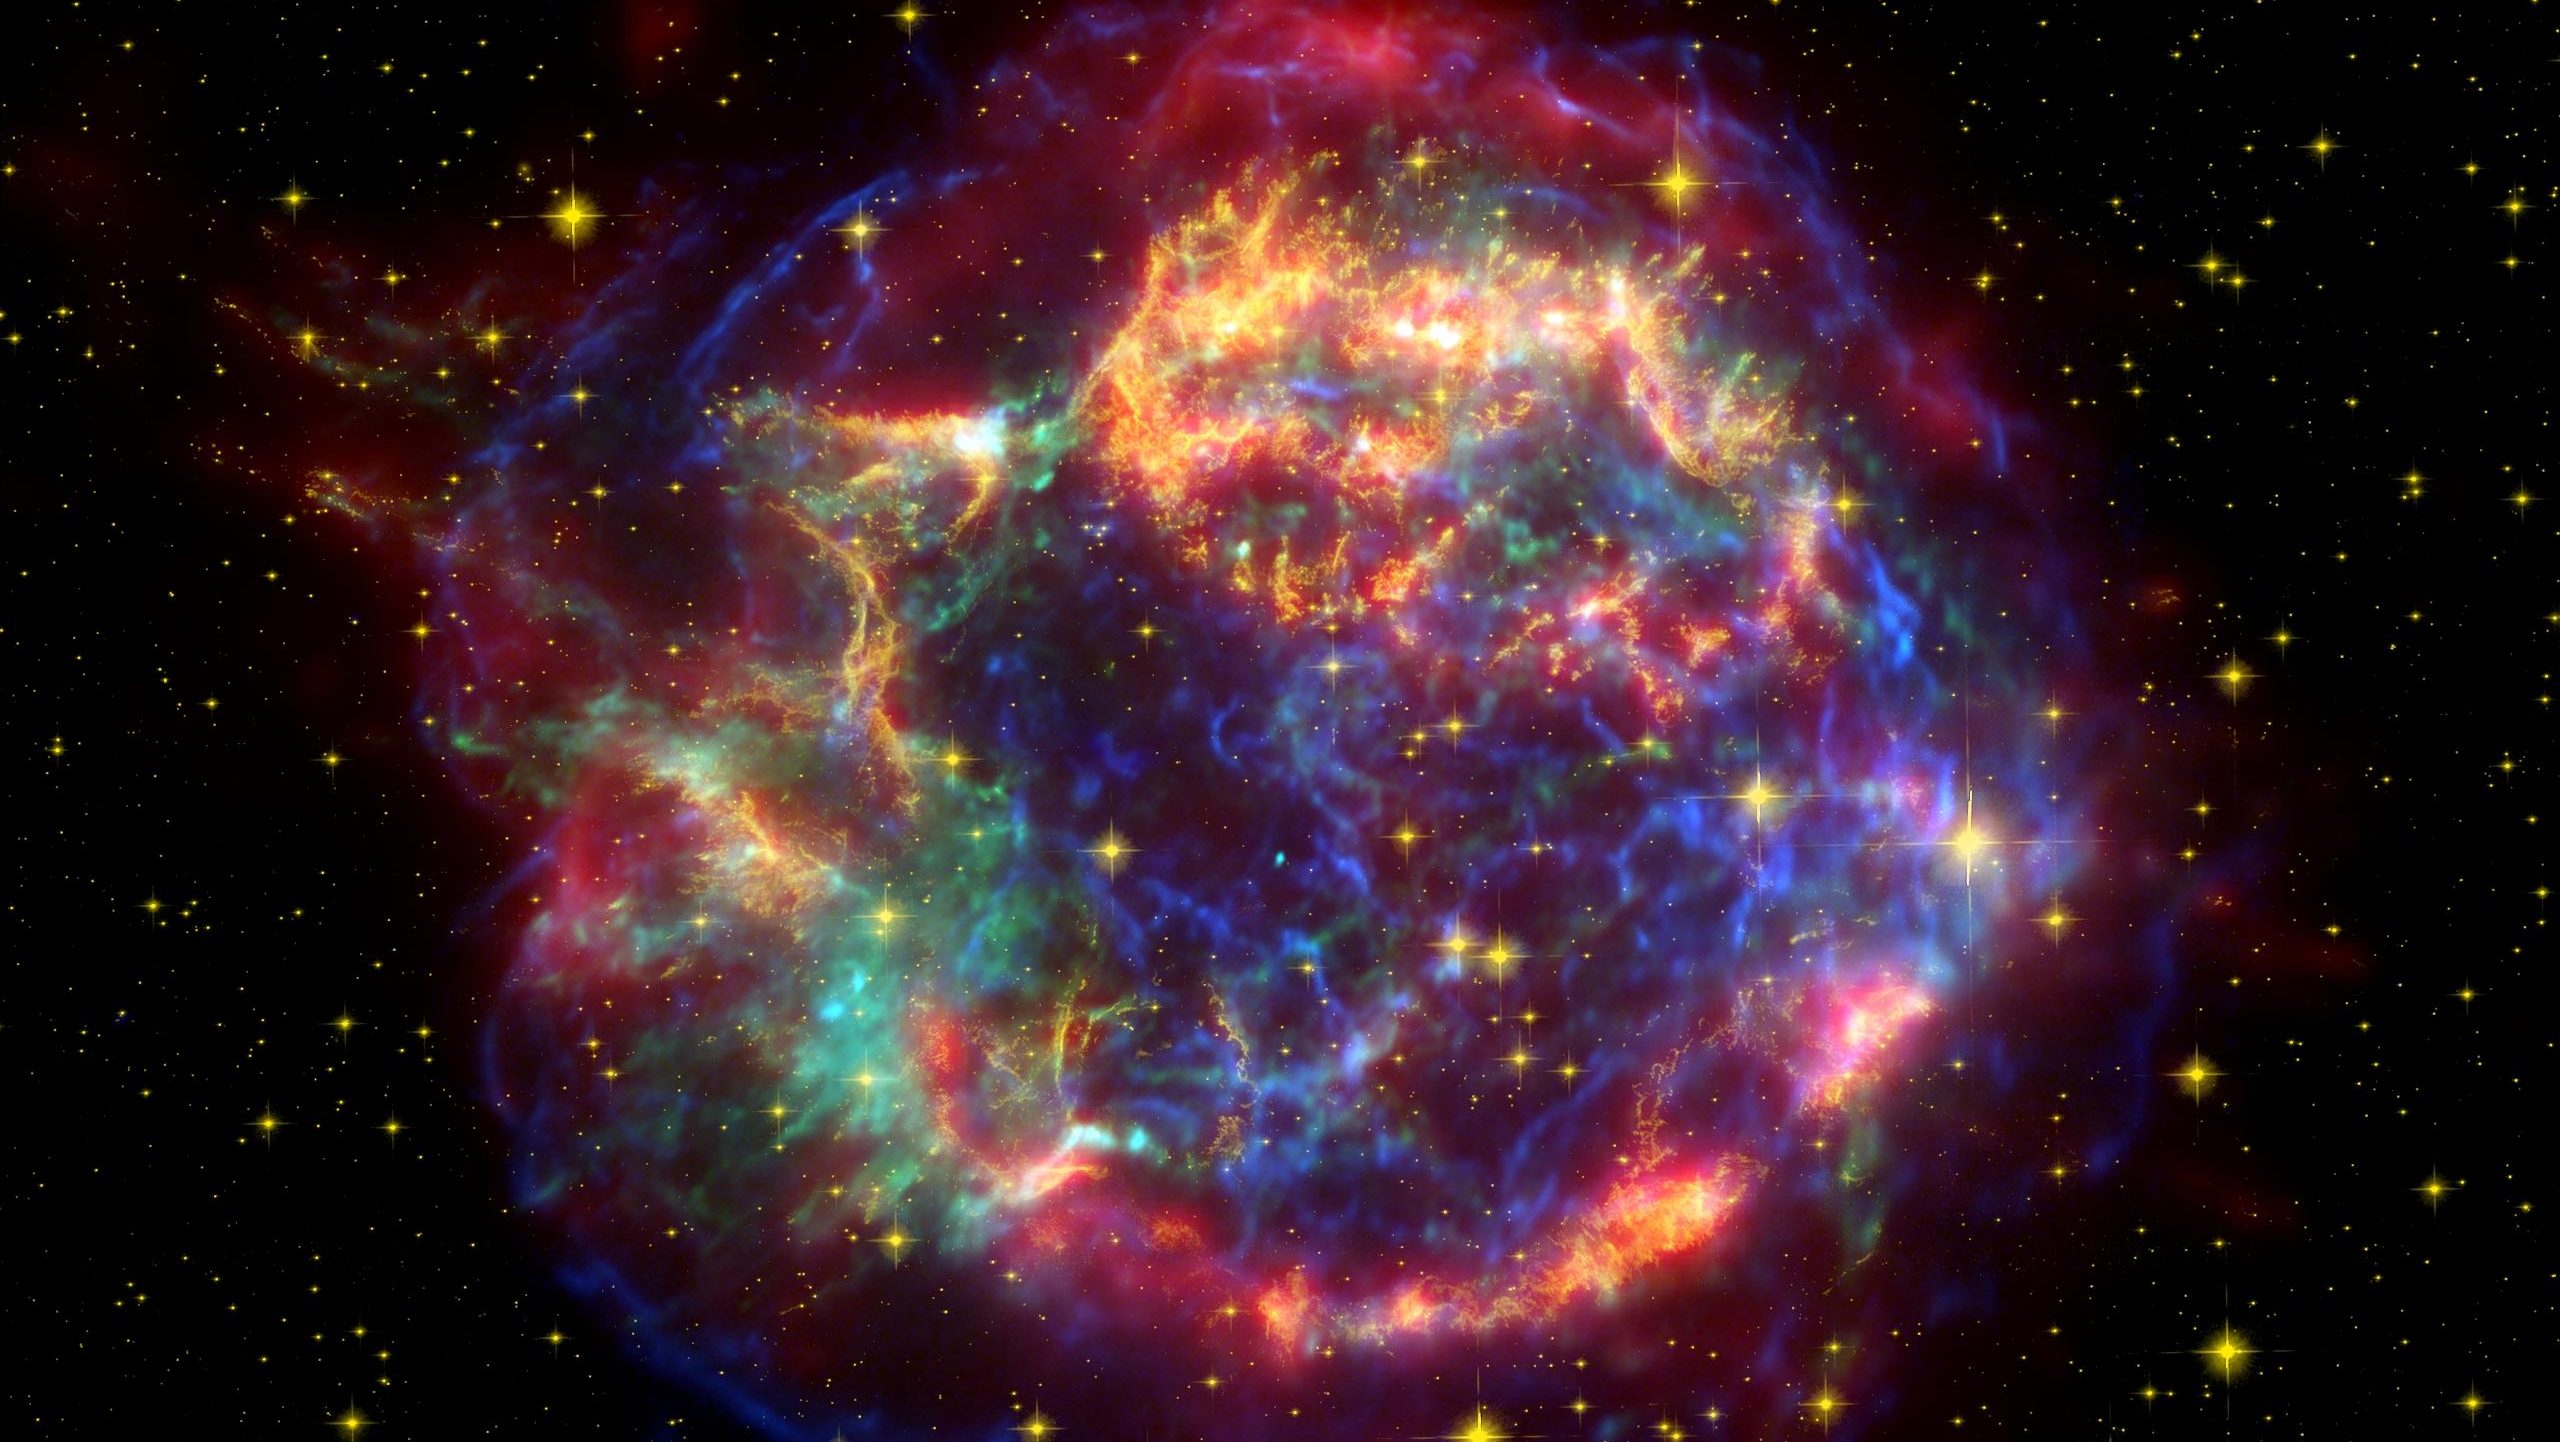
Record-breaking Pantheon+ supernova study reveals what makes up our Universe
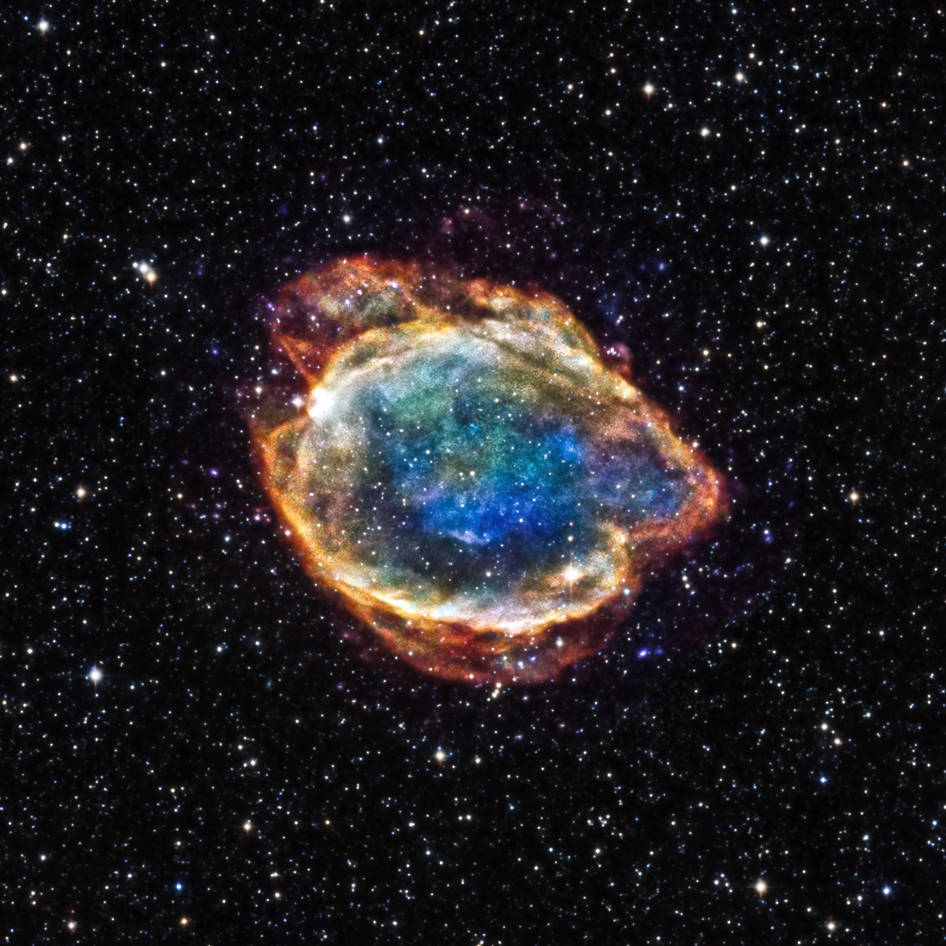
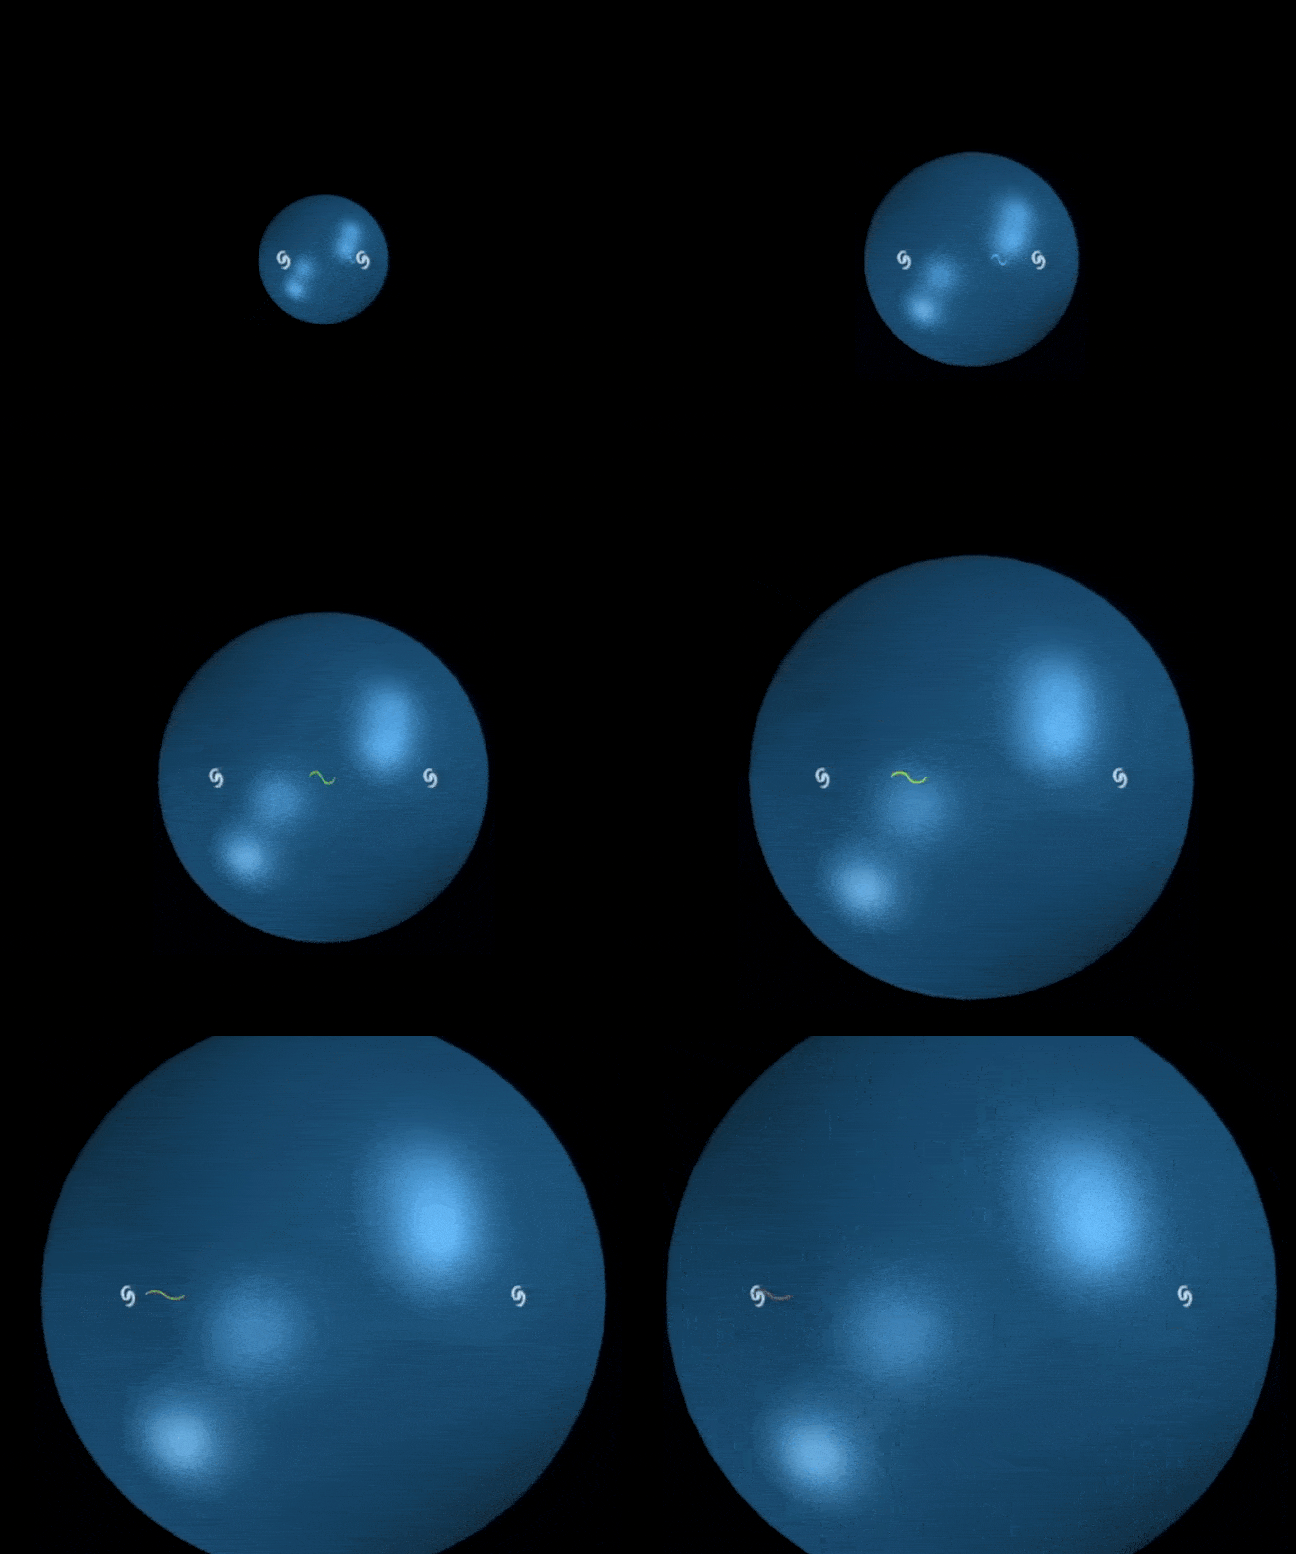
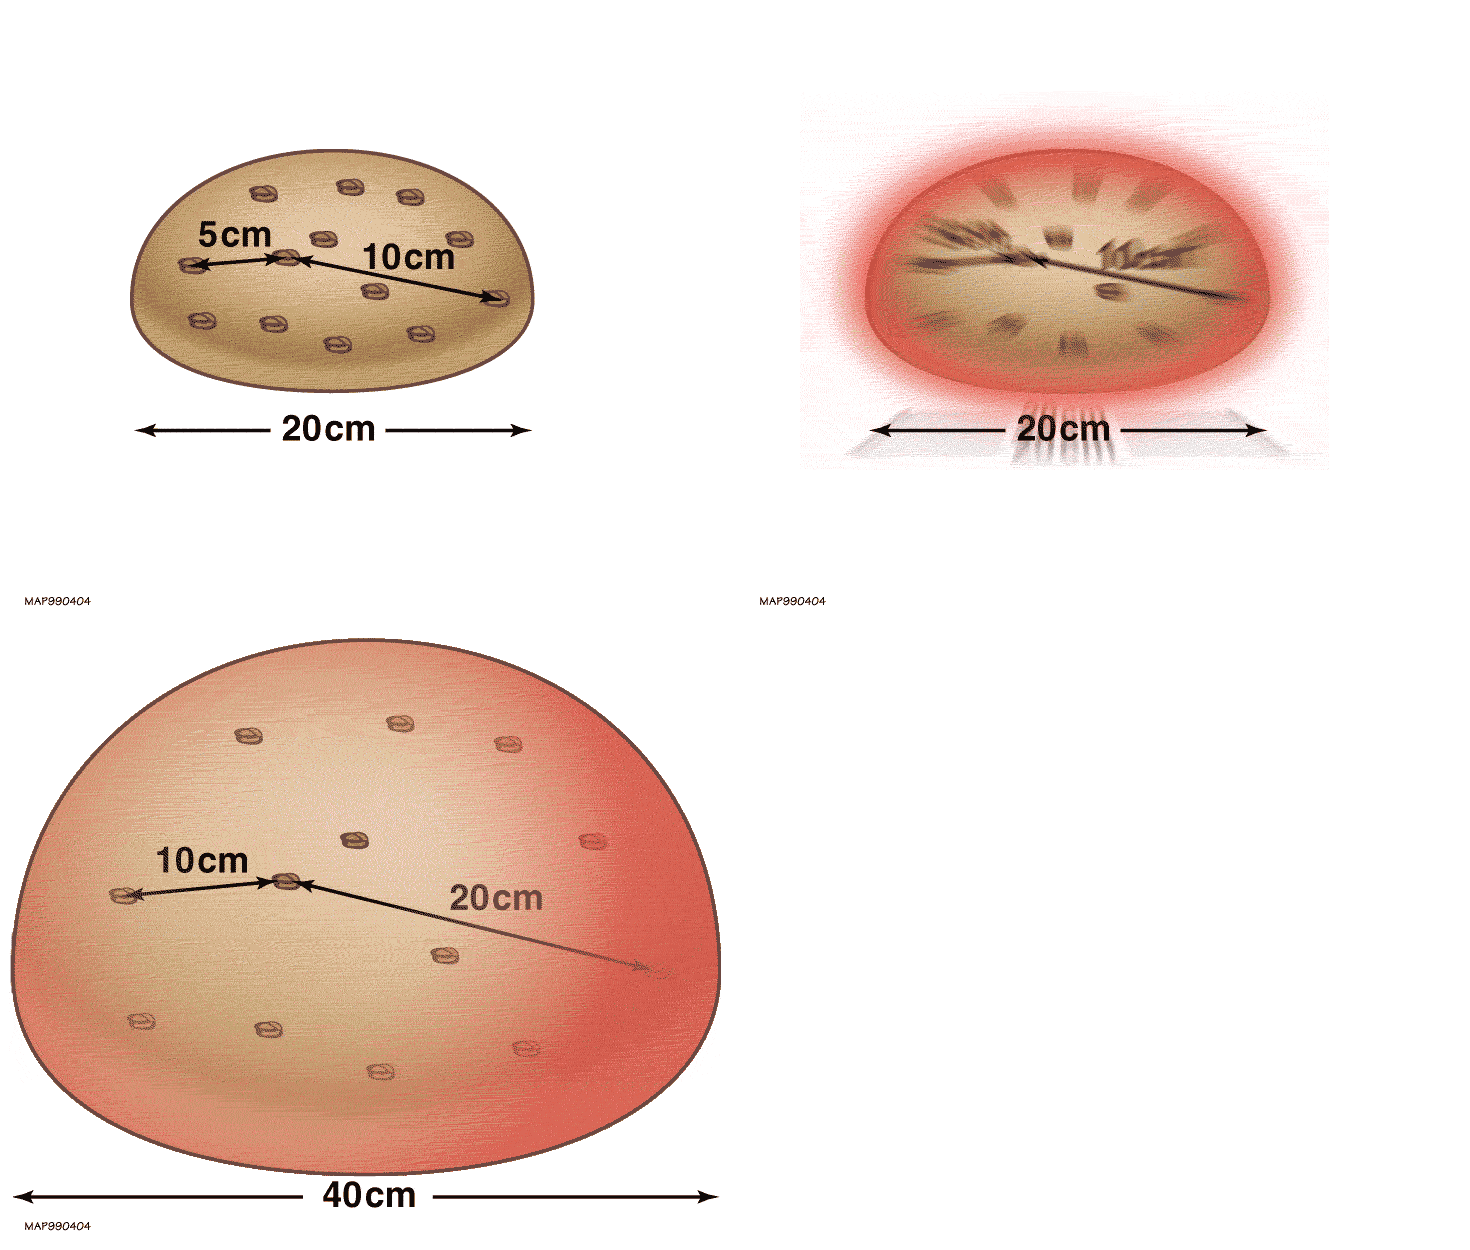
- In 1998, two different collaborations studying supernovae across cosmic time both revealed the same startling conclusion: the Universe wasn’t just expanding, but distant galaxies were receding faster and faster as time went on.
- Since then, we’ve found multiple different ways to measure the expanding Universe, and have converged on a “Standard Model” of cosmology, although some discrepancies still remain.
- In a landmark study just released by Pantheon+, the most comprehensive type Ia supernova data set was just analyzed for its cosmological implications. Here are the results.
Our never-ending quest, in both physics and astronomy, is perhaps the most ambitious one of all: to understand the Universe at a fundamental level. Questions such as:
- what is it that makes up the Universe?
- what ratios of the various ingredients that exist are present?
- how did the Universe come to be the way it is today?
- how did it all begin?
- and what will our ultimate fate, in the far future, actually turn out to be?
used to be in the realm of the unanswerable. Yet, over the past 200 years, they’ve moved from the realm of the theologians, philosophers, and poets into the scientific realm. For the first time in human history, and perhaps in all of existence, we can answer these questions knowingly, having revealed the truths that are written out there on the face of the cosmos itself.
Each time we improve upon our best methods for measuring the Universe — through more precise data, larger data sets, improved techniques, superior instrumentation, and smaller errors — we get an opportunity to advance what we know. One of the most powerful ways we have to probe the Universe is through a specific type of supernovae: type Ia explosions, whose light allows us to determine how the Universe has evolved and expanded over time. With a record-breaking 1550 type Ia supernovae in their February 2020 data set, the Pantheon+ team just released a preprint of a new paper detailing the current state of cosmology. Here, to the best of human knowledge, is what we’ve learned about the Universe we inhabit.
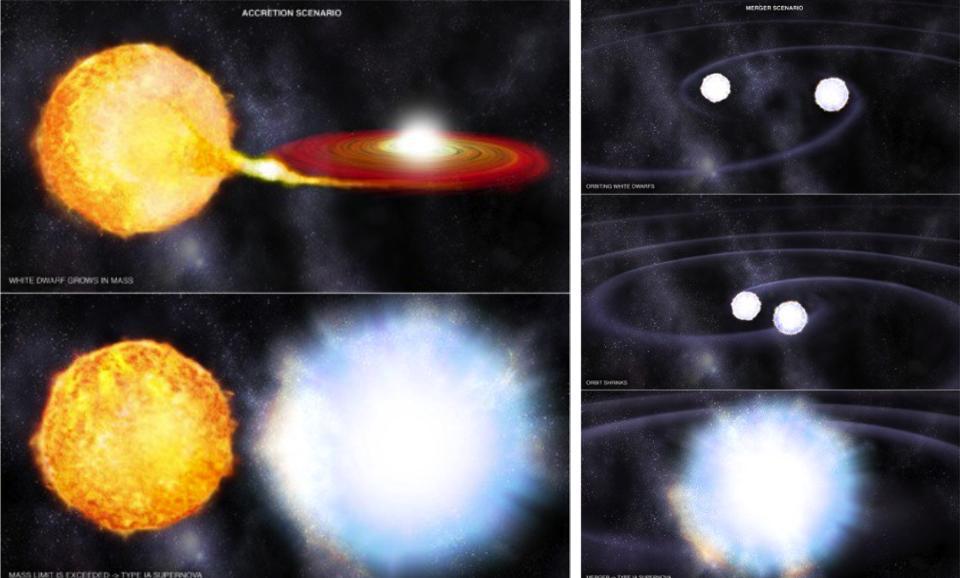
Credit: NASA/CXC/M. Weiss
How type Ia supernovae work
Right now, all throughout the Universe, the corpses of Sun-like stars that have completed their life cycles persist. These stellar remnants all have a few things in common: they’re all hot, faint, composed of atoms held up by the degeneracy pressure of their electrons, and come in at a mass that’s under about ~1.4 times the mass of the Sun.
But some of them have binary companions, and can siphon mass off of them if their orbits are close enough.
And others will encounter other white dwarfs, which can lead to an eventual merger.
And others will encounter matter of other types, including other stars and massive clumps of matter.
When these events occur, the atoms at the center of the white dwarf — if the total mass exceeds a particular critical threshold — will become so densely packed under extreme conditions that the various nuclei of those atoms will begin fusing together. The products of those initial reactions will catalyze fusion reactions in the surrounding material, and eventually the entire stellar remnant, the white dwarf itself, will be torn apart in a runaway fusion reaction. This results in a supernova explosion with no remnant, neither black hole nor neutron star, but with a particular light-curve that we can observe: a brightening, a peak, and a fall-off, characteristic of all type Ia supernovae.
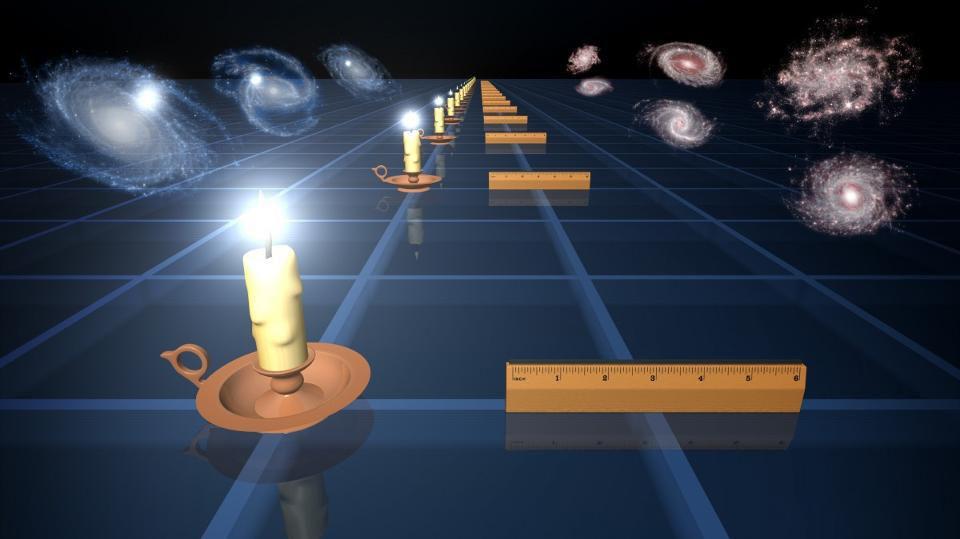
Credit: NASA/JPL-Caltech
How type Ia supernovae reveal the Universe
So, if you have all of these different explosions happening all throughout the Universe wherever you have white dwarfs — which is basically everywhere — what can you do with them? One key is to recognize that these objects are relatively standard: sort of like the cosmic version of a 60-Watt light bulb. If you know you have a 60-Watt light bulb, then you know how intrinsically bright and luminous this light source is. If you can measure how bright this light appears to you, then you can calculate, just with a little bit of math, how far away that light bulb has to be.
In astronomy we don’t have light bulbs, but these type Ia supernova serve the same function: they’re an example of what we call standard candles. We know how intrinsically bright they are, so when we measure their light curves and see how bright they appear (along with a few other characteristics), we can calculate how far away they are from us.
When we add in a couple of other pieces of information, such as:
- how severely the light from these supernovae is redshifted,
- and how redshifts and distances are related to the various forms of energy that exist in the context of the expanding Universe,
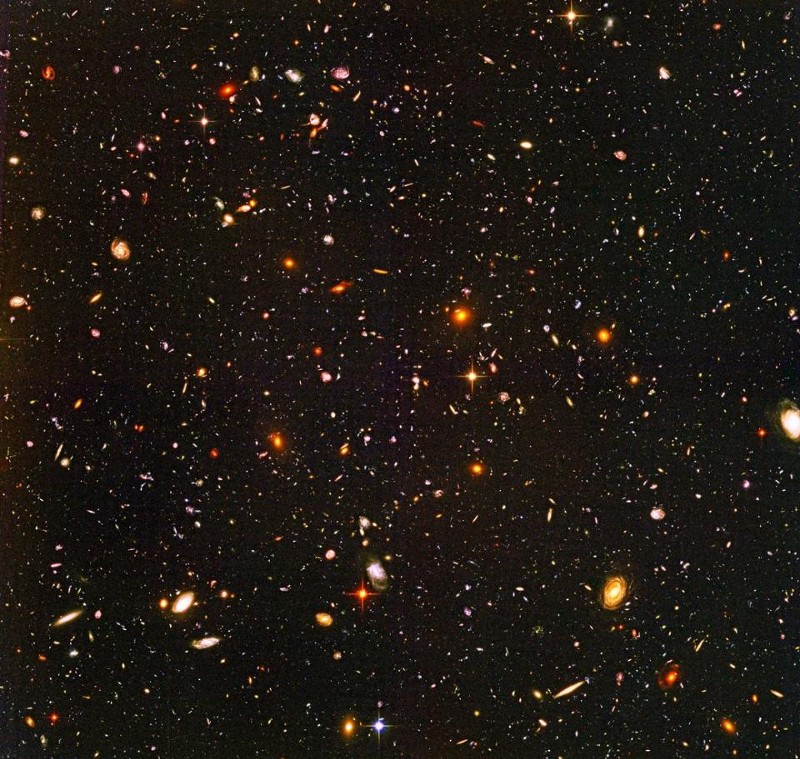
we can use this supernova data to learn about what is present in the Universe and how space has expanded over its history. With 1550 individual type Ia supernovae that span 10.7 billion years of cosmic history, the latest Pantheon+ results are a feast for the cosmically curious.
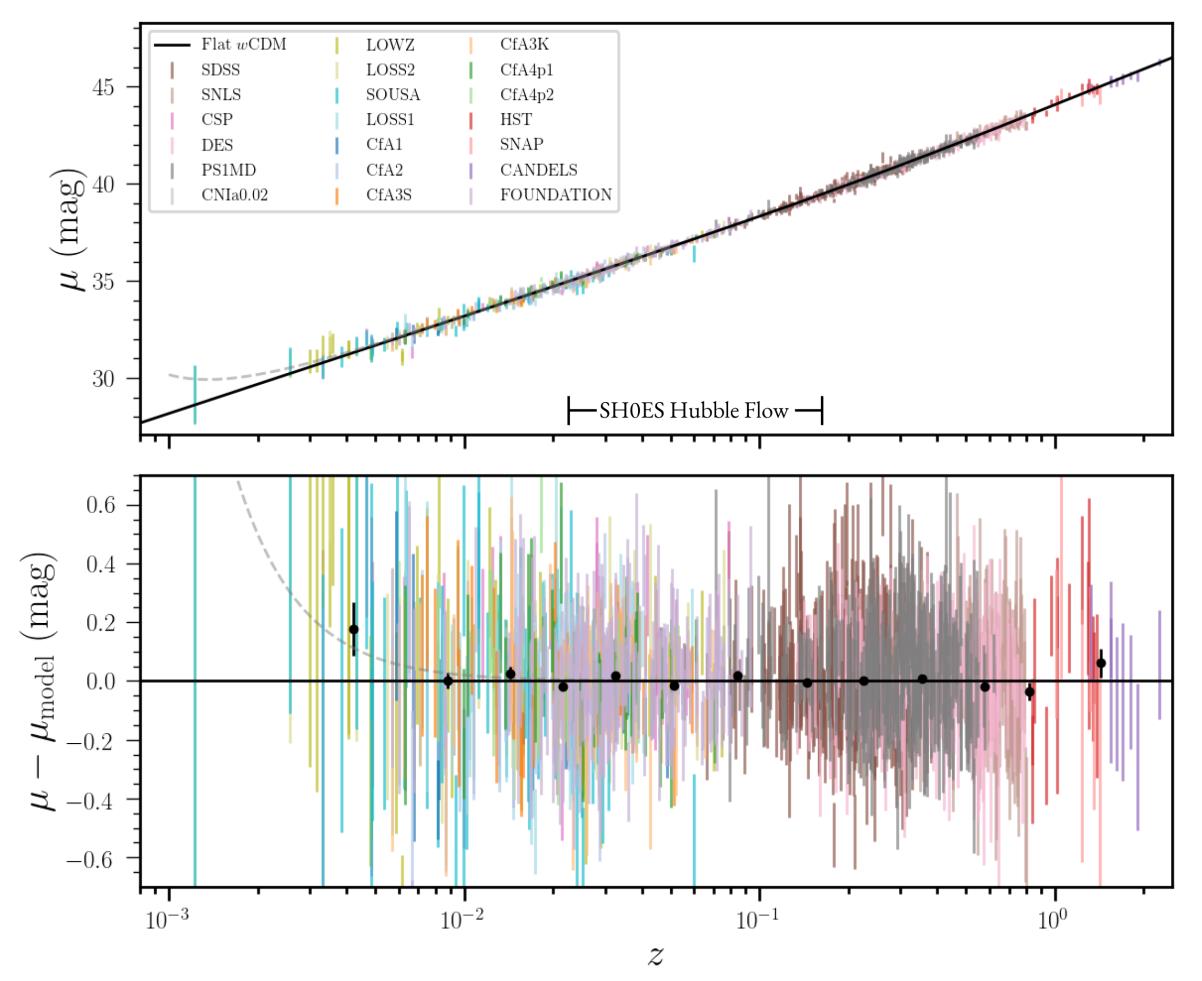
Credit: D. Brout et al./Pantheon+, Astrophysical Journal, 2022
How is the Universe expanding?
This is the question that the supernova data is exquisite at answering directly: with the fewest number of assumptions and with minimal errors inherent to their methods. For every individual supernova that we observe, we:
- measure the light,
- infer the distance to the object in the context of the expanding Universe,
- also measure the redshift (often via the redshift to the identified host galaxy),
- and then plot them all together.
That’s precisely what the above graph shows: the relationship between the measured brightness of the distant supernovae (on the y-axis) and the measured redshift (on the x-axis) for each supernova.
The black line you see shows the results you expect from the best-fit cosmological model, assuming that there’s nothing funny or fishy (i.e., that there’s no new, unidentified physics) going on. Meanwhile, the top panel shows the individual data points, with error bars, superimposed atop the cosmological model, while the bottom panel simply “subtracts out” that best-fit line and displays departures from the expected behavior.
As you can see, the agreement between theory and observation is spectacular. The Universe is expanding completely consistently with the known laws of physics, and even at the greatest distances — shown by the red and violet data points — there are no discernible discrepancies.
Credit: D. Brout et al./Pantheon+, ApJ submitted, 2022
What makes up the Universe?
Now we start to get into the fun part: using this data to figure out what’s going on with the cosmos on the largest scales. The Universe is made up of many different types of particles and fields, including:
- dark energy, which is some sort of energy intrinsic to the fabric of space,
- dark matter, which causes most of the gravitational attraction in the Universe,
- normal matter, including stars, planets, gas, dust, plasma, black holes, and everything else made of protons, neutrons, and/or electrons,
- neutrinos, which are extremely light particles that have a non-zero rest mass, but which outnumber normal matter particles by about a billion-to-one,
- and photons, or particles of light, which are produced at early times in the hot Big Bang and at late times by stars, among other sources.
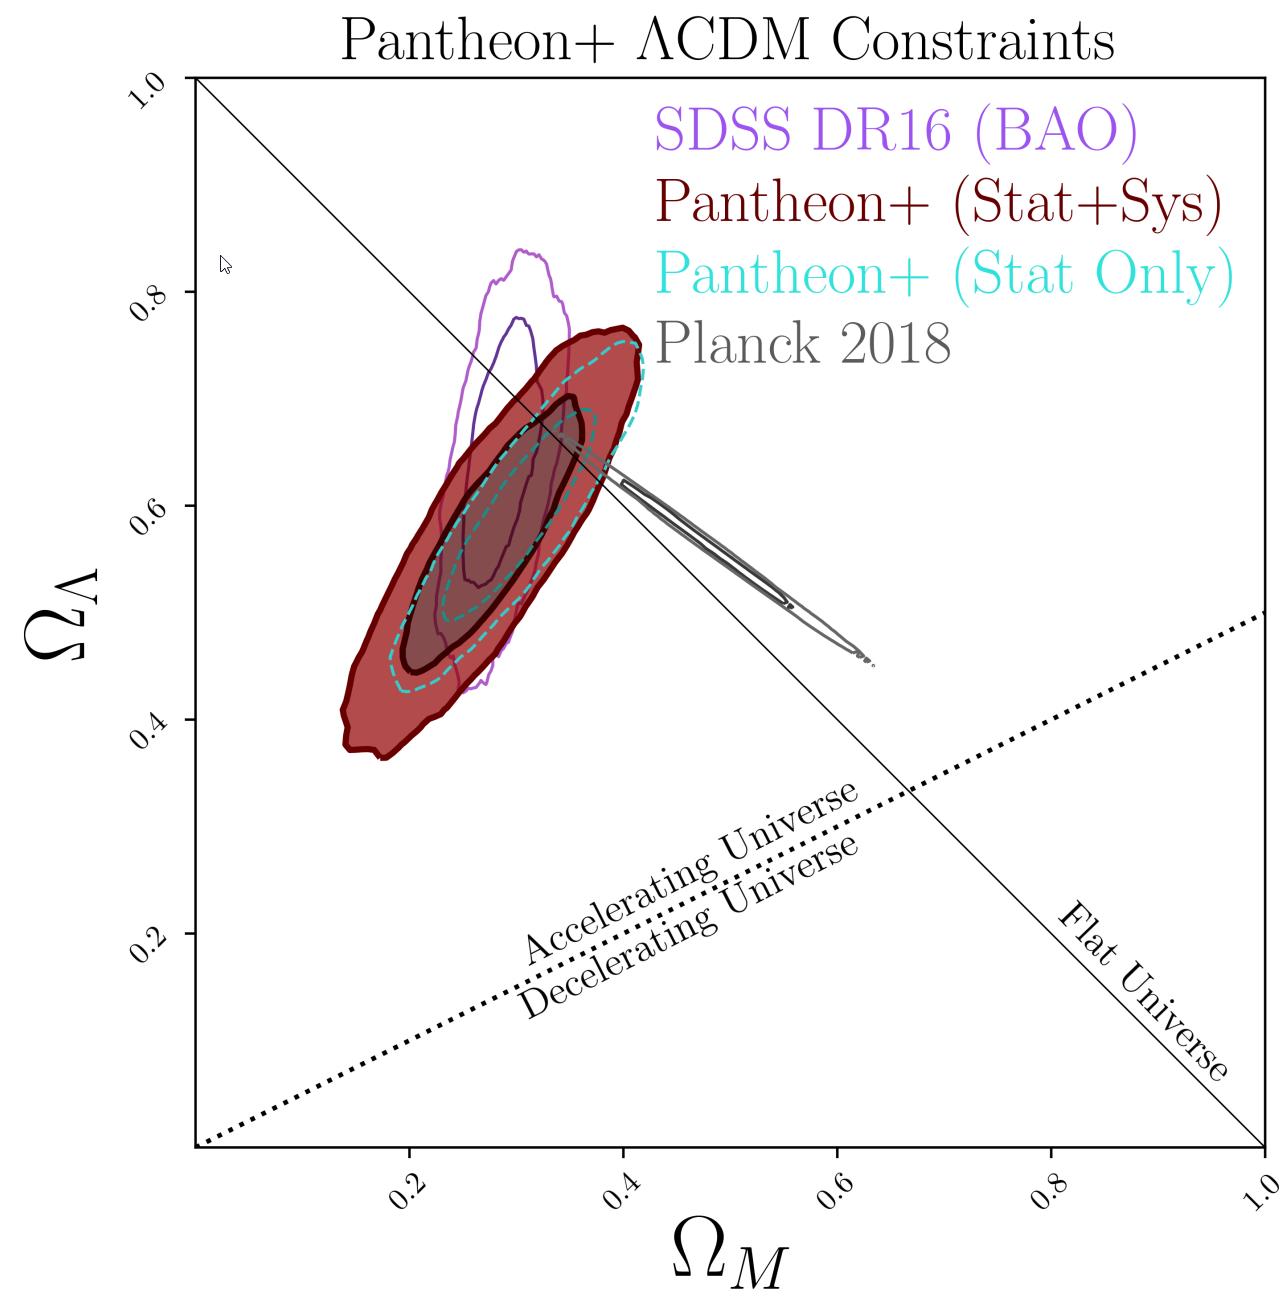
Looking at the above supernovae data from Pantheon+ alone gives us the colored, shaded contours. However, if we also fold in the information we can gain by examining the large-scale structure of the Universe (labeled BAO, above) and the leftover radiation from the Big Bang (labeled Planck, above), we can see that there’s only a very narrow range of values where all three data sets overlap. When we put them together, we find that the Universe is made of about:
- 66.2% dark energy,
- 33.8% matter, both normal and dark combined,
- and a negligibly small amount of everything else,
with each component, total, having a ±1.8% total uncertainty attached to it. It leads us to the most accurate determination of “What’s in our Universe?” of all-time.
(Credit: D. Brout et al./Pantheon+, ApJ submitted, 2022)
How fast is the Universe expanding?
Did I say that finding out what makes up the Universe was where the fun began? Well, if that was fun to you, then prepare yourself, because this next stage is completely bananas. If you know what makes up your Universe, then all you should need to do if you want to know how fast the Universe is expanding is to read the slope of the line relating “distance” to “redshift” from your data set.
And that’s where the problem truly comes in.
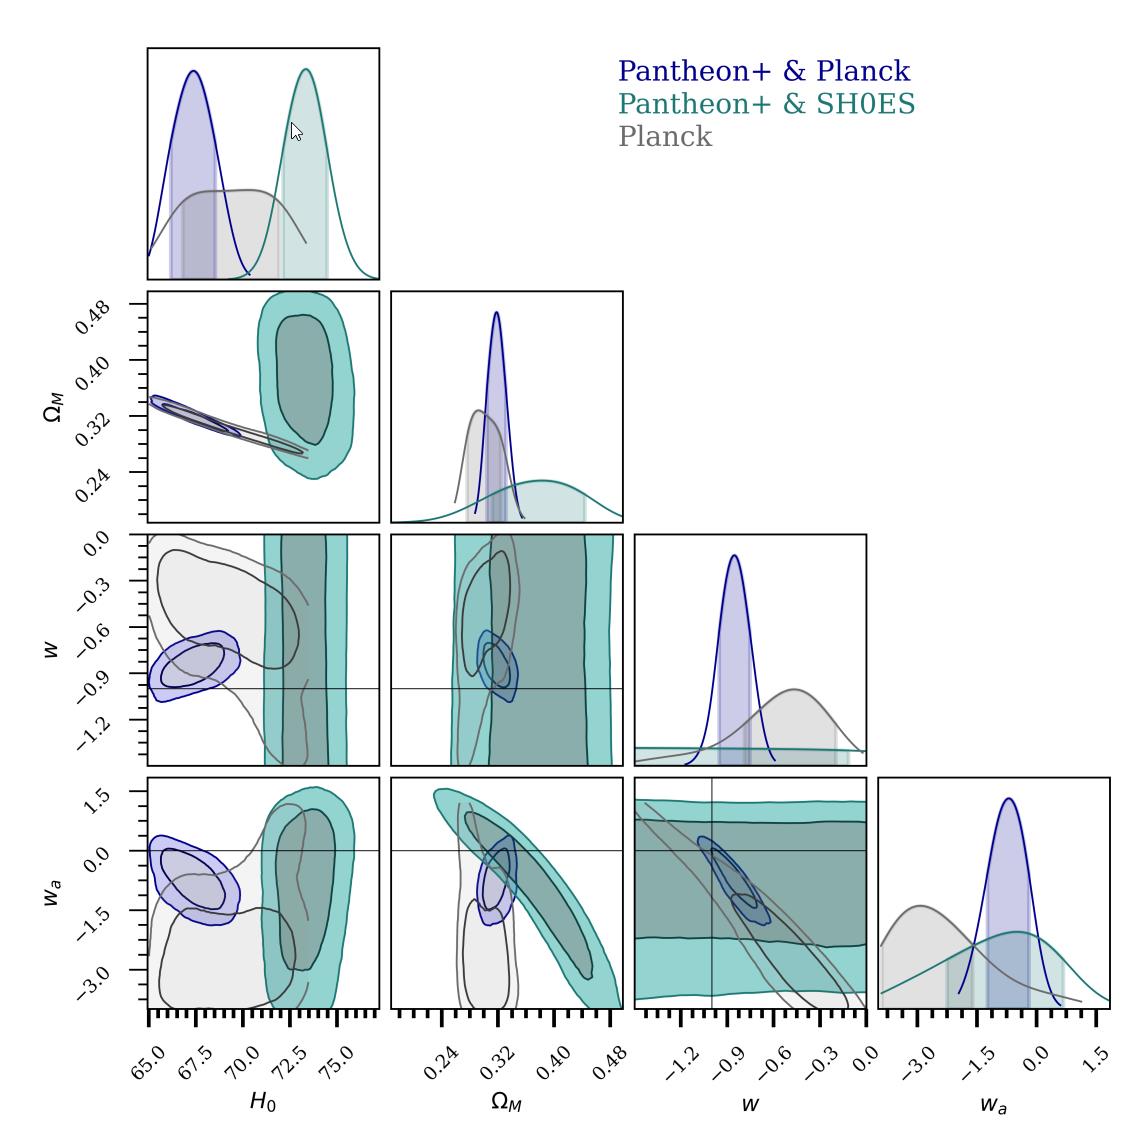
- If you only go off of the supernova data, which is labeled here as “Pantheon+ & SH0ES,” you can see that you get a very narrow range of allowable values, peaked at 73 km/s/Mpc, with a very small uncertainty of approximately ±1 km/s/Mpc.
- But if you instead fold in the leftover glow from the Big Bang, i.e., the Cosmic Microwave Background data from Planck, you get the contours labeled “Pantheon+ & Planck,” which is peaked at about 67 km/s/Mpc, with again a small uncertainty of around ±1 km/s/Mpc.
Notice how there is an incredible mutual consistency between all data sets for all of the graphs above that aren’t in the first column of entries. But for the first column, we have two different sets of information that are all self-consistent, but are inconsistent with one another.
Although there’s a lot of research currently being done on the nature of this conundrum, with one potential solution looking particularly appealing, this research robustly shows the validity of this discrepancy, and the incredibly high significance at which these two data sets disagree with one another.
Could the discrepancy be due to some sort of measurement error?
No.
This is an awesome thing to be able to definitively say: no, this difference cannot just be chalked up to some error in how we measured these things.
- It cannot be due to an incorrect calibration of the nearby distances to the closest supernovae.
- It cannot be due to the heavy element ratios of the stars used to calibrate the distances to nearby host galaxies.
- It cannot be due to changes in the absolute scale of supernovae.
- It cannot be due to uncertainties in the period-luminosity relationship for Cepheids.
- Or from the color of Cepheids.
- Or due to the evolution of exploding white dwarfs.
- Or due to the evolution of the environments in which these supernovae are found.
- Or to systematic errors in measurements.
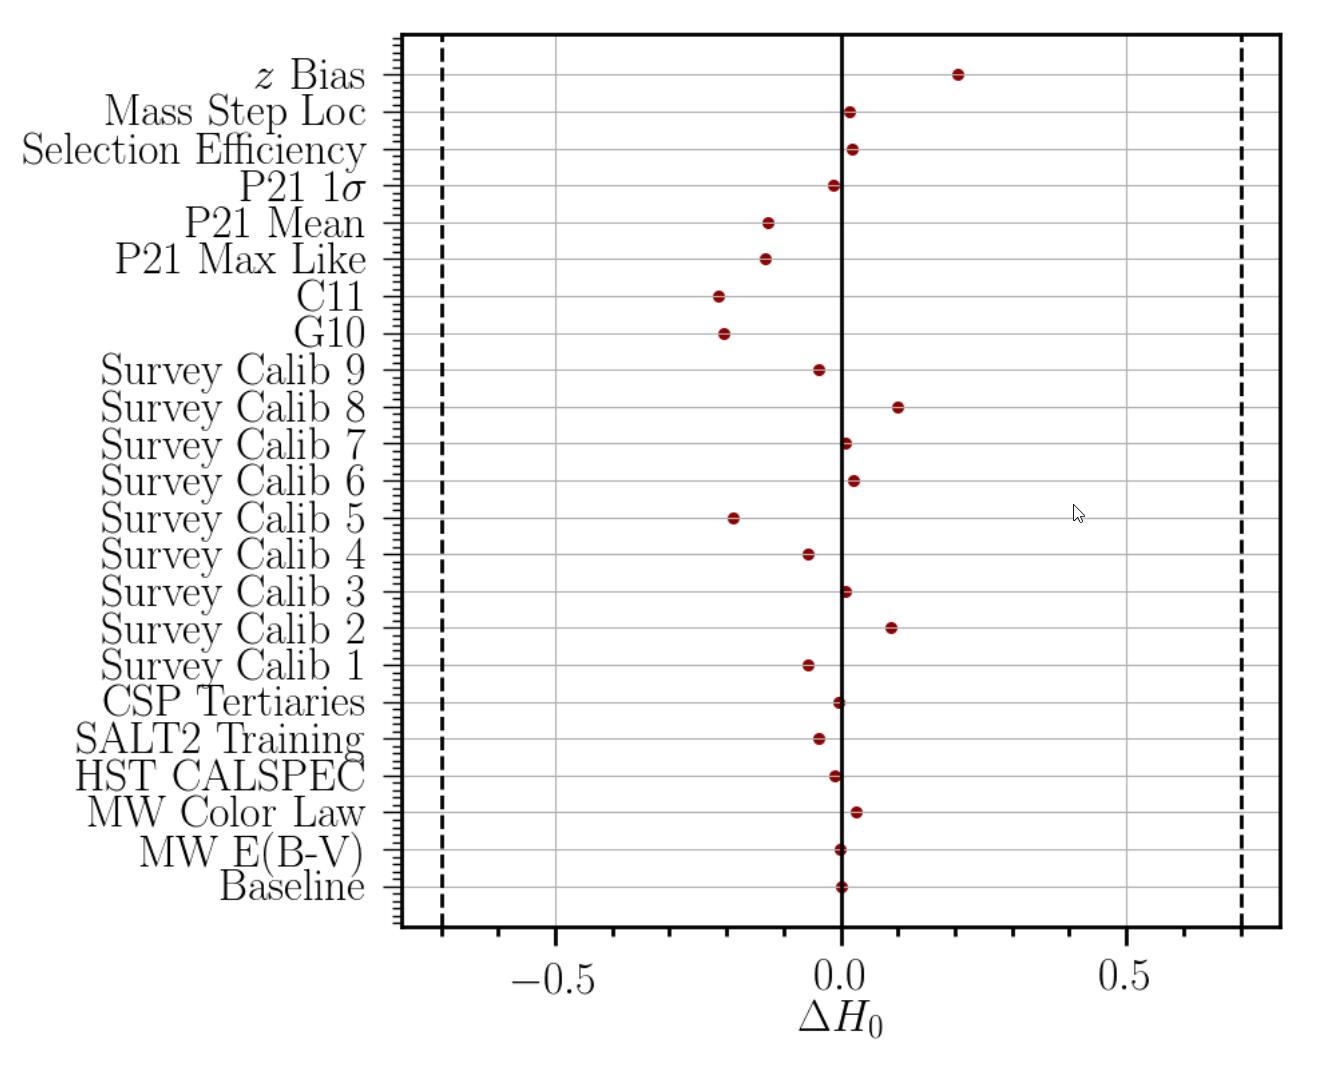
In fact, it’s arguable that the most impressive of all the “heavy lifting” done by the Pantheon+ team is the remarkably tiny errors and uncertainties that exist when you look at the data. The above graph shows that you can change the value of the Hubble constant today, H0, by no more than about 0.1 to 0.2 km/s/Mpc for any particular source of error. Meanwhile, the discrepancy between the rival methods of measuring the expanding Universe is somewhere around ~6.0 km/s/Mpc, which is astoundingly large by comparison.
In other words: no. This discrepancy is real, and not some yet-unidentified error, and we can say that with extreme confidence. Something weird is going on, and it’s up to us to figure out what.
Credit: D. Brout et al./Pantheon+, ApJ submitted, 2022
What is the nature of dark energy?
This is another thing that comes along with measuring the light from objects throughout the Universe: at different distances and with different redshifts. You have to remember that whenever a distant cosmic object emits light, that light has to travel all the way through the Universe — while the fabric of space itself expands — from the source to the observer. The farther away you look, the longer the light had to travel, which means that more of the history of the Universe’s expansion gets encoded in the light you observe.
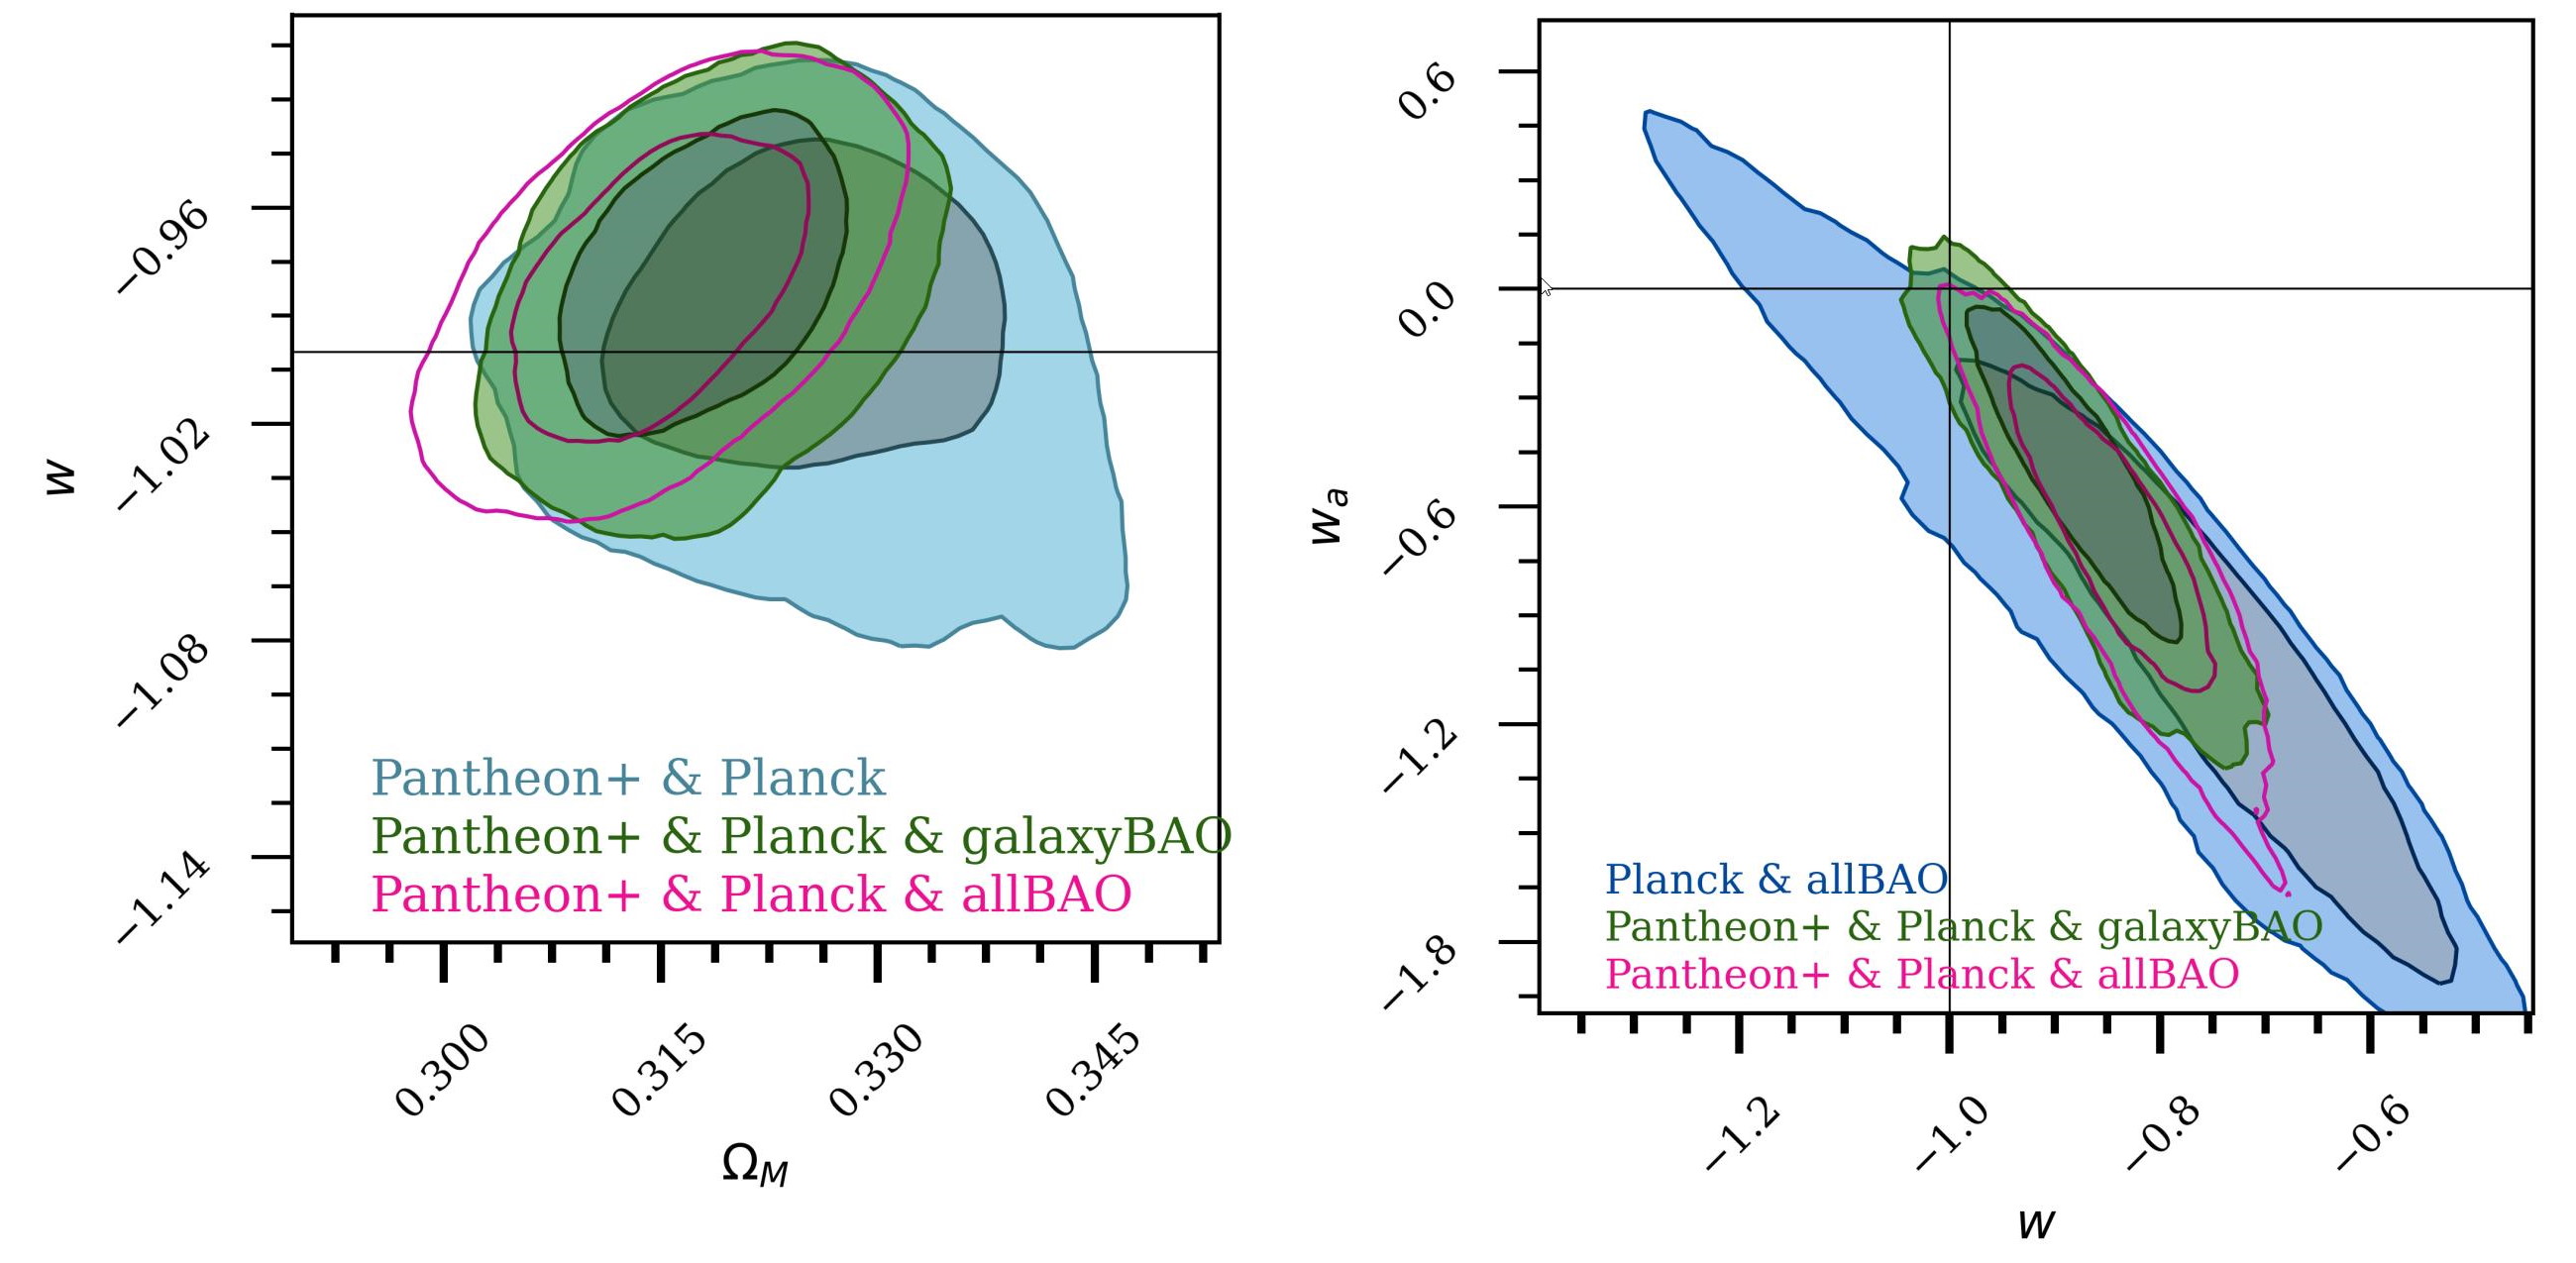
There are two assumptions that we can choose to make about dark energy:
- either it has the same properties everywhere, at all times and at all locations,
- or we can allow those properties to vary, including by changing the strength of dark energy.
In the two graphs above, the left one shows what we learn if we assume the first option, while the right one shows what we learn if we assume the second. As you can plainly see, even though the uncertainties are quite large on the right (and less so on the left), everything is perfectly consistent with the most boring explanation for dark energy: that it’s simply a cosmological constant everywhere and at all times. (That is, w = -1.0, exactly, and that wa, appearing in the second graph only, exactly equals 0.)
Dark energy is boring, and nothing in this, the most comprehensive supernova data of all, indicates otherwise.

Credit: NASA & ESA
What about the alternatives?
There have been many “alternative interpretations” of the data put forth by a variety of scientists as challenges to the mainstream interpretation.
Some have asserted that perhaps there’s a significant amount of curvature to the Universe, but that requires a lower Hubble constant than Pantheon+ permits, so that is thoroughly ruled out.
Others have asserted that the Hubble tension is simply an artifact of poorly calibrated data, but the robust analysis presented here by Pantheon+ thoroughly shows that to be false.
Still others have hypothesized that dark matter itself has a force that’s proportional to some power of the matter’s velocity, and would change over time, eliminating the need for dark energy. But the extensive range of the Pantheon+ data set, pushing us back to when the Universe was less than a quarter of its current age, rules that out.
The fact is that all of the potential “dark energy doesn’t exist” explanations, like maybe type Ia supernovae evolve significantly or that the type Ia supernova analysis just isn’t significant enough, are now even further disfavored. In science, when the data is both decisive and definitively against you, it’s time to move on.

Credit: NASA, ESA, A. Feild (STScI), and A. Riess (JHU)
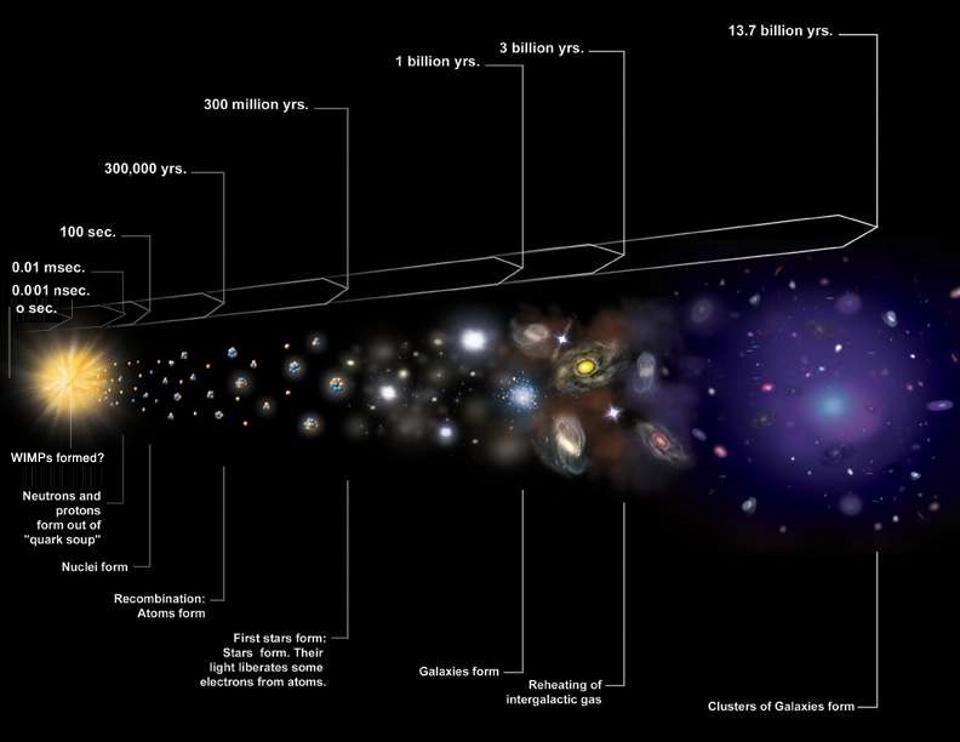
And this brings us to the present day. When the discovery of the accelerated expansion of the Universe was announced in 1998, it was based on only a few dozen type Ia supernovae. In 2001, when the final results of the Hubble Space Telescope’s key project were announced, cosmologists were ecstatic to have determined the rate at which the Universe expanded to within a mere ~10%. And in 2003, when the first results from WMAP — the predecessor mission to Planck — came in, it was revolutionary to measure the various components of energy in the Universe to such incredible precision.
Although substantial advances have been made in many aspects of cosmology since then, the explosion of high-quality, high-redshift supernova data should not have its importance downplayed. With a whopping 1550 independent type Ia supernovae, the Pantheon+ analysis has given us a more comprehensive, confident picture of our Universe than ever before.
We are made of 33.8% matter and 66.2% dark energy. We are expanding at 73 km/s/Mpc. Dark energy is perfectly consistent with a cosmological constant, and the wiggle room is getting quite tight for any substantial departures. The only remaining errors and uncertainties in our understanding of type Ia supernovae are now minuscule. And yet, alarmingly, the data offers no solution to why different methods of measuring the expansion rate of the Universe yield discrepant results. We’ve unraveled many cosmic mysteries in our quest to understand the Universe so far. But the unsolved mysteries we have today, despite the remarkable new data, remain just as puzzling as ever.
