What do JWST’s “red monster” galaxies mean for cosmology?
- Since it first unveiled its views of the distant Universe, JWST has helped astronomers rewrite the cosmic story for how our Universe grew up.
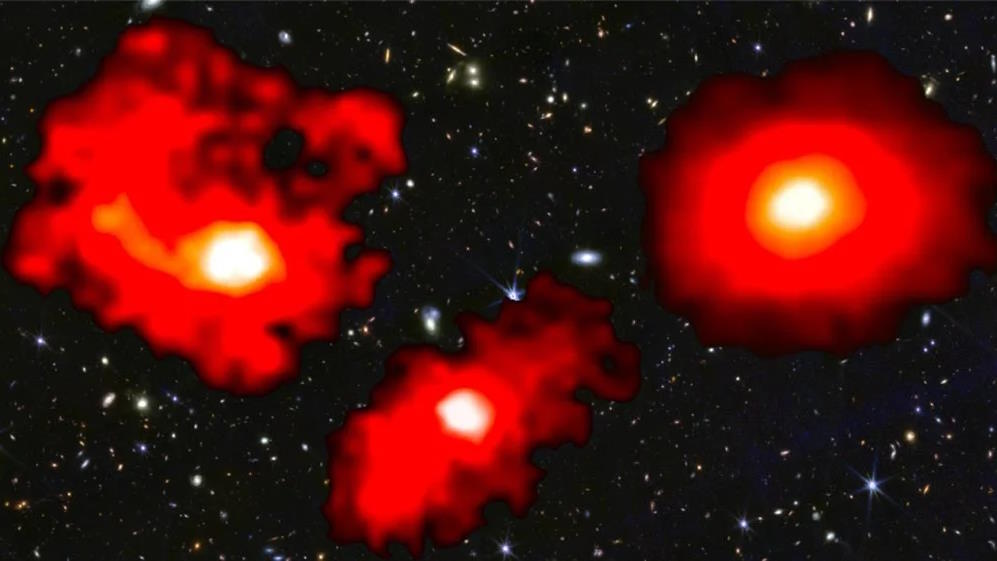
- A great abundance of early, bright, massive galaxies have now been revealed, with a new class of “red monster” galaxies just discovered, according to a new study.
- Do these challenge our standard cosmological model, or compel us to rethink how the Universe grew up? Not necessarily, but the leading explanation is far from satisfying.
Ever since JWST first opened its eyes on the deep, distant Universe, it’s showed us objects that we didn’t expect we’d find. Sure, we expected a whole host of cosmic record-breakers, including the “most distant” example of many different types of object. JWST has already shown us the most distant:
along with many more stupendous cosmic finds. One of the biggest surprises was the sheer number of ultra-distant galaxies, both bright and faint, found in the first ~1 billion years of cosmic history: the so-called little red dots. If the Universe grew up the way we thought, how could there be so many of these galaxies at such early stages of cosmic history?
The eventual explanation was four-fold: JWST was cleaner and more precise than expected, resulting in better overall performance. We also needed to invoke higher-resolution simulations to better predict these rare cosmic overdensities. Star-formation turns out not to be continuous, but “bursty,” indicating that sometimes these galaxies are only temporarily bright. And many of them are brightness-enhanced by active black holes. Combined, these four factors brought these “little red dots” back in line with expectations.
But now there’s a new puzzle: three red monster galaxies from when the Universe was just 1 billion years old. Here’s what JWST found, and how astronomers and cosmologists are working to explain what these observations mean.
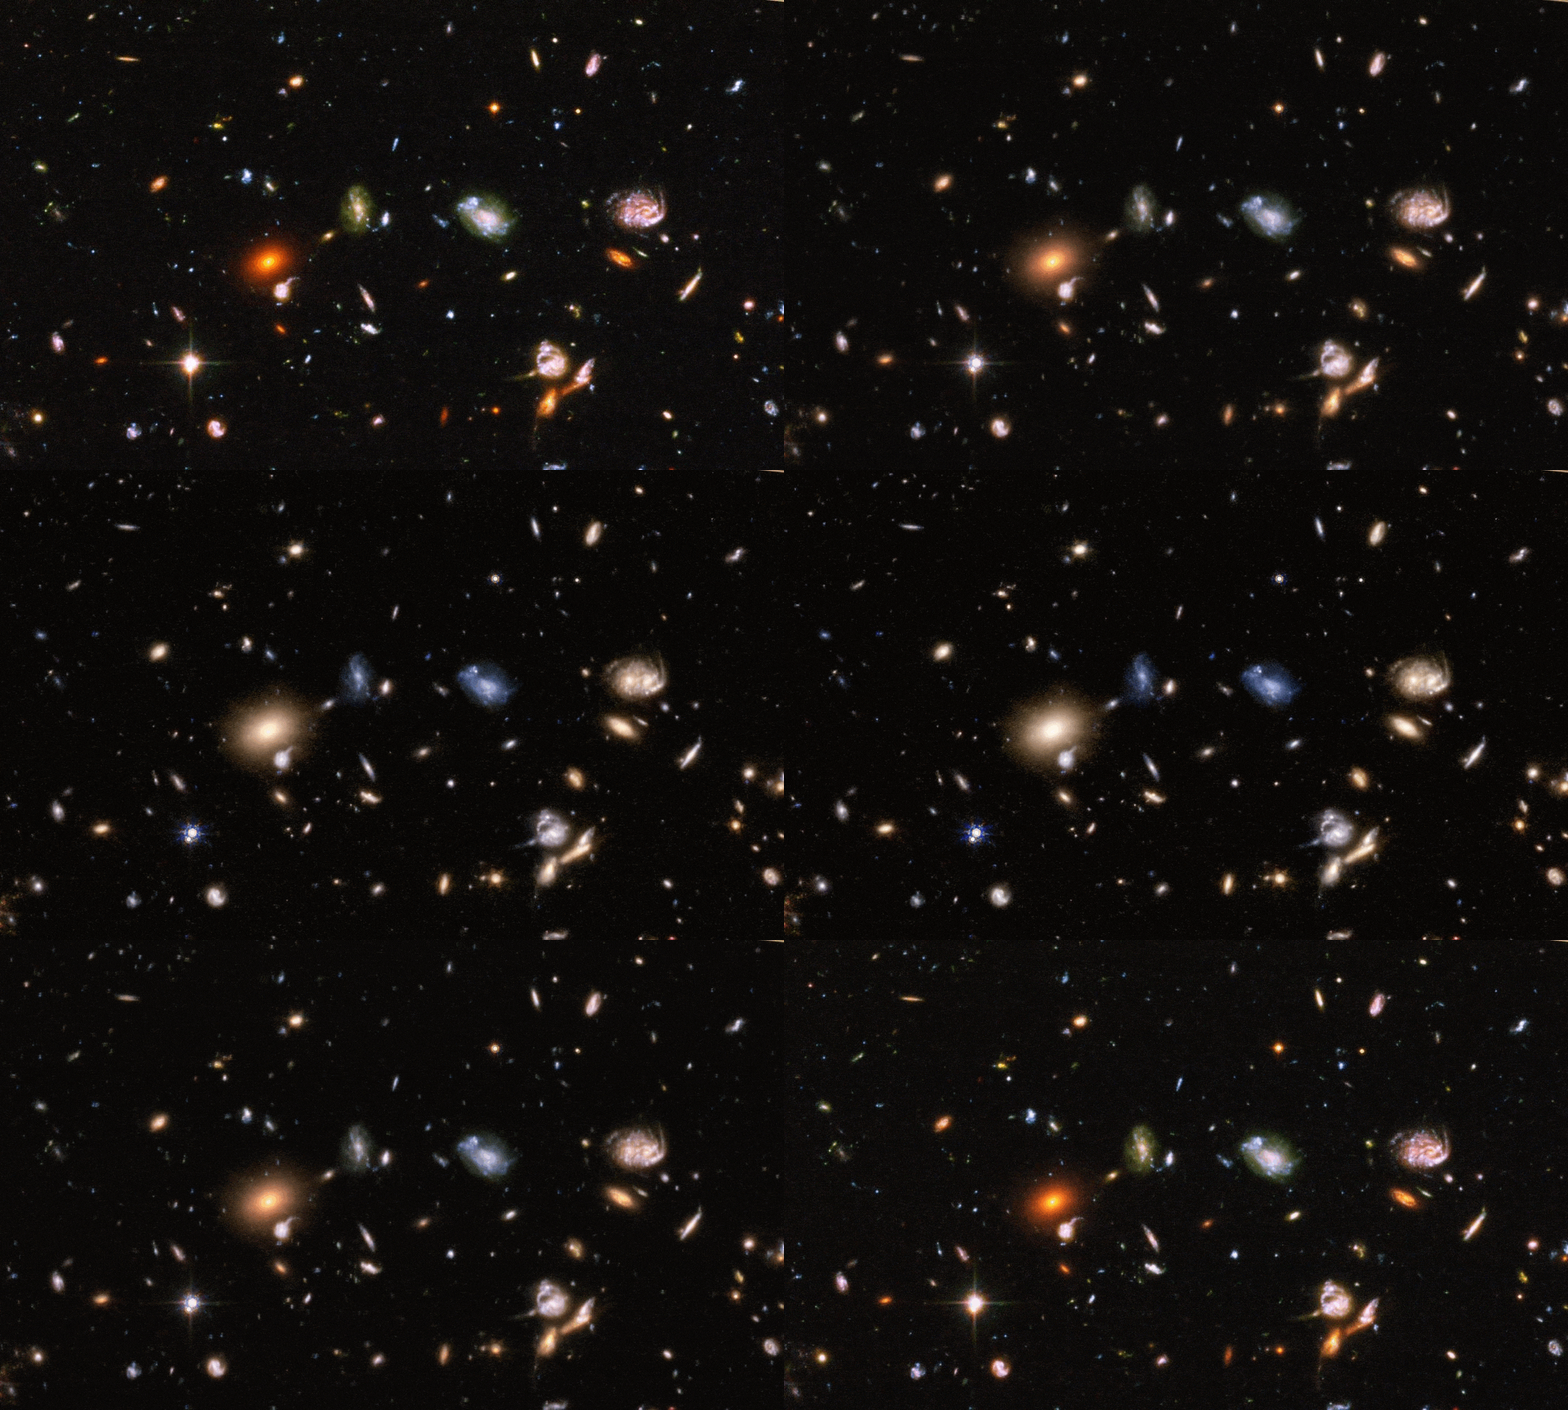
For a long time now, JWST has been finding large numbers of objects that appear to be:
- bright,
- massive,
- ultra-distant,
- and extremely red in color,
which is precisely what it was designed and built to find. However, scientists only expected to find a certain number of these objects dependent on how far back we looked, and that those objects would have specific populations and masses of stars inside of them. If the galaxies we see are brighter, more massive, or have different populations of stars than our models predict, we’ve got a puzzle on our hands: one that demands we try to solve it.
Of course, we first have to make certain that what we’re seeing is actually reliable; there are a number of ways that, from photometric data alone (i.e., data that collects light that falls into a “bucket” spanning a specific wavelength range), apparently bright galaxies could be tricking us.
- Some of them aren’t actually objects located at great distances, but are rather intrinsically red objects with bright emission lines seen at much more modest distances.
- Some of them don’t have the amount of stars that its brightness would otherwise indicate, as they’re brightness-enhanced by either burst star-formation or active supermassive black holes.
- And some of them are very dusty galaxies, requiring an extraordinary amount of modeling and additional data to understand what the luminous objects inside are actually doing.
Fortunately, there’s a way to know which galaxies are which, and to find out their properties unambiguously. Instead of conducting photometry on these galaxies, where we acquire data about these objects in many different filters (or across many different “buckets” that collect light in a specific set of wavelength ranges), we can gather light spectroscopically. Whereas photometry gathers all the light across a wavelength range and groups it all together, spectroscopy takes the light from an object and splits it by breaking it up across its component wavelengths, allowing scientists to detect emission and absorption features that reveal an extraordinary set of details and properties of the object(s) in question.
We used to have to use a technique called “slit spectroscopy” in order to do this: where we would target pre-selected sources to try to tease out this additional information about them. However, there’s another type of spectroscopy that’s not only become popular in recent years, but that is part of the JWST suite of instruments: grism spectroscopy. When you have a grism, you basically get a sample of all objects in your field of view with emission line features, where those lines stand out clearly against the background of continuous sources that lack those lines. It’s a quick and efficient way to perform spectroscopy on a large number of objects within a specific field of view.
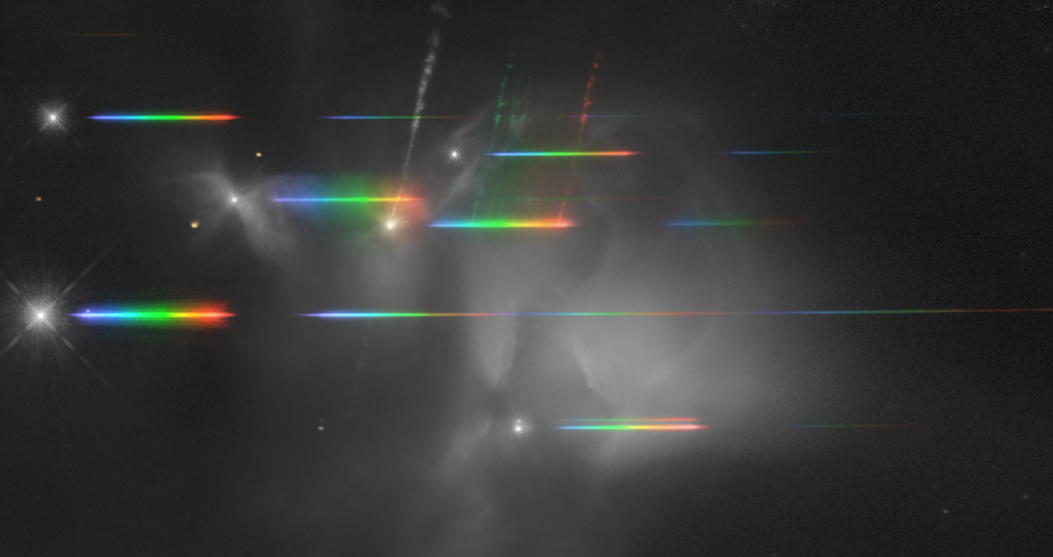
The key idea behind this recent study was to identify and study all of the galaxies that contain these bright emission lines within a specific survey area: the JWST FRESCO NIRCam/grism survey. There were a total of 36 relevant galaxies within this particular field-of-view, where the red color of these galaxies strongly suggested a large amount of dust attenuation within them. The researchers call these dusty star-forming galaxies (DSFGs), where they have almost no optical light within them at all, but instead, due to the dust, emit very strongly at infrared wavelengths. Specifically, they can find signatures of emission lines such as neutral hydrogen, singly ionized nitrogen, and doubly ionized oxygen within these galaxies, providing a wealth of information about them.
When we collect large buckets of data concerning the light that appears across a variety of different wavelengths, we’re not just seeing starlight. We’re seeing a combination of:
- starlight,
- light emitted from the supermassive black hole within the galaxy,
- and light emitted by these excited atoms and ions in the form of emission lines,
where the photometric data simply adds all the light from within these “buckets” together and reports them cumulatively. Spectroscopy enables us to separate out the emission line contributions, giving us a better estimate of the stellar masses — or the mass in the form of stars — of each of the individual galaxies that are members of this sample; something wholly impossible with photometry alone.
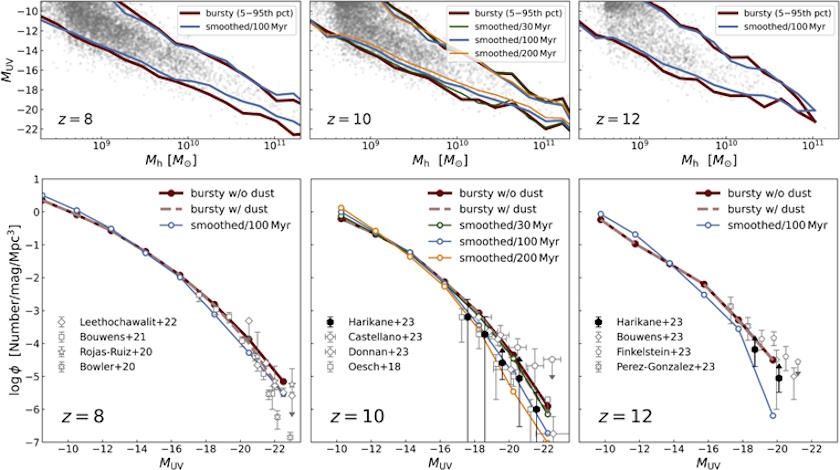
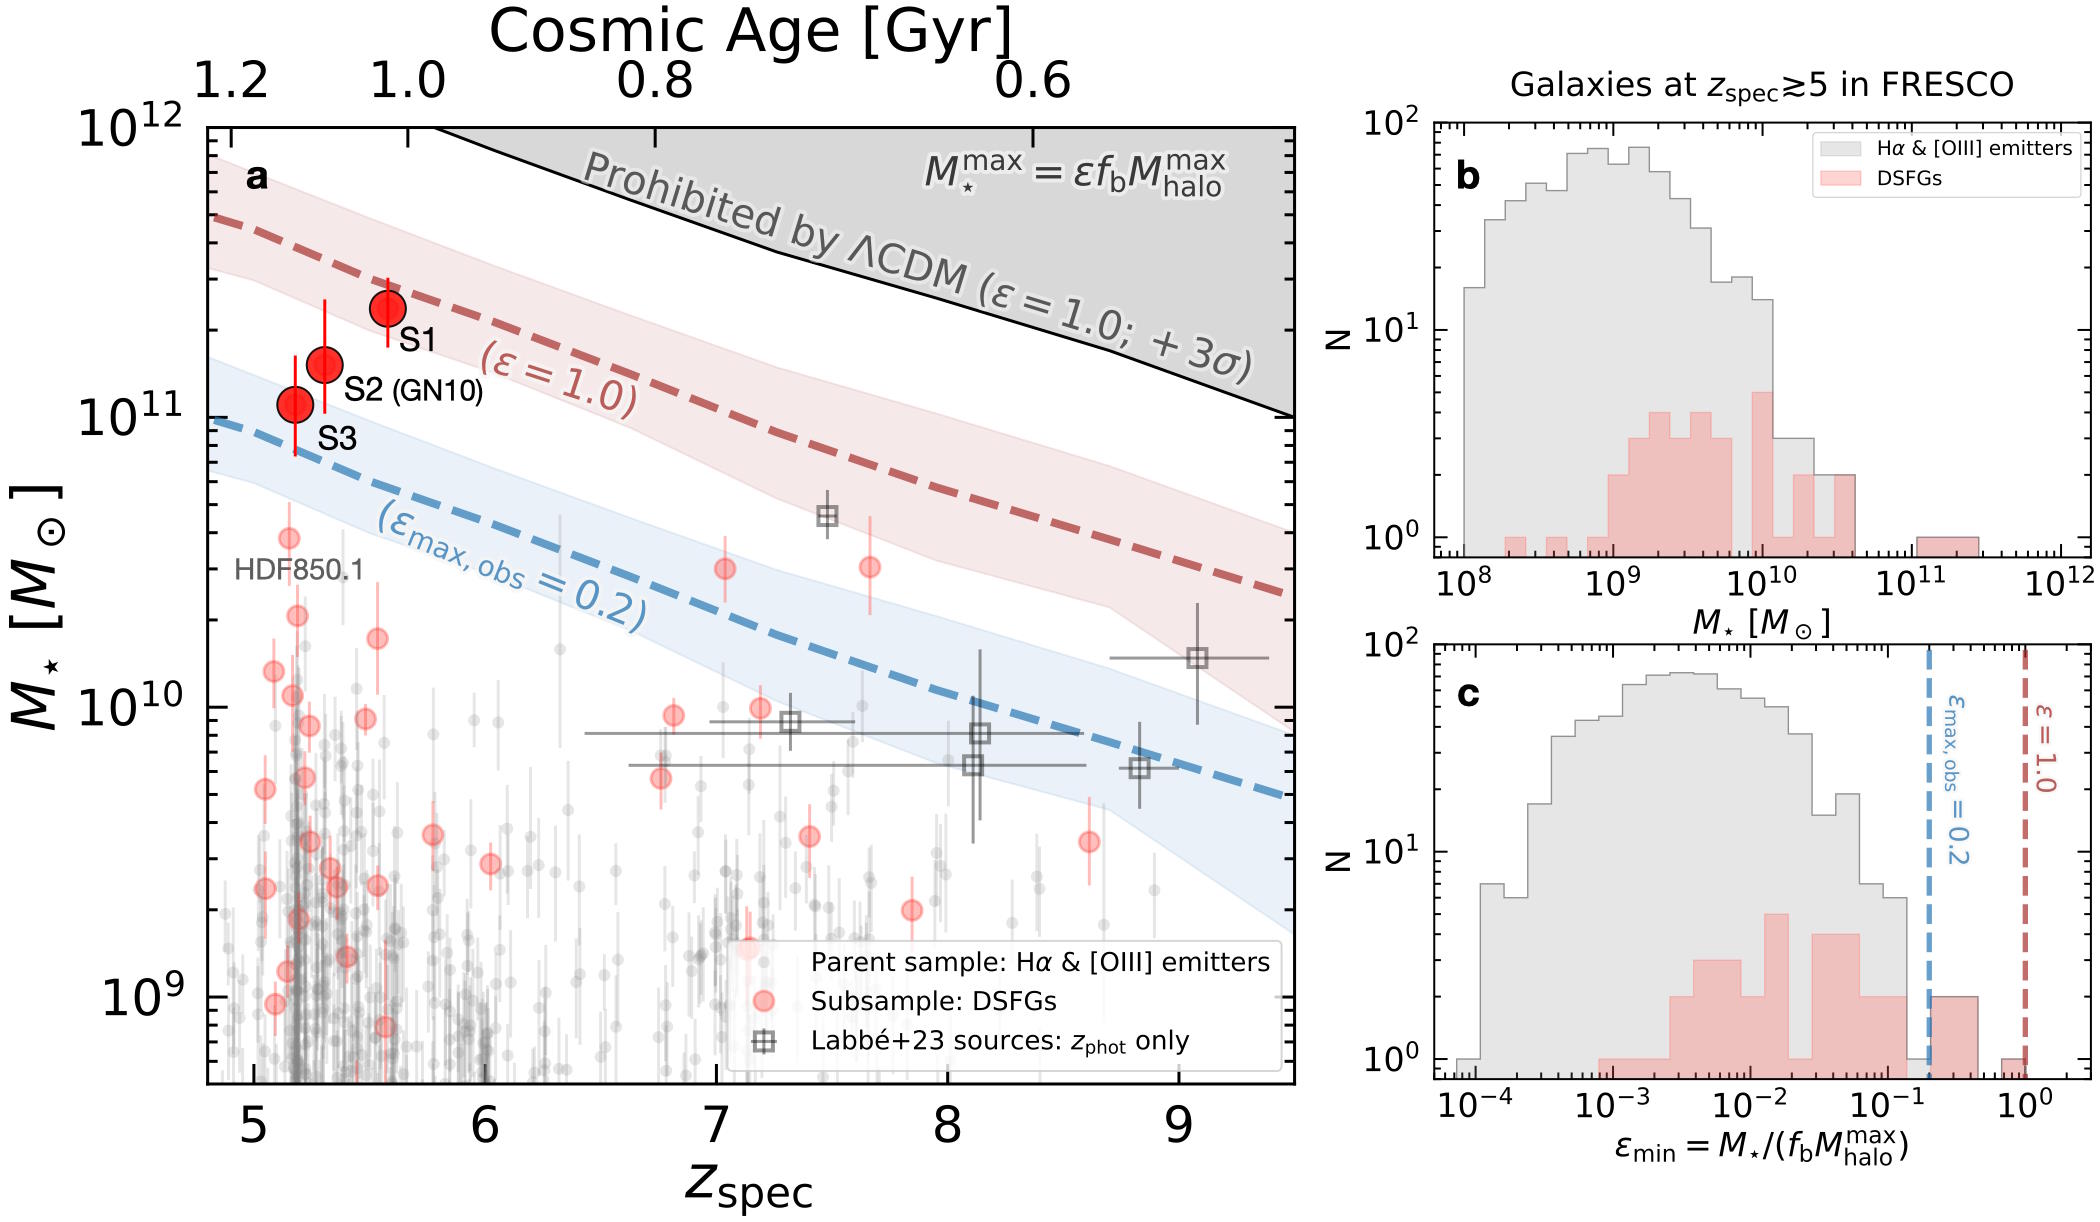
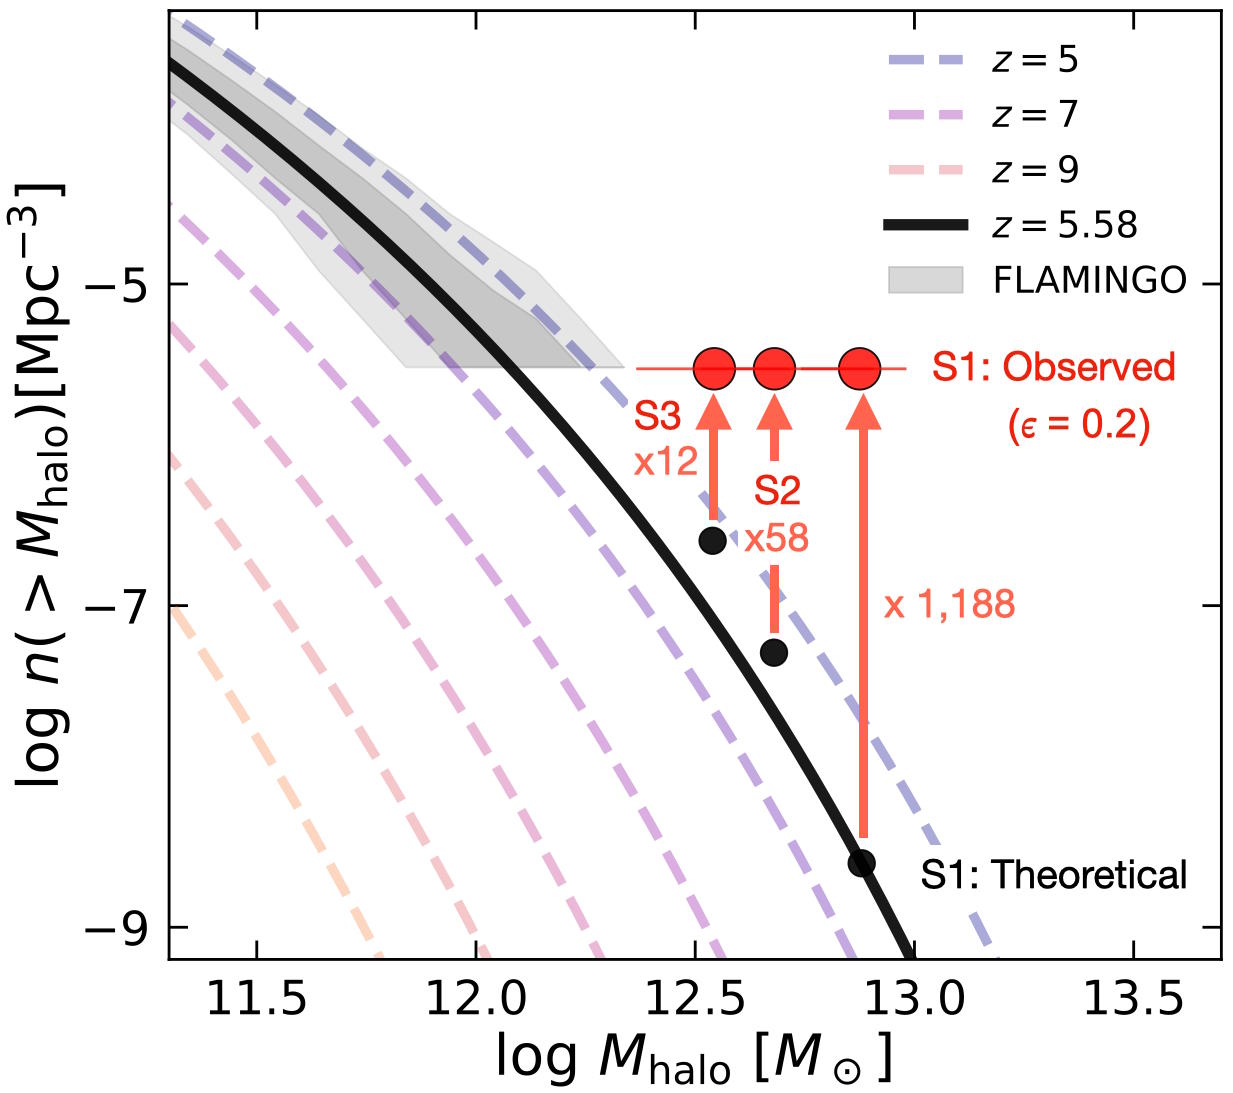
Most of these galaxies are well within the range of parameters they’re expected to have. Based on how large and massive the dark matter halos that house these galaxies are expected to be from simulations, the authors then note that only about 1/6th of the total mass of the Universe is in the form of normal matter (as opposed to dark matter) and that normal matter only can form stars, with some efficiency: where 100% efficiency would mean that all of the normal matter has gone into the formation of stars within the galaxy in question. Realistically, from models that take observations into account, we fully expect that actual galaxies should only exhibit ~20% efficiency, at maximum.
The most important result from this study is that none of the galaxies they measure achieve or even approach a 100% efficiency. In other words, none of these galaxies — not even the most massive ones with the greatest abundances of stars inside of them — threaten to “break the Universe” in some way; everything that we see matches up consistently with what we fully expect should be allowed to exist in the cosmos. In fact, of all of the galaxies for which emission lines were collected, only five of them stand out as remarkable, and only three of them (the three that appear at late times, and hence, have more robust determinations of their stellar masses) are highlighted as unexpectedly highly efficient in terms of star-formation.
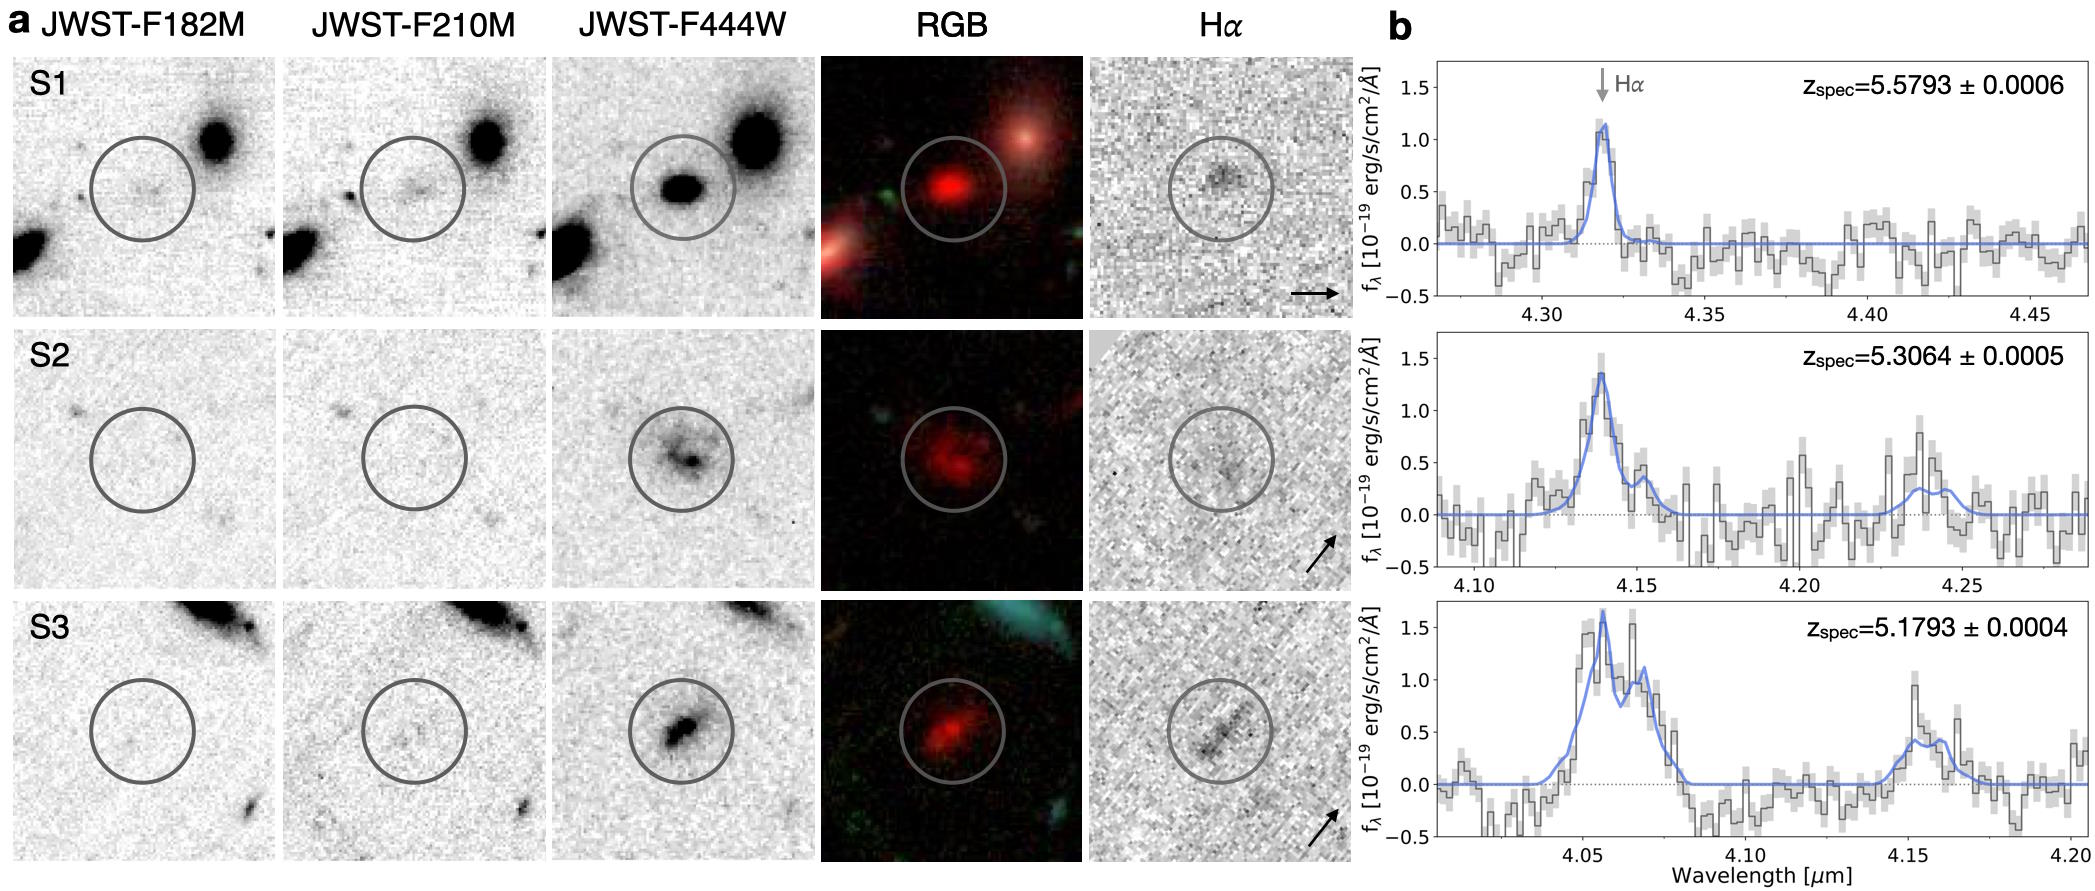
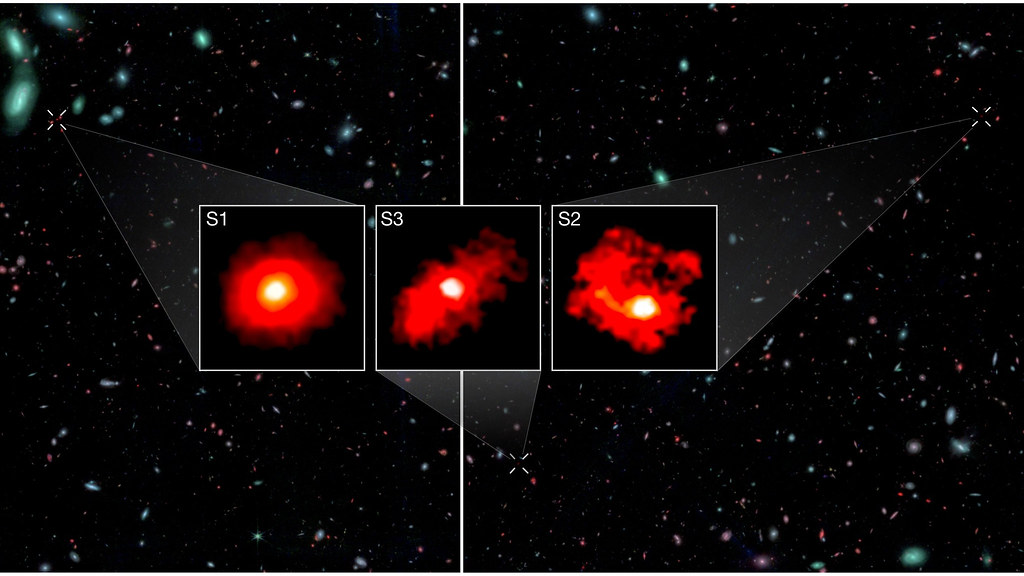
These three galaxies are named S1, S2, and S3, and they represent a new class of objects that have arrived with the publication of this new study: red monsters. These galaxies:
- come from the early Universe, where the Universe was only about ~1 billion years old at the time these galaxies emit their light,
- are all extremely massive, with at least 100 billion solar masses worth of stars inside of them,
- extremely red in color, as they’re over 3.5 magnitudes brighter in the longest NIRCam wavelength ranges as opposed to the shortest ones,
- and extremely rich in dust.
Their star-formation rates are also enormous, and must be modeled as being heavily dust-obscured. When the authors do this modeling, they find that S1 forms about 800 solar masses worth of new stars each year, while S2 and S3 each form around 1000 solar masses worth of new stars per year. Compared to the Milky Way, which forms about ~1 solar mass worth of new stars per year, these galaxies must be forming stars extremely efficiently to account for these enormous measured rates. Furthermore, these galaxies exhibit no signs of having an active galactic nucleus at their centers, indicating that the mass estimates for these three red monsters are likely reliable and not brightness-enhanced by an active supermassive black hole.
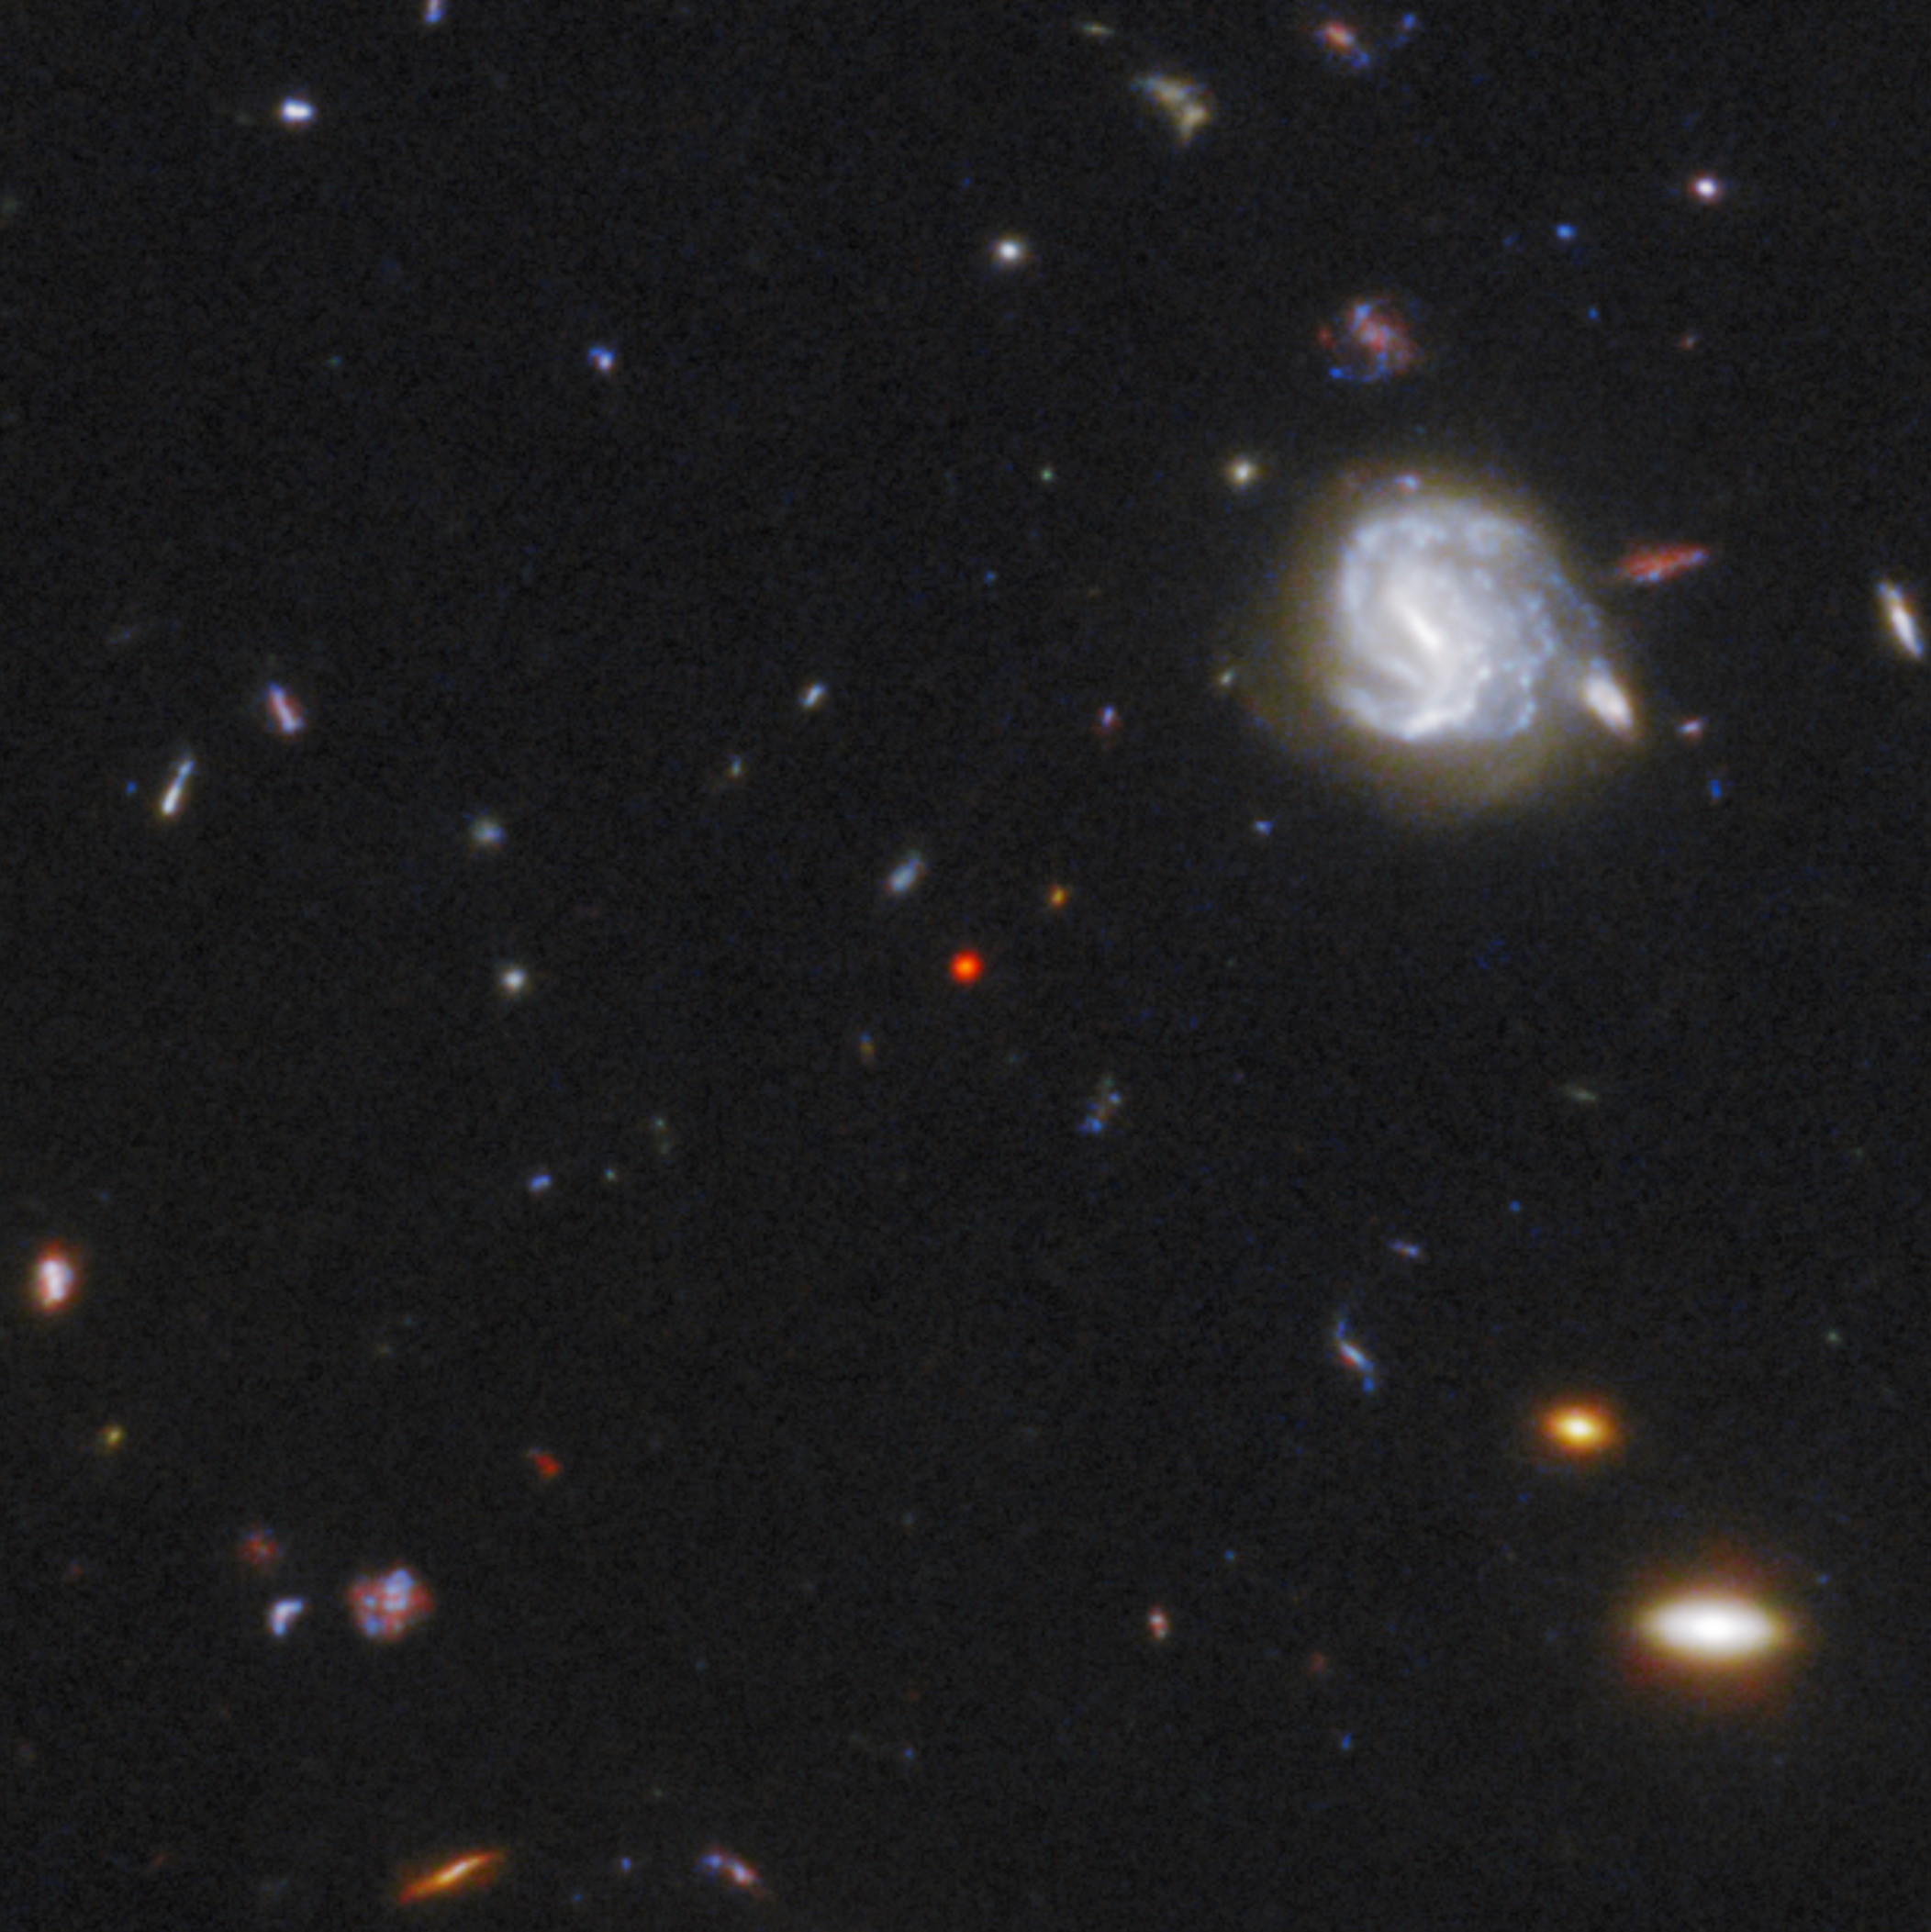
So what makes these “red monster” galaxies so monstrous?
The fact that they have too many stars, based on the analyses conducted, for how massive they can be at this early stage of cosmic history. There are a number of processes that occur inside galaxies as they evolve, with a very big one coming from what astronomers call “feedback.” Basically, when you form stars, those new stars include hot, massive, blue, short-lived stars: stars that violently emit enormous amounts of ultraviolet radiation and blow off charged particles in energetic winds. This radiation and these winds “push back” on any neutral matter attempting to gravitationally collapse and form new stars, preventing all or even most of the gas from forming stars at any time, including all-at-once in bursts or gradually, over long periods of time.
In other words, there are rate-limiting steps in how quickly stars can form. Typically, we expect that even the most efficient galaxies can convert no more than about 20% of their gas into stars. Dark matter forms the massive halos that hold matter inside of them, normal matter collapses to form stars, those new stars “push back” on any additional matter that would collapse to form new stars in the aftermath of their formation, and hence there’s a maximum efficiency that galaxies should exhibit.
All of the galaxies within the FRESCO study show signs that they’re in line with those expected efficiencies, but not these three red monsters. Instead of a maximum efficiency of around 20%, these three show efficiencies that range between 40-50%: twice or even approaching three times as efficient as lower-mass galaxies observed at the same cosmic epochs or as comparably-massed galaxies observed later on in cosmic history. The high dust content of these galaxies, which reddens their appearances significantly, combined with these incredibly high star-formation efficiencies inferred, justifies the name “red monsters” given to these objects.
The big question, of course, is why. Where are these abundant, massive, early galaxies coming from, and how did they get to be the way they are when we observe them? This is one of the wonderful things about astrophysics: no matter how good our theories are, and no matter how strong or robust the predictions of those theories are, even based on what our models and our simulations tell us ought to be out there, our present understanding of the Universe is never the final, complete story. Instead, we must look to the laboratory of the Universe itself to find out what’s out there, and then to compare it with what we predicted. In this case, as so often occurs, there are a few surprises out there that didn’t quite align with what we expected.
So what’s actually going on? Some of the authors of the study were eager to speculate. According to Stijn Wuyts,
“Finding three such massive beasts among the sample poses a tantalizing puzzle… In more ways than one, [JWST] has shown us that some galaxies mature rapidly during the first chapters of cosmic history.”
Lead author Mengyuan Xiao went even further, stating that,
“These results indicate that galaxies in the early Universe could form stars with unexpected efficiency. As we study these galaxies in more depth, they will offer new insights into the conditions that shaped the Universe’s earliest epochs. The Red Monsters are just the beginning of a new era in our exploration of the early Universe.”
But it’s also possible that there are other factors at play, and that we don’t understand these “red monsters” well enough to make such strong statements about how these galaxies formed and grew up. For one, the FLAMINGO simulations that these predictions rely on are not necessarily the highest-resolution simulations, and may be overlooking certain properties of the most extreme, greatest-overdensity regions. For another, these red monsters may be exhibiting a burst of star-formation right now, explaining their (artificially enhanced) brightness. Even in the absence of an active supermassive black hole, there are astrophysical reasons to question just how massive and/or how efficient these galaxies truly are.
However, it’s also possible that everything the authors have done is correct, and that the data simply says what the authors interpret the data to mean. If so, these three ultra-massive galaxies could be the tip of the cosmic iceberg as far as a class of monstrous galaxies is concerned. It’s possible that our understanding of how efficiently gas can be converted into stars doesn’t apply to the earliest times in the Universe, and that instead of ~20% efficiency as the maximum (which appears true at late times), there could have been up to ~50% efficiency over the first ~1 billion years of cosmic history.
If we take these results at face value, it would imply that these red monster galaxies are not only ultra-massive and real, but that they’re responsible for about one out of every six new stars that form in the ~1 billion year old Universe. Astronomy is a science where, no matter how surprising or unexpected an observation is, we can’t simply discount it or throw it out as an exception or outlier. The Universe is as it is, and even our best theoretical understanding of what’s out there can’t change the raw observations. With robust distances and well-measured emission lines for these newly discovered red monsters, we must confront this new puzzle and reckon with its implications for how the Universe grew up. With additional JWST and ALMA observations coming — concerning these specific red monsters and also searching for additional examples of them — we may yet gain a better understanding of just how our Universe grew up.
