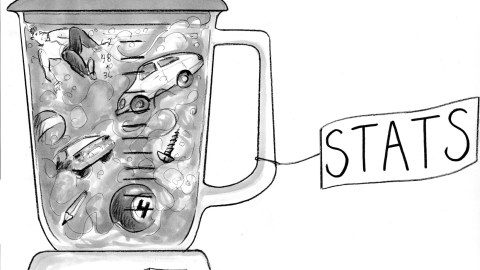
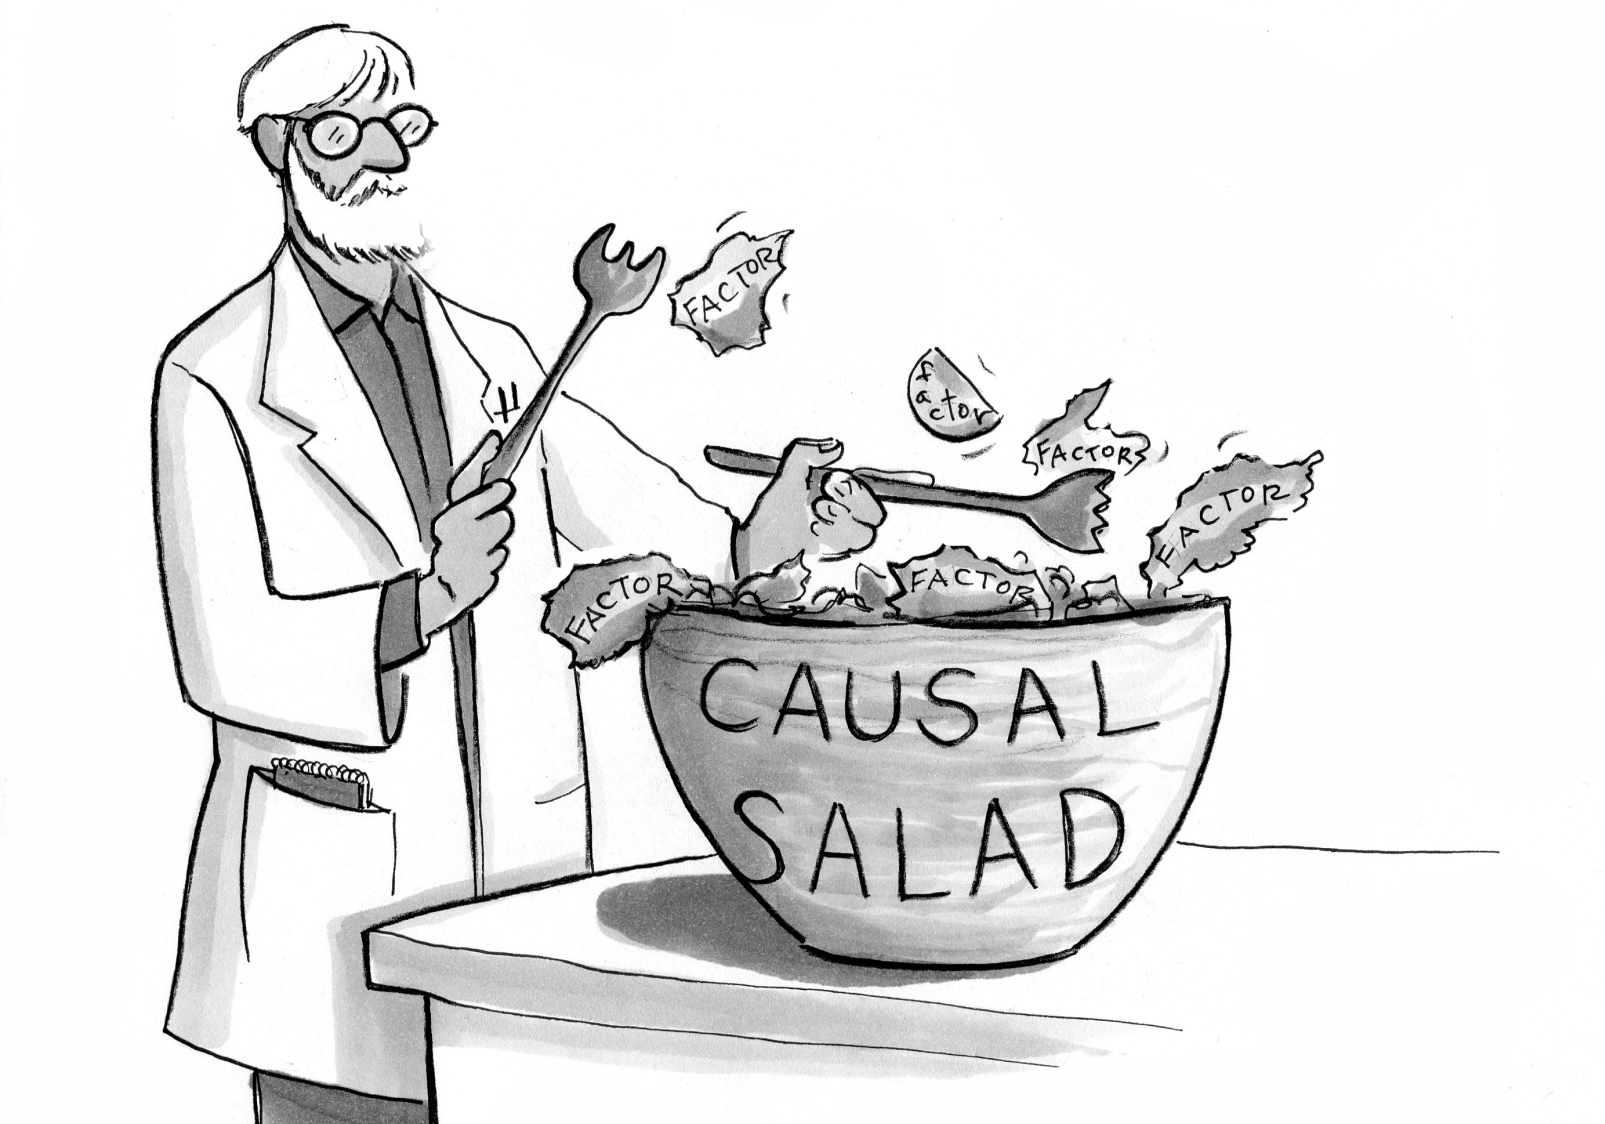
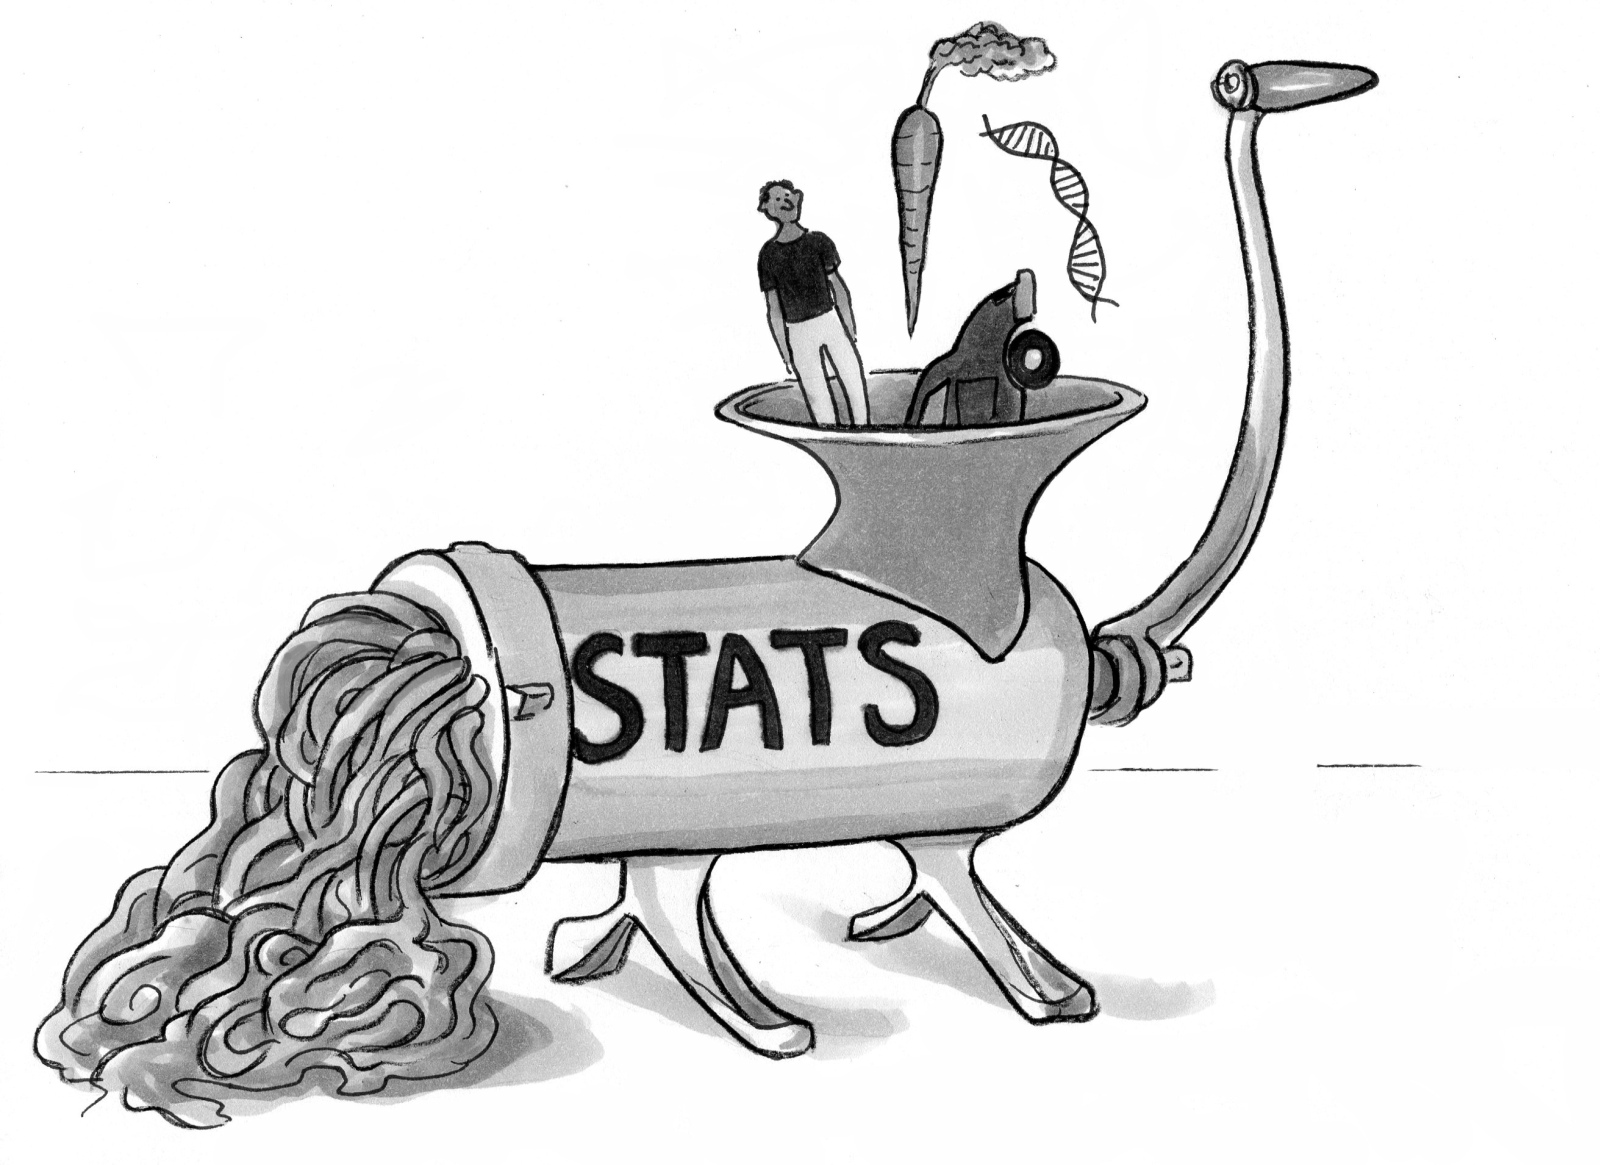
What Is the Cause of Soup? Stats Blender Errors.

Soup-to-nuts woes can vex “the stats.” Questions about soup show how nuts the situation has gotten.
1. Researchers and journalists are causing a fog of low-quality quantification by reporting data that’s often “somewhere between meaningless and quite damaging,” says Richard Nisbett.
2. Even “the very smartest” researchers do “silly” studies, like linking expensive weddings to enduring marriages.
3. Fewer deaths per million drivers for Volvos vs. Ford F-150s means “virtually nothing” — their driver-behaviour patterns vary greatly. (+see police shooting data misfire.)
4. Journalists should warn up front that readers are “quite likely to get non-information or misinformation.” Better yet, editors shouldn’t waste reader time.
5. Nesbit blames multiple regression, the standard way to calculate correlations, which is widely misused by “experts” (ditto “statistical significance”).
6. Statistical methods excel with independent factors and unmixed types. Fruitful quantification needs sound qualitative distinctions, or you’re blending apples & oranges (data—>embedded assumptions + metaphors).
7. On average, humans have one testicle + one ovary. Mixed types = iffy stats.
8. Beyond Nesbit’s concerns, what “cause of” means now seems unclear. Biology, the social sciences, and history all need richer concepts of causation than physics (+see Isaiah Berlin’s two kinds of “because”).
9. Reality resists Occam’s razor, empirically “nature often prefers complexity … in the biological & social sciences.” (e.g., Onions have more DNA than humans).
10. Does asking, “What is the cause of soup?” make sense? Or what percent is caused by each ingredient? Or what percent of the cause is its recipe? That’s what multiple regression analysis asks.
11. As with soup, so with cancer, or schizophrenia. They’re not homogenous, and don’t have simple causes. Each results from multi-ingredient, multistep processes (their logic can include … sufficient but not necessary, like many paths to a mountaintop).
12. Such process-dependent composite phenomena can resist quantitative analysis. Again, what percent of the cause of soup is its recipe? It’s inseparable. Meaningless to quantify.
13. Journalists describing a genetic variant that’s “hardly enough to cause schizophrenia; far too many other factors…” cause confusion by also referring to “the cause of schizophrenia” ( ≠ singular cause).
14. Randomized clinical trials are multiple-regression monsters. Their spread beyond medicine risks metaphor errors — e.g., using smartphones is like taking pills. Always consider response types. Is the situation like physics or physiology or history? Billiard balls and kidneys respond consistently. People less so.
15. Aristotle described four kinds of cause: material, formal, proximate, and final. For a table = wood, design, carpenter, and wanting a workspace. Updating Aristotle … causation can need a recipe.
16. The recipes evolutionary biologists use distinguish proximate from final causation. Even physicists are recasting cause as “algomorphic” (algorithms = recipes).
17. Beyond knowing that correlation ≠ causation, always consider the complexity of “causes.” Not all quantification = useful. Putting all data through the stats blender can be nuts.
Illustration by Julia Suits, The New Yorker Cartoonist & author of The Extraordinary Catalog of Peculiar Inventions.


