Thanks to a growing body of research on the incomes of the richest, we now have a much better understanding of the long-run evolution of income inequality.
This area of research has developed methods for estimating income inequality based on income tax records, or summary tables released by tax authorities. This is often available over much longer time horizons than household surveys, the most common data source for inequality researchers. For many countries, tax data can provide us with a view of the evolution of inequality over the past 100 years or more. It can also provide a more accurate view of the incomes of the richest, which are often poorly captured in survey data, as discussed further in a note at the end of this article.
Following the first uses of this approach around 20 years ago, the coverage of countries and periods has grown extensively.1 More recently, this effort has been coordinated by researchers at the World Inequality Database, who draw together the efforts of many inequality researchers according to a standardized methodology.
Below we show World Inequality Database estimates of the share of income received by the richest 1%. These data relate to income measured before taxes are paid and government benefits received.2Estimates of inequality measured after tax can be found in this Data Explorer.
Inequality over the past century: dramatic declines, followed by substantial rises in some countries – but not in others
Over the early and mid-20th century, dramatic declines in income inequality were a common experience. In many countries, the share of income received by the richest 1% fell by half or more: from around one-fifth or even one-quarter of all income on the eve of World War I, to one-tenth or less by the 1970s.
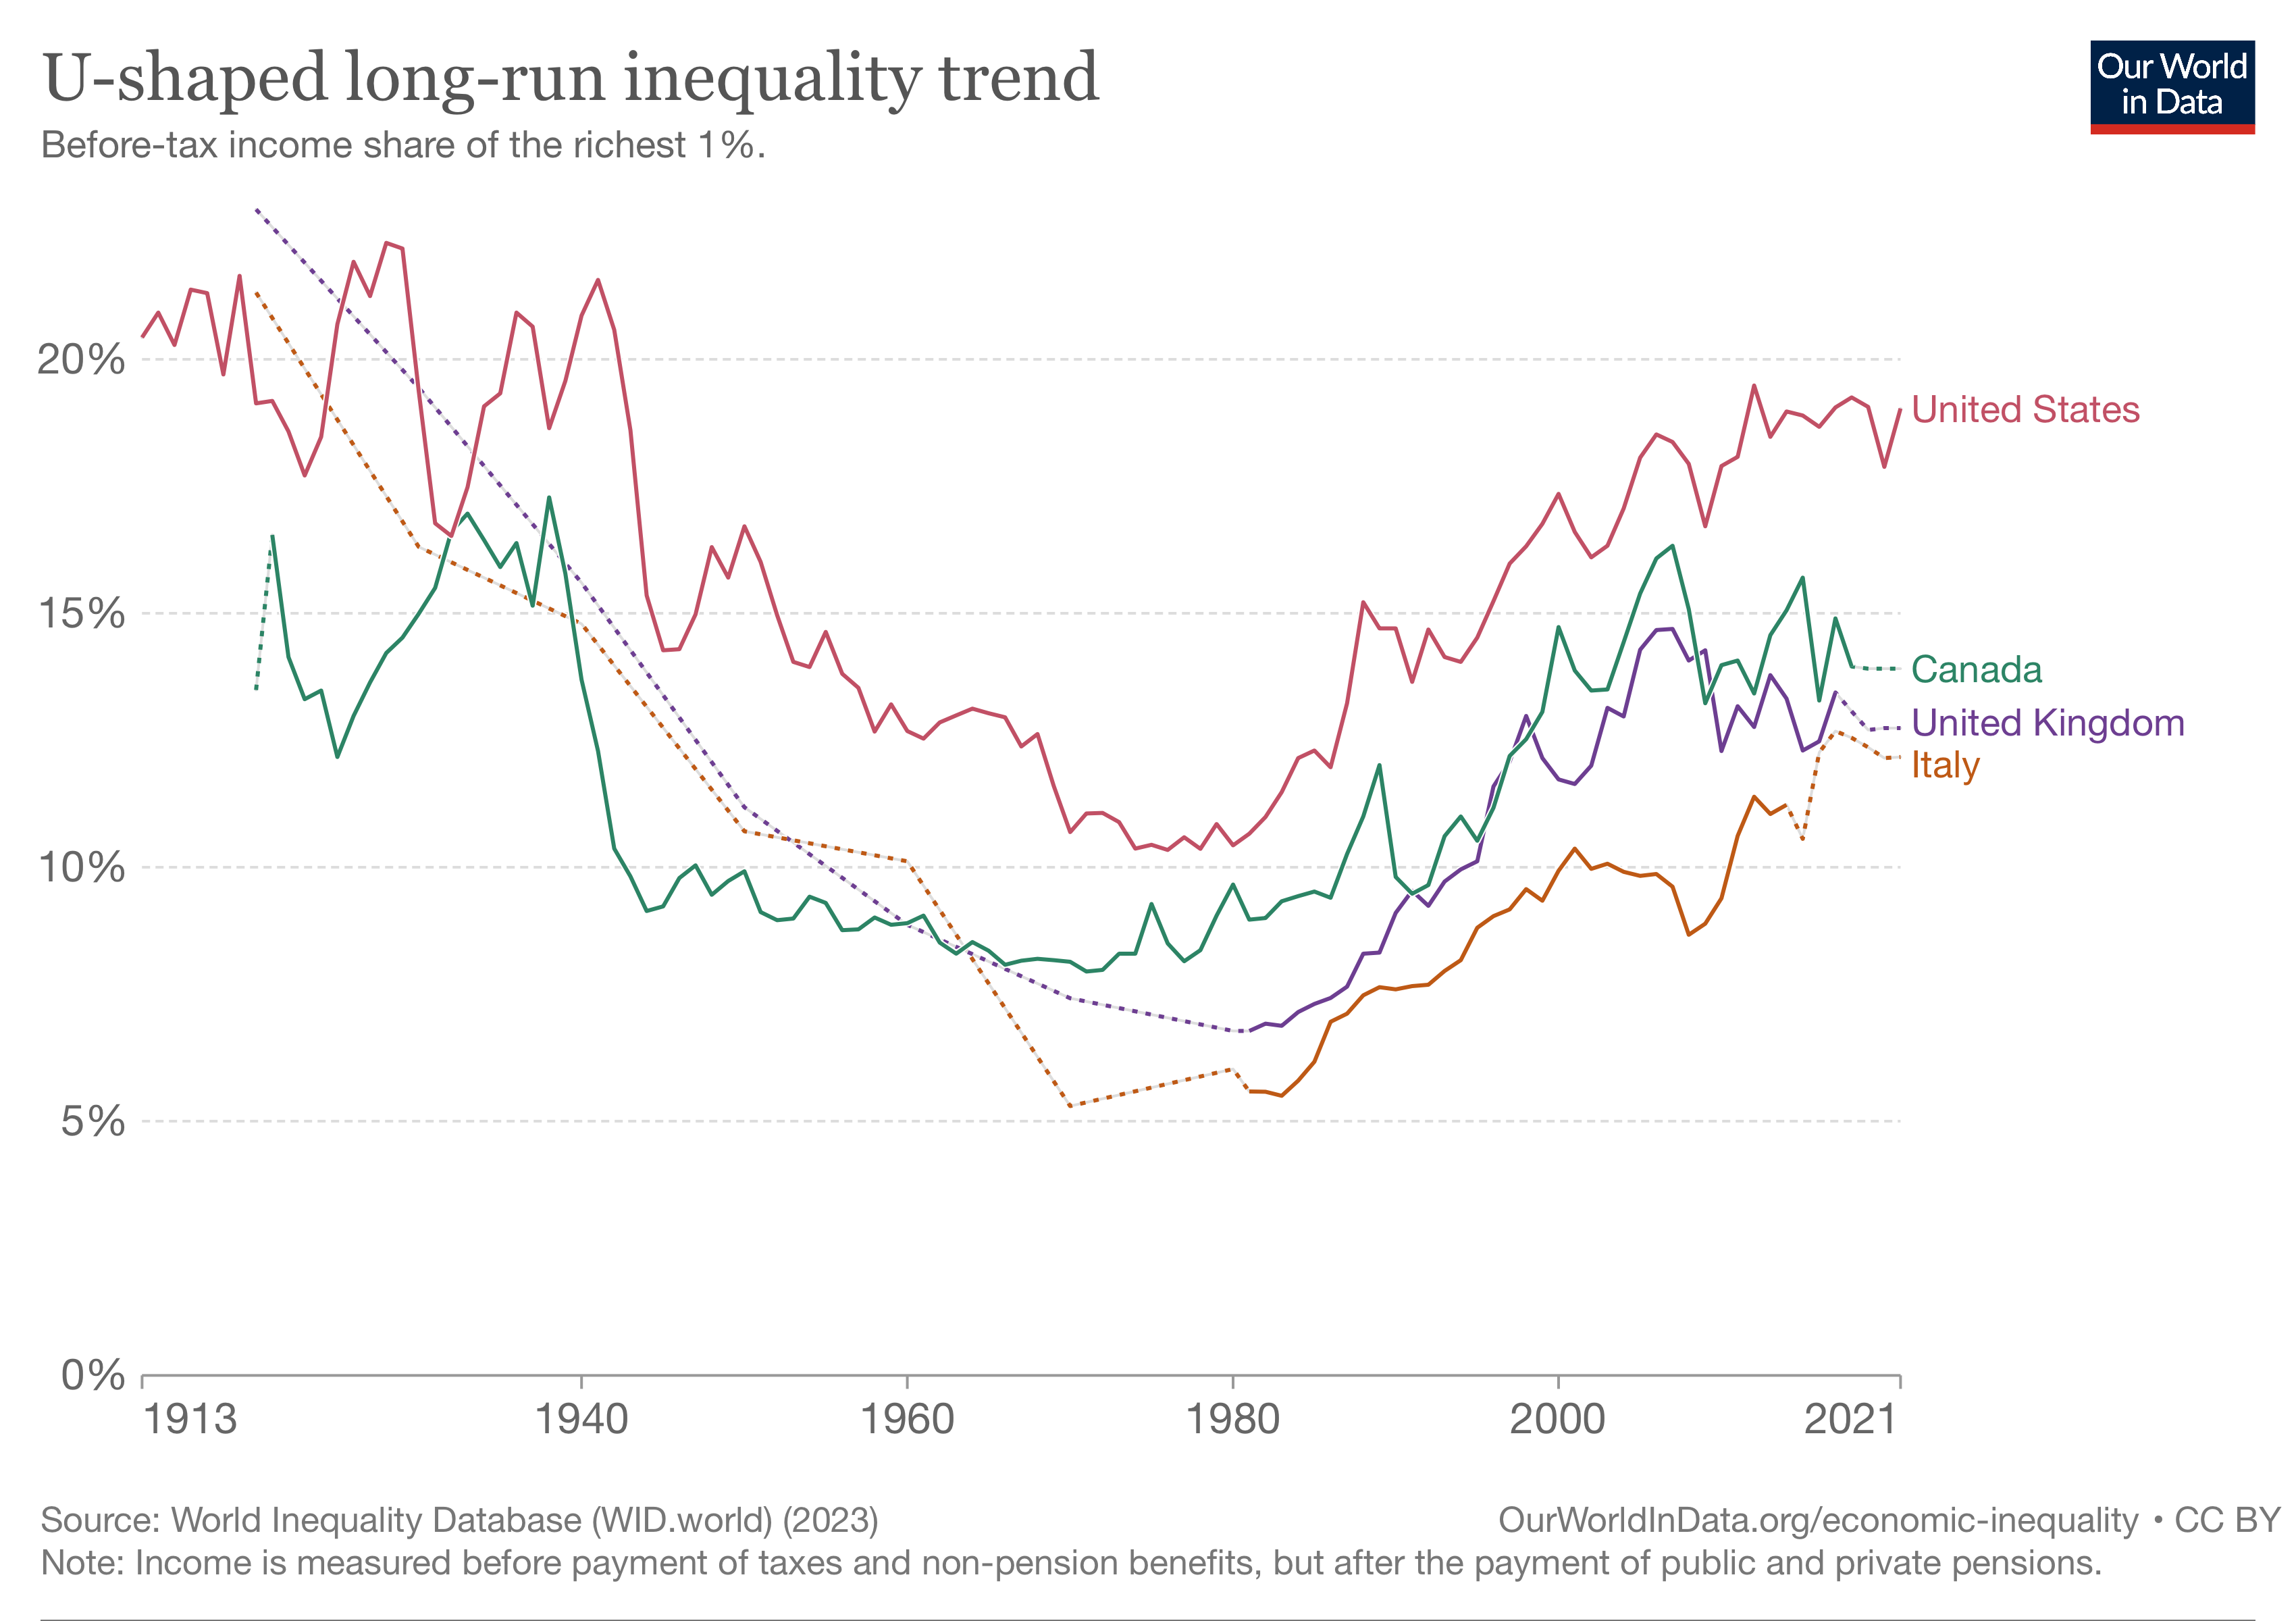
From the 1980s, inequality began to rise again in many high-income countries, tracing a ‘U-shaped’ pattern over the past 100 years. The US is a clear example of this, as shown in the first chart. After a sustained rise over the last 40 years, before-tax inequality in the US is roughly at the same level today as it was a century ago. The US data is shown along with three other countries that saw substantial rises in inequality in recent decades: Canada, the United Kingdom, and Italy.

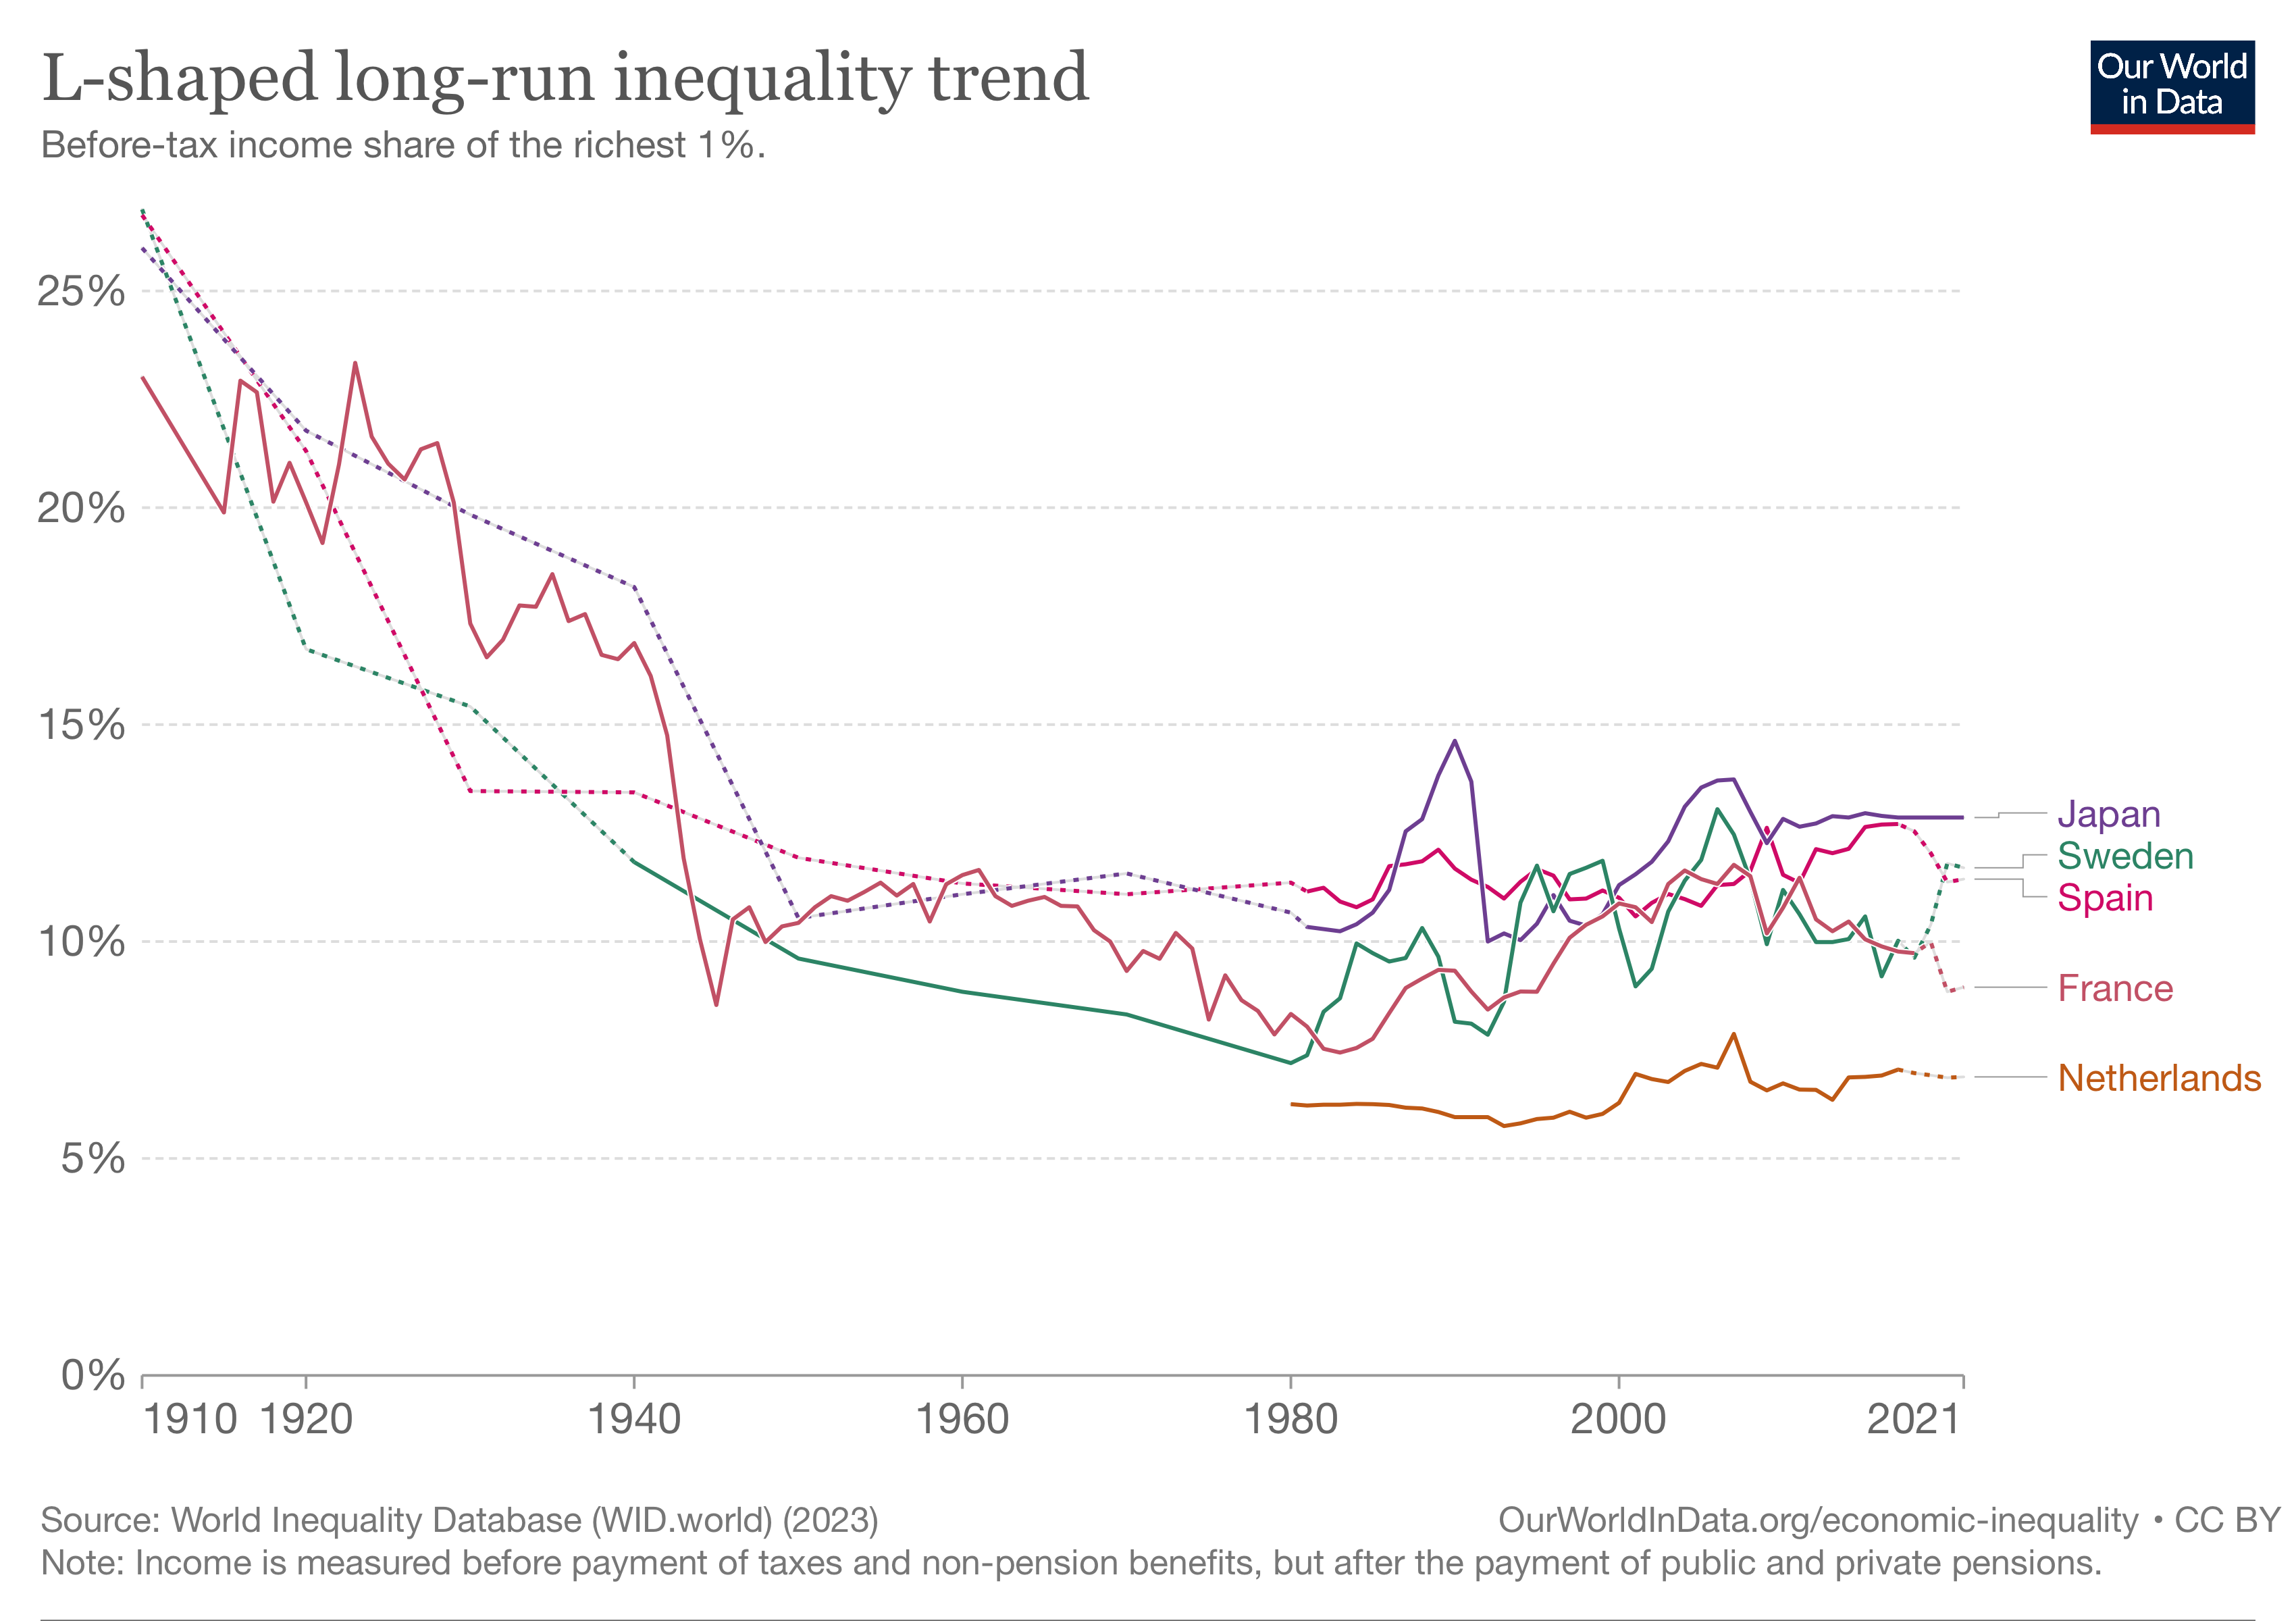
But this path has not been followed everywhere. Many countries that saw steep declines over the early and mid-20th century have maintained relatively stable levels of inequality since then. Examples of countries following this more ‘L-shaped’ trend – Japan, Sweden, Spain, France, the Netherlands – are shown in the second chart.
The differences in these trends tell us something important: high and rising inequality is not an inevitability; it’s something that individual countries can influence. A universal trend of increasing inequality would support the idea that inequality is completely determined by global economic forces like technological progress, globalization, or capitalism. The very different trends we see among countries exposed to these same forces suggest that national institutions, politics, and policy matter a lot.
The problem of the ‘missing rich’ in household survey data
The incomes of the richest are often poorly captured by household surveys. This problem – what inequality researcher Nora Lustig (2019) calls the ‘missing rich’ problem – is due to a combination of factors.3
To understand these, it is worth bearing in mind that household surveys are not censuses: they gather information only from a population sample. This information is then used to make inferences about the population.
Because the extremely rich are few, they are unlikely to be among the sample of the population asked to participate in a survey. A sample missing the extremely rich will give a biased view of how high the average incomes of the very rich are. This is one important reason surveys can understate true incomes at the top.
Another reason is the use of ‘top-coding’ in survey data. This is a common practice of statistical offices in which the incomes reported by survey respondents are capped at a certain threshold, usually to protect the anonymity of very high-income respondents.
Other factors relate to how richer households engage in surveys. Firstly, richer households are less likely to accept when asked to participate. Those that do participate are more likely to not provide answers to certain questions about their income. And where they do answer, richer households are more likely to underreport their true income. There are different reasons why richer households disproportionately fail to provide a correct picture of their incomes. Some rich individuals may wish to avoid scrutiny of their finances, for example. More mundane reasons may also play a part: if richer households tend to have more complicated finances, it may require more effort to respond to surveys correctly.
Unlike surveys, ‘participation’ in filing tax records – and providing truthful information – is a legal requirement. For this reason, tax data avoids many aspects of the ’missing rich’ problem.4
It is important to realize that the statistical agencies conducting income surveys are, of course, aware of the difficulties of measuring top incomes accurately. They use a range of strategies to improve their estimates.5 Indeed, in some countries, household surveys use a hybrid approach in which income information is first gathered from tax records before individuals are invited to provide other information via a questionnaire. This has been shown to greatly reduce the problem of the ‘missing rich’.6
The extent to which such strategies are adopted varies greatly across countries, however, and the ability of survey data to accurately capture incomes at the top remains an important concern.
Republished under a Creative Commons BY license from Our World In Data. Read the original article.
The Power of Play