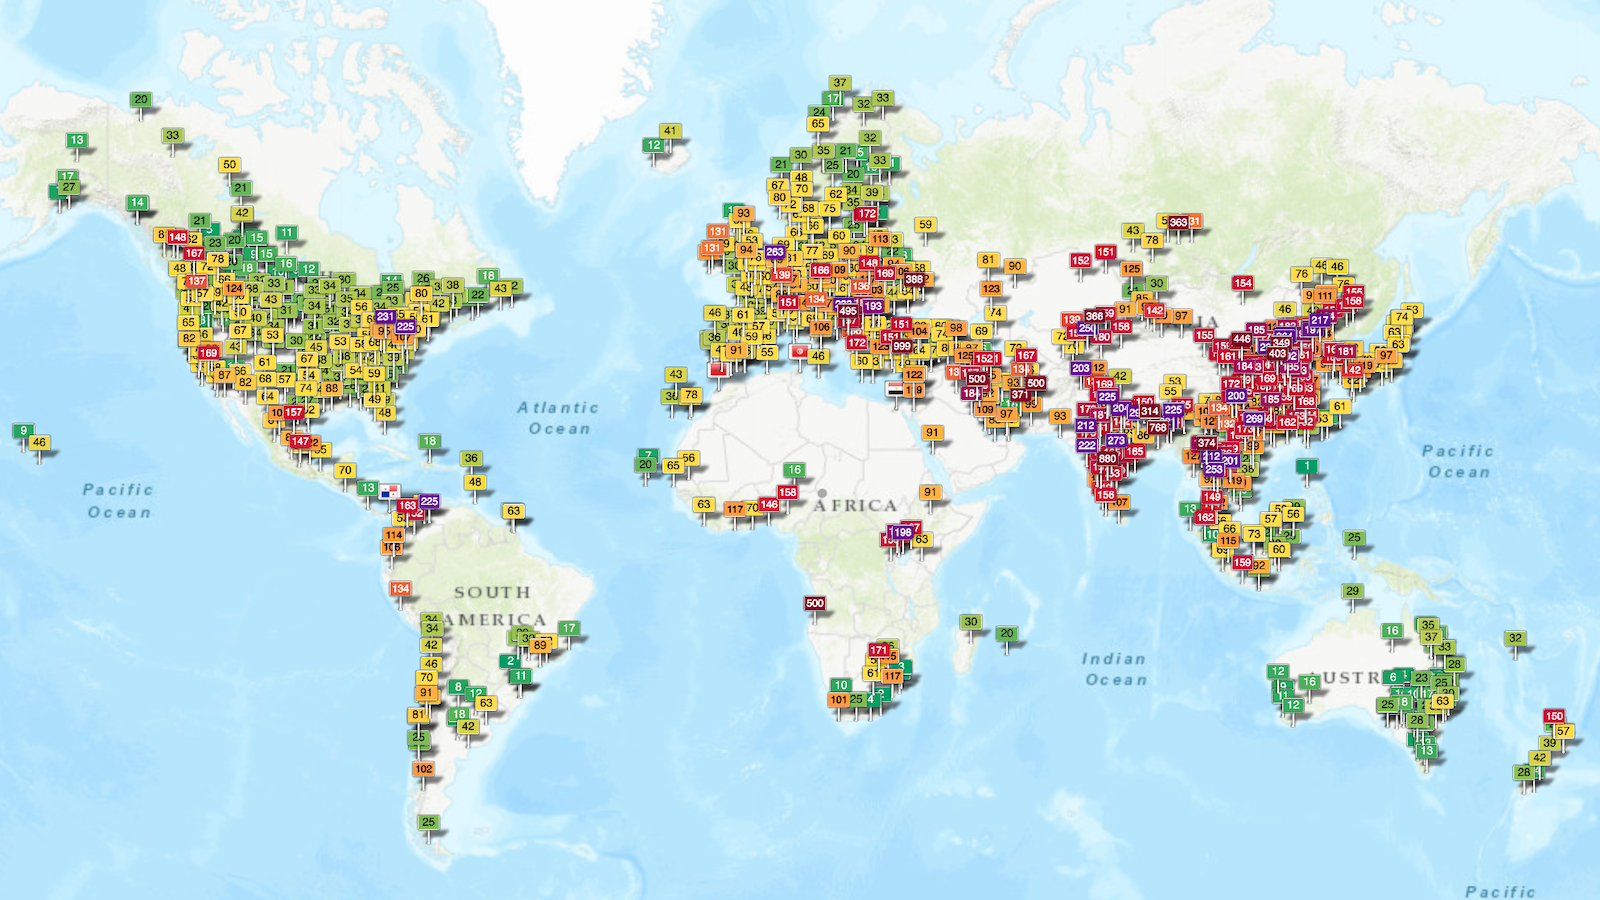
A map of London’s most toxic breathing spots
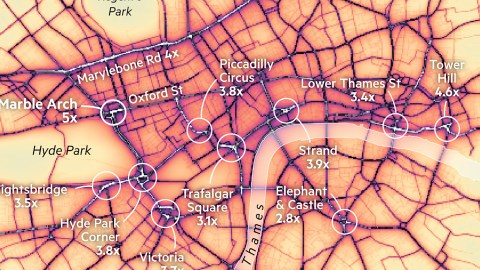
Image: Steven Bernard / Financial Times
- Dirty air is an invisible killer, but an effective one.
- More than 9,000 people die prematurely in London each year due to air pollution, a recent study estimates.
- This map visualizes the worst places to breathe in Central London.
The Great Smog of 1952
London used to be famous for its ‘pea-soupers’: combinations of smoke and fog caused by burning coal for power and heating.
All that changed after the Great Smog of 1952, when weather conditions created a particularly dense and persistent layer of pollution. For a number of days, visibility was reduced to as little as one foot, making traffic impossible. The fog even crept indoors, leading to cancellations of theater and film showings. The episode wasn’t just disruptive and disturbing, but also deadly. According to one estimate, it directly and indirectly killed up to 12,000 Londoners.

London Mayor Sadiq Khan.
Image: MONEY SHARMA/AFP/Getty Images
Invisible, but still deadly
After the shock of the Great Smog, the UK cleaned up its act, legislating to replace open coal fires with less polluting alternatives. London Mayor Sadiq Khan is hoping for a repeat of the movement that eradicated London’s smog epidemic, but now for its invisible variety.
The air in London is “filthy, toxic,” says Khan. In fact, poor air quality in the British capital is a “public health crisis”. The city’s poor air quality is linked not just to thousands of premature deaths each year, but also to a range of illnesses including asthma, heart disease and dementia. Children growing up in areas with high levels of air pollution may develop stunted lungs with up to 10% less capacity than normal.

Khan has led a very active campaign for better air quality since his election as London Mayor in 2016. Some of the measures recently decided:
- Transport for London has introduced 2,600 diesel-electric hybrid buses, which is said to reduce emissions by up to 40%.
- Mr Khan has pledged to spend £800 million on air quality over a five-year period.
- Uber fares will rise by 15p (20¢) to help drivers buy electric cars.
- Since the start of 2018, all new single-decker buses are zero-emission and all new taxis must be hybrid or electric.
- Mr Khan has added a T-charge on the most toxic vehicles entering the city. On 8 April, the T-charge will be replaced by an Ultra-Low Emission Zone (ULEZ), contiguous with the Congestion Charge Zone.
- The ULEZ is designed to reduce emissions of nitrogen oxide and particulate matter by charging vehicles who don’t meet stringent exhaust emission standards.
- By October 2020, a Low-Emission Zone (LEZ), applicable to heavy commercial vehicles, will cover most of Greater London.
- By October 2021, the ULEZ will expand to cover a greater part of Central London.

Heathrow (bottom left on the overview map) is another pollution hotspot
Image: Steven Bernard / Financial Times
Central London’s worst places for breathing
What worries experts is that despite considerable efforts already made, levels of air pollution stubbornly refuse to recede – and remain alarmingly high in locations where traffic flows converge.
It’s not something you’d think of, given our atmosphere’s fluctuating nature, but air pollution hotspots can be extremely local – as the above map demonstrates.
One important lesson for all Londoners: Don’t inhale at Marble Arch! Levels of nitrogen dioxide (NO2) are five times the EU norm – the highest in the city. Traffic permitting, quickly cross Cumberland Gate to Speakers’ Corner and further into Hyde Park, where levels sink back to a ‘permissible’ 40 milligrams per cubic meter. Now you can inhale!
Almost as bad: Tower Hill (4.6 times the EU norm) and Marylebone Road (4 times; go to nearby Regent’s Park for relief).
Also quite bad: the Strand (3.9), Piccadilly Circus (3.8), and Hyde Park Corner (also 3.8), Victoria (3.7) and Knightsbridge (3.5), the dirty trio just south of Hyde Park.
Elephant & Castle is the only pollution hotspot below the Thames and, perhaps because it’s relatively isolated from other black spots, also the one with the lowest multiplication factor (2.8 times the maximum level).
On the larger map, the whole of Central London, including its relatively NO2-free parks, still shows up as more polluted than the outlying areas. Two exceptions flare up red: busy traffic arteries; and Heathrow Airport (in the bottom left corner).

Traffic congestion on London’s Great Portland Street
Image: Mike Malone, CC BY SA 4.0
So why is Central London’s air pollution problem so persistent? In part, this is because the need for individual transport in cars seems to be inelastic. For example, the Congestion Charge has slashed the number of vehicles entering Central London by 30%, but the number of (CC-exempt) private-hire vehicles entering that zone has quadrupled over the same period.
Cycling has really taken off in London. But despite all pro-cycling measures, a wide range of other transport options and car-dissuading measures, central London is still a very congested place. Average traffic speeds on weekdays has declined to 8 miles (13 km) per hour – fittingly medieval speeds, as the road network was largely designed in medieval times.
Narrow streets between high buildings, filled to capacity with slow-moving traffic are a textbook recipe for semi-permanent high levels air pollution.
The large share of diesel vehicles on London’s streets only increases the problem. Diesel vehicles emit lower levels of carbon dioxide (CO2) than petrol cars, which is why their introduction was promoted by European governments.
However, diesels emit higher levels of the highly toxic nitrogen dioxide (NO2) than initial lab tests indicated. Which is why they’re being phased out now.

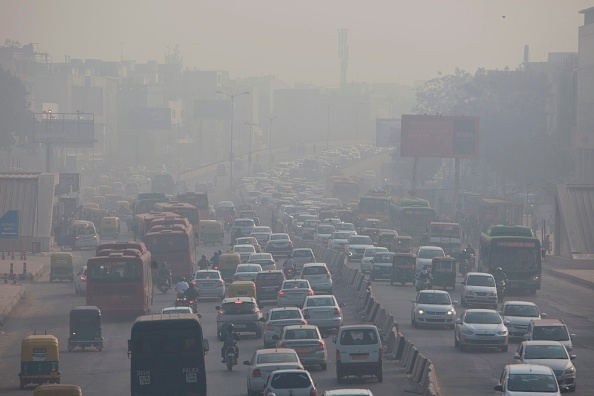
By some measures, London’s air quality is almost as bad as New Delhi’s.
Image: Sanchit Khanna/Hindustan Times via Getty Images
As bad as Delhi, worse than New York
By some measures, especially NO2, London’s air pollution is nearly as bad as big Asian cities such as Beijing or New Delhi, and much worse than other developed cities such as New York and Madrid.
The UK is bound to meet pollution limits as set down in the National Air Quality objectives and by EU directives, for example for particulate matter and nitrogen dioxide.
- Particulate matter (PM2.5) consists of tiny particles less than 2.5 micrometres in diameter emitted by combustion engines. Exposure to PM2.5 raises the mortality risk of cardiovascular diseases. The target for PM2.5 by 2020 is 25 µg/m3. All of London currently scores higher, with most areas at double that level.
- Mainly emitted by diesel engines, NO2 irritates the respiratory system and aggravates asthma and other pre-existing conditions. NO2 also reacts with other gases to form acid rain. The limit for NO2 is 40 µg/m3, and NO2 levels must not exceed 200 µg/m3 more than 18 times a year. Last year, London hit that figure before January was over.

Elephant & Castle, London.
Image: laszlo-photo, CC BY SA 2.0
Google joins fight against air pollution
Studies predict London’s air pollution will remain above legal limits until 2025. Sadiq Khan – himself an asthma sufferer – is working to make London’s air cleaner by measures great and small. Earlier this week, he announced that two of Google’s Street View cars will be carrying air quality sensors when mapping the streets of London
Over the course of a year, the two cars will take air quality readings every 30 metres in order to identify areas of London with dangerous levels of air pollution that might be missed by the network of fixed sensors. An additional 100 of those fixed sensors will be installed near sensitive locations and known pollution hotspots, doubling the network’s density.
It’s all part of Breathe London, a scheme to map the British capital’s air pollution in real time. Breathe London will be the world’s largest air quality monitoring network, said Mr Khan, launching the scheme at Charlotte Sharman Primary School in the London borough of Southwark.
Up to 30% of the school’s pupils are said to be asthma sufferers. Charlotte Sharman is close to Elephant & Castle, as the above map shows, one of Central London’s air pollution hotspots.
Strange Maps #956
Got a strange map? Let me know at [email protected].