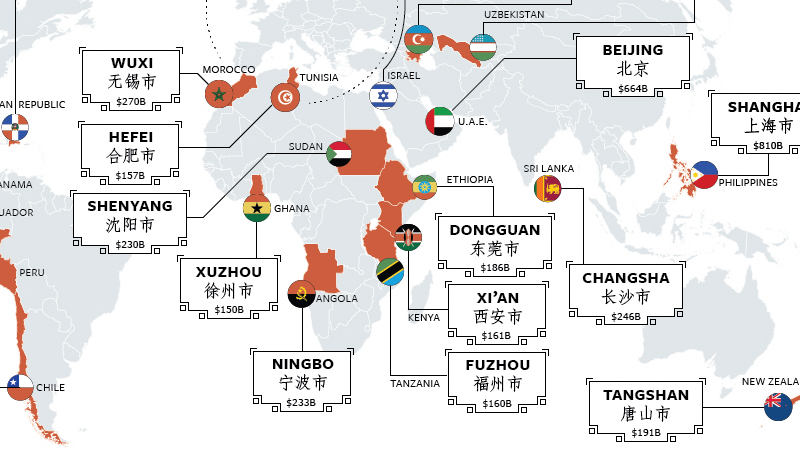
503 – Chinese Provinces Compared to Countries with Similar GDPs

The economic size of huge countries like the US and China is hard to grasp. An excellent way to visualise standalone statistics like those is to match those countries’ constituent parts (states and provinces, respectively) with entire nations that have a comparable Gross Domestic Product (GDP).
Such a map of the US was discussed on this blog some time ago (#131, see also #135). It spawned a similar map comparing US states with countries that have about equal population sizes (#388), and another one doing the same for Chinese provinces (#312). The Economist has now published a map that completes the series, comparing Chinese provinces to countries with a similar GDP.

In 2010, China as a whole generated a GDP of $5.7 trillion, overtaking Japan ($5.4 trillion) to become the world’s second-largest economy (1). China is growing by leaps and bounds, and at this rate is expected to grab the top spot from the US by 2020. But China’s total GDP is not the whole story. With an average annual income per person of no more than $4,283, China ranks a measly #95 on the IMF’s per capita GDP list, between Ecuador and Belize. Japan, with a per capita GDP of $42,325, ranks 16th, between Belgium and France (2).
China’s economic powerhouses are some of its coastal provinces, GDP generally declining further inland. But that all too simple picture is nuanced by this map. Wealthier coastal and inland provinces are circling a few poorer provinces, squeezed in between. Tibet, the largest province, is also the poorest, its GDP being less than 1/80th of Guangdong’s – an economic chasm somewhat more graspable by comparing their foreign GDP equivalents, Malta and Indonesia. It is to be noted that this is absolute, not per capita GDP: Hong Kong will be much closer to the latter list’s top spot than in this ranking.
——
(1) International Monetary Fund ranking for 2010. The world in total: $62 trillion. The European Union: $16 trillion – but as it is a supranational organisation, this does not count as a single entry. The US remains Number One with $14.7 trillion. Germany, the UK and France take the fourth, fifth and sixth positions with $3.3 trillion, $3.2 trillion and $2.5 trillion, respectively. The IMF’s whole ranking (and similar lists) here at Wikipedia.
(2) that whole list, plus the World Bank and CIA World Factbook versions, at this Wikipedia page.