NASA’s Fermi Satellite Completes Map Of The Sky; Finds Mysterious, Unknown Monster
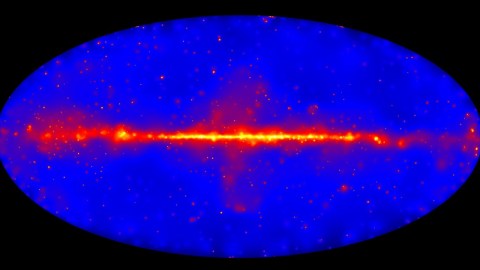
The first ultra high-energy map of the Universe is complete after six years. And there’s a surprise inside.
“I happen to have discovered a direct relation between magnetism and light, also electricity and light, and the field it opens is so large and I think rich.”
–Michael Faraday
For a long time, astronomy was limited to the light we could see. Telescopes were huge improvements over the human eye, capable of gathering much greater amounts of light due to their large apertures. As our technology progressed, we realized that the light our eyes are sensitive to is just a tinypart of all the light that’s out there in the Universe, which comes in lower energy (longer wavelength) and higher energy (shorter wavelength) version, with gamma rays achieving the highest energies of all.
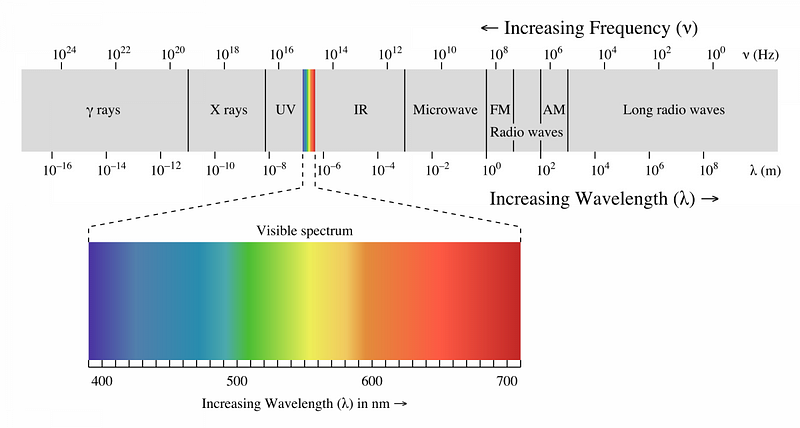
When we look out at the stars, the galaxy and the Universe, each wavelength band we observe in can teach us something different about the Universe. This is because different wavelengths of light are emitted or absorbed by different processes. As reported at the 227th American Astronomical Society meeting just yesterday, NASA’s Fermi gamma ray observatory just released six full years worth of data, creating the most comprehensive all sky map of the gamma ray sky at energies between about 50 and 2,000 GeV, or the equivalent of about 50-to-2,000 times the energy contained in a proton from Einstein’s E = mc^2. Here’s what it found.
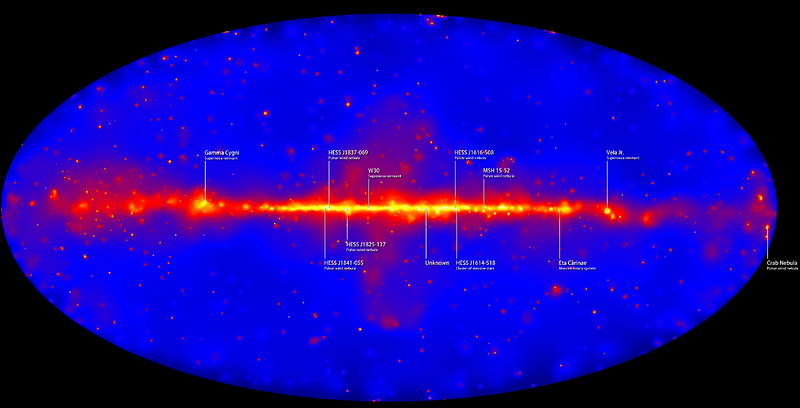
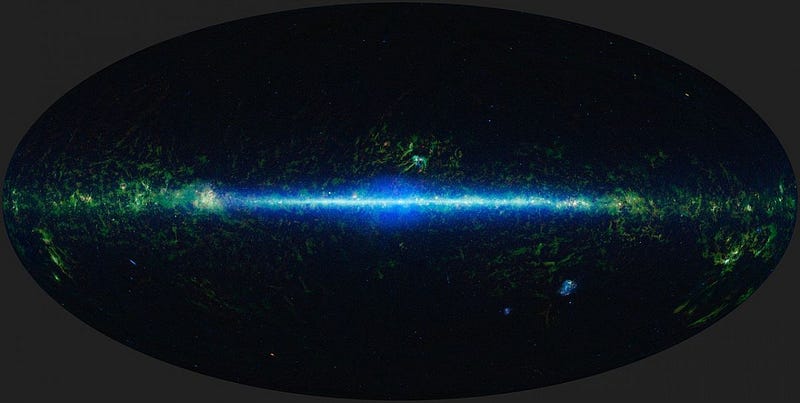
For those of you who’ve seen all-sky maps before, you might notice that this looks a lot like the most recent all-sky map posted in the infrared, by NASA’s Wide-field Infrared Survey Explorer (WISE) spacecraft. As you can see by looking above (at the gamma-ray sky) and below (at the infrared) sky, both show evidence of fine, gaseous structure around the galactic plane, large nebulae at various locations along the Milky Way itself, and bubbles of gas perpendicular to the galactic nucleus.
There’s a good reason for this: the physics of how gamma rays are made in the first place! There are all sorts of high-energy astrophysical sources in the Universe:
- dense and/or massive stars,
- white dwarfs,
- neutron stars
- and black holes of all different masses,
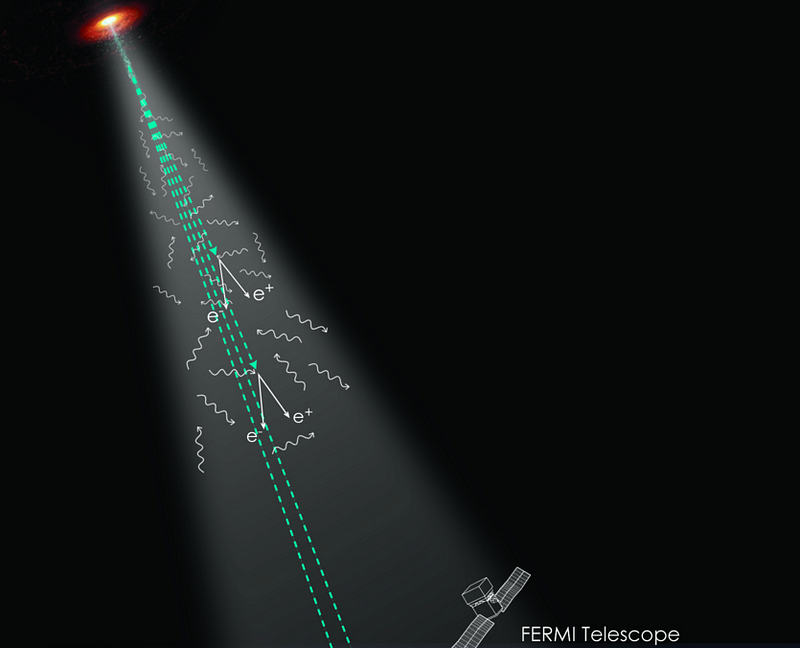
that have very strong magnetic fields and which accelerate particles and experience outbursts of activity. Most of the particles they accelerate are protons, but this is actually brilliant. As these protons travel through the Universe and our galaxy as cosmic rays, they eventually run into other material: other matter in the form of protons. When two protons of very high energies collide — normally from an incoming extremely high-energy one colliding with a stationary one — they produce unstable particles known as pions, which decay to produce, among other things, gamma rays of exactly the energies that Fermi is sensitive to.
This is why the infrared maps and the gamma ray maps are so similar: they both trace the neutral, modestly cool gas within our galaxy. The difference is that the infrared traces it from its thermal emission temperature, while the gamma rays trace it from the few very high-energy particles they collide with. The entire Fermi map, if you’re wondering, contains some 61,000 gamma ray photons, a number that took 80 months of observations to collect. Fermi contains a bunch of point sources that the infrared maps don’t: these are mostly supermassive black holes from beyond our own galaxy and one-time “burst” events. But what’s really amazing is that most of the well-known high energy sources in our galactic plane are clearly identifiable, for the first time, in this gamma ray map!
The Crab Nebula is there along with many other supernova remnants, pulsar wind nebulae, and the famous outburst star that’s destined for doom at any time: Eta Carinae. But what’s most exciting — what’s always the most exciting — is when you find something you didn’t expect to encounter. We’ve done a great job mapping the galactic plane, which was a tremendous achievement given that you can’t see through the interstellar dust in the optical. But you can in the infrared, and we’ve done that not only with WISE, but with the much higher-resolution (and higher-energy) Spitzer Space Telescope, which has mapped the entire Milky Way galaxy. Yet of all the sources we’ve discovered, here’s a fun find in the new Fermi data: an unknown source of gamma rays!
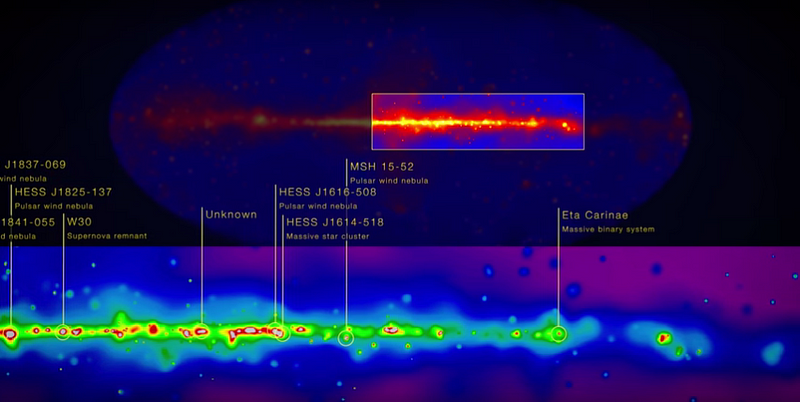
It could be a black hole, a pulsar, a non-pulsing neutron star, or even an extragalactic source that happens to be aligned with out galactic plane. It’s always exciting to find something new, but this may be a case where we don’t even need to go take a telescope and go look to find out what it is; we might just be able to go and look in the currently-existing Spitzer data to discover it!
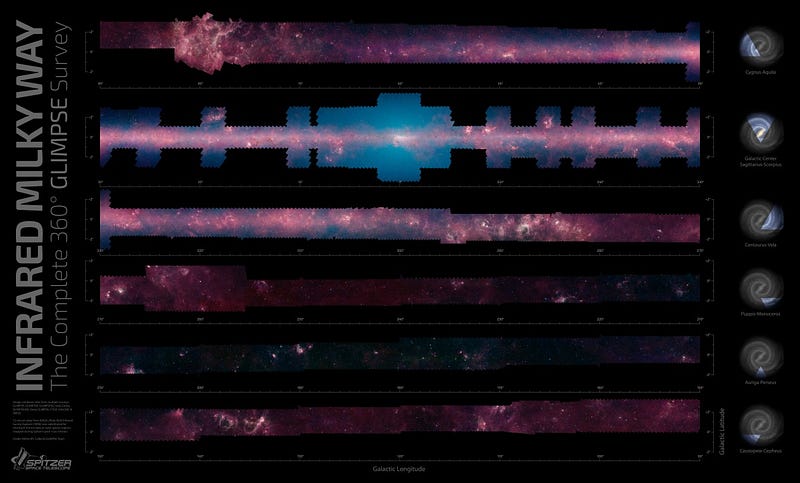
The entire GLIMPSE survey required two million images taken over a 10-year period by Spitzer, and it wound up mapping the entire Milky Way’s plane, extending north and south of the actual plane itself by a few degrees. This unknown object ought to have already been imaged by the Spitzer Space Telescope at high resolution, and should have data at least in the 3.6, 4.5 and 8.0 micron wavelengths, along with the 12 micron infrared WISE data. The overall GLIMPSE composite is available online, but anyone can go in and find the individual high-resolution panels, available for download (as huge files) here.
To the best of my ability, here’s the region that correlates with the unknown signal in the Fermi release, which appears to be at Right Ascension +17 04 22 or so, and Declination -40 44 25.
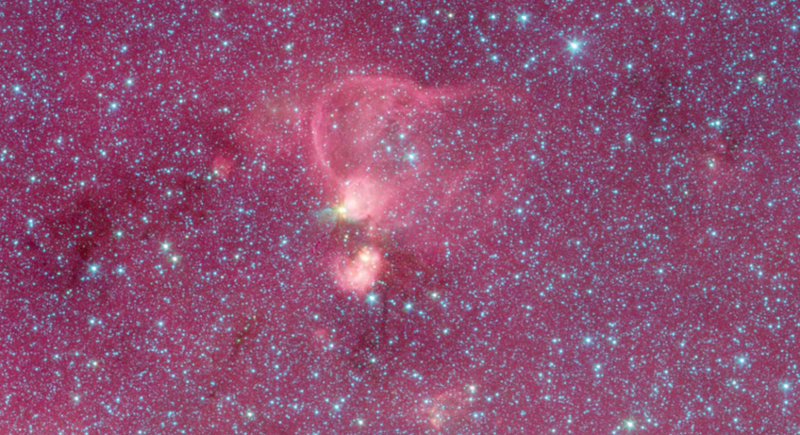
What do you see when you look at this picture? I’m not entirely sure this is what correlates with the signal, but there’s a very interesting structure here that may be related to it: a nebula that may be indicative of recent star formation and, hence, a fantastic stellar remnant and potentially a massive black hole. The map itself is an amazing achievement, but the potentials for new discoveries and the remarkable identification of at least one new object is an exciting development for us all!
This article was partially based on information obtained during the 227th American Astronomical Society meeting, some of which may be unpublished.
Leave your comments on our forum, and check out our first book: Beyond The Galaxy, available now, as well as our reward-rich Patreon campaign!

