Did The Largest Galaxy Survey Ever Just Challenge Cosmology As We Know It?

With 5,000 square degrees of data, the Dark Energy Survey has something important to say.
For as long as humans have been studying the Universe, we’ve yearned to know the answers to the biggest questions of all. What, exactly, is out there in the abyss of deep space? Where did it all come from? What is it made out of, and how did it get to be this way? And, moreover, what will its ultimate fate be? Starting in the 1920s, we began to accumulate enough evidence to start drawing robust conclusions about the Universe’s nature and behavior, identifying galaxies beyond our own Milky Way, measuring their distances and redshifts, and determining that the Universe was expanding.
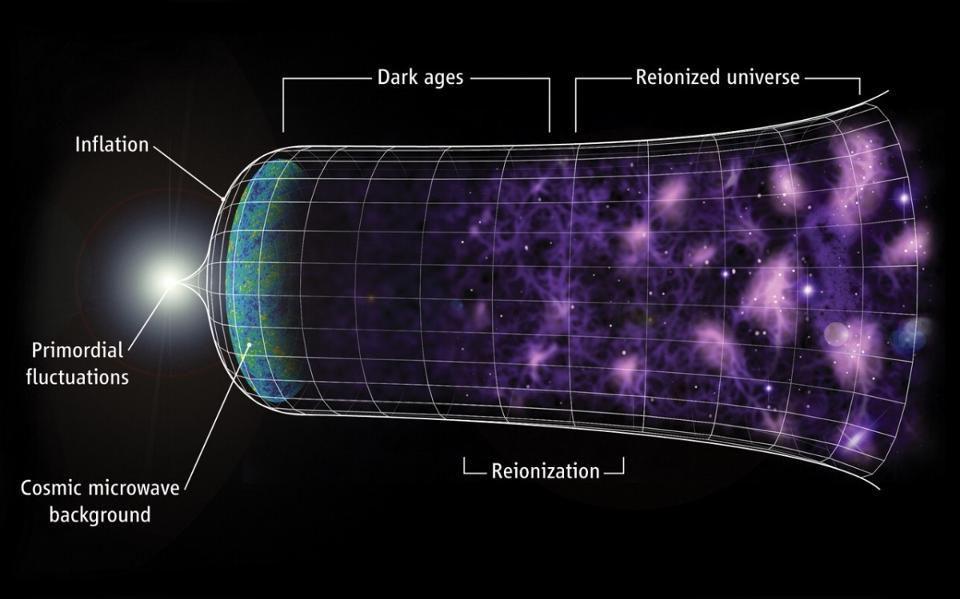
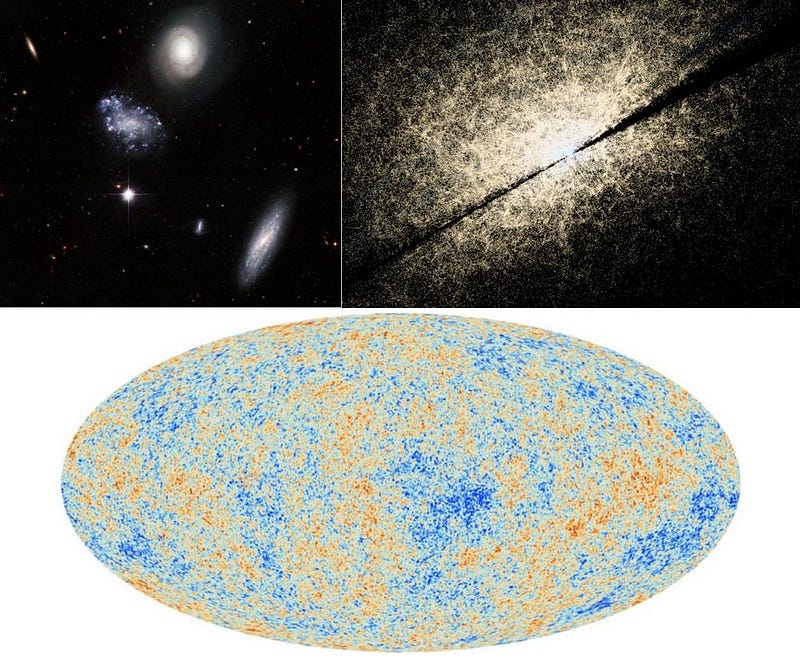
It’s been nearly a full century since then, and the level of precision to which we measure the Universe has increased dramatically. In 2018, for example, the Planck collaboration released their final results from most exquisite all-sky measurements of the temperature fluctuations in the Cosmic Microwave Background: the leftover glow from the Big Bang. Its results told us what the Universe was made of, what its expansion history was, and what its ultimate fate was likely to be. But signals that tell us the Universe’s composition and expansion history should also be imprinted in galaxies throughout the Universe, and the largest such survey ever conducted is the Dark Energy Survey, which just released their latest results.
How well do they match the picture we’ve put together so far? Let’s dive in and find out.
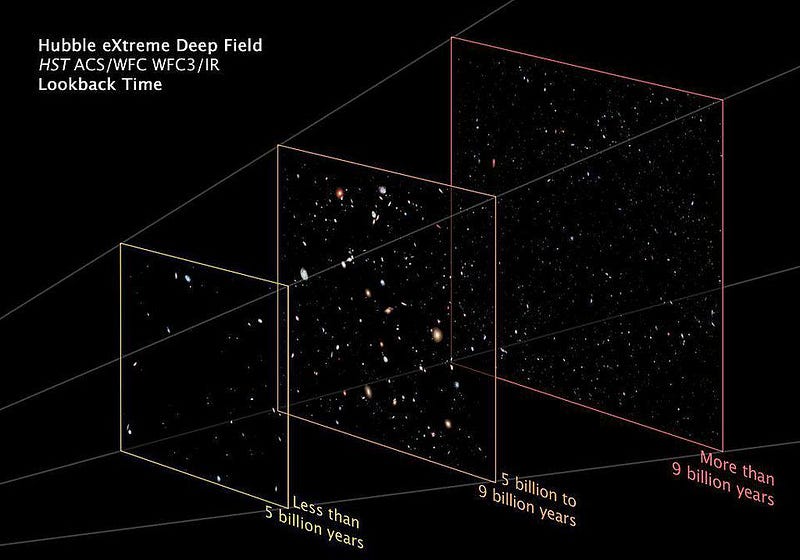
When we look out at the Universe, to greater and greater distances, we’re actually looking farther back in time as well. The farther away an object is, the longer it takes the light it emits to travel to our eyes. As the Universe expands, the distances between objects increases, and the light itself gets stretched: shifted to longer and longer wavelengths. All together, as the Universe expands, a number of things happen:
- the energy density dilutes, as radiation and matter (both normal and dark) become less dense as the volume increases,
- the expansion rate, determined by the total energy density, also changes (by decreasing) with time,
- massive clumps of matter grow via gravitational attraction, changing the way that space in that vicinity bends the background light,
- and whenever we observe a photon that was emitted a long distance away, the light we wind up measuring has imprinted on it the cumulative gravitational effects at play, including the expansion of the Universe, gravitational lensing, and the changes in gravitational potential from the objects it encountered along its journey to us.
In other words, the light we observe tells the story of what’s happened in the Universe ever since that light was emitted.
This is the big idea behind using galaxy surveys to help infer what’s out there in the Universe. Instead of using a signal from one “snapshot” in the Universe’s past — which is what the Cosmic Microwave Background gives us, for instance — we can look back to a wide variety of “snapshots” in time by looking at the behavior and properties of galaxies at different distances from us.
The key is to understand that, on the largest scales, the physics governing the Universe actually becomes relatively simple compared to what we glean by looking at small-scale, individual structures. On the scale of a single galaxy, for example, there are enormous complexities to consider. Gas and dust interact with starlight; ultraviolet radiation can ionize matter in the interstellar medium; gas clouds collapse, triggering new star formation; as matter gets heated up, it affects the dark matter in the galactic core; if star formation becomes too intense, the normal matter inside can get ejected. And yet, despite all of that messiness, and the complex interplay of dark matter with the physics of normal matter, individual galaxies can still tell you nothing about dark energy.
When you look at how galaxies cluster together on large cosmic scales, however, there are actually far fewer poorly understood complexities to get in the way.
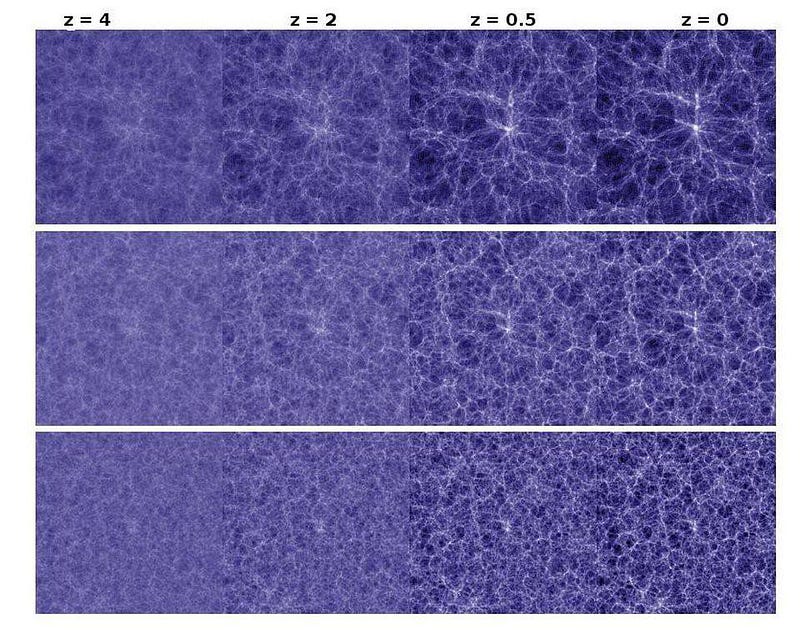
On the largest scales — say, scales of a few tens of millions of light-years or more — you can model the Universe fairly simplistically and still get some very powerful predictions for your troubles. You can treat dark matter as a collisionless fluid, gravitating but not responding to any other forces. You can model normal matter as massive but with self-interactions and with couplings to photons. You can treat photons as a bath of radiation that exerts pressure and scatters off of normal matter, but not dark matter. And you can fold in dark energy as well, and then run your simulations from early times up through and including the present day.
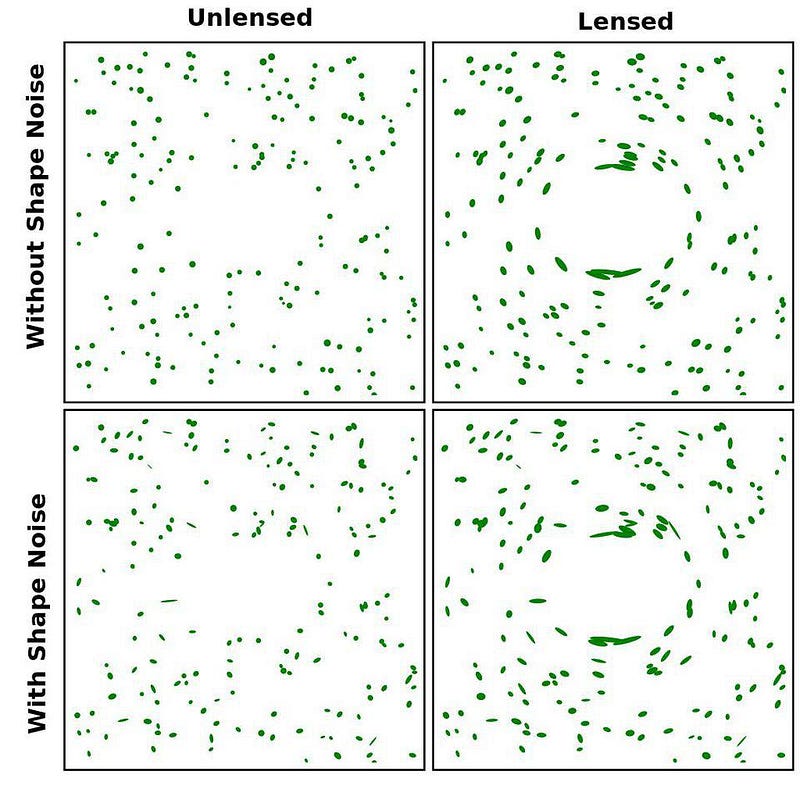
The idea is that by making a large set of “mock catalogues” of galaxies based on slight differences in cosmological parameters. You can then evaluate them based on whichever observable criteria you choose. How do galaxies cluster together? How much does the presence of mass distort the average apparent shapes of galaxies? And what happens when we try to cross-correlate the sources of lensing with the actual positions of galaxies in our catalogue? The answers are highly sensitive to the composition of the Universe we choose to consider.
That’s all on the theory side. You run simulations, you evaluate them, and you extract what sets of observables correspond to being consistent or inconsistent with each one.
But astrophysics is a little bit different than physics. Whereas physics is an experimental science, astrophysics is an observational one. You can only put the Universe to the test insofar as you can observe it. Unless your observations are comprehensive and flawless — meaning you can see everything exactly as it is — you have a large number of effects you need to account for.
For example, your observations:
- are limited by resolution, as objects too close together will appear as a single source,
- are limited by brightness, as objects that are too faint won’t appear,
- are limited by redshift, as an object that’s too severely redshifted will no longer fall within your telescope’s sensitivity range,
- have confounding factors at play, such as not being able to distinguish, for individual objects, how much of the redshift is due to a galaxy’s motion versus how much is due to the expansion of the Universe,
and a number of other factors. Still, the key to connecting theory and observation is to account for all of these issues to the best of your ability, and then compare your observed-and-analyzed data set with your theoretically generated/simulated ones, and see what you can learn about the Universe.
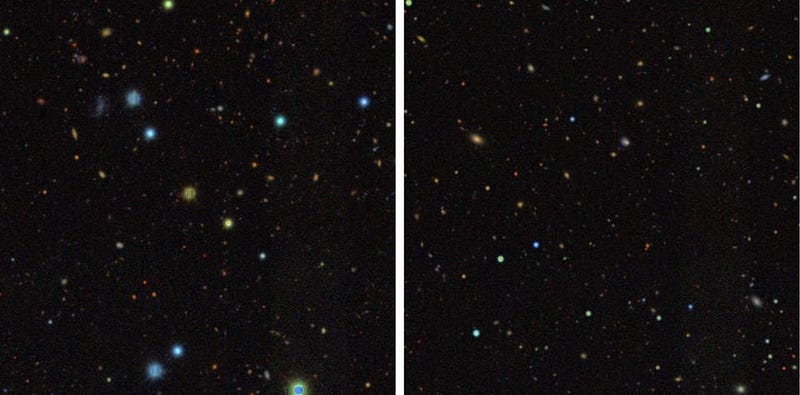
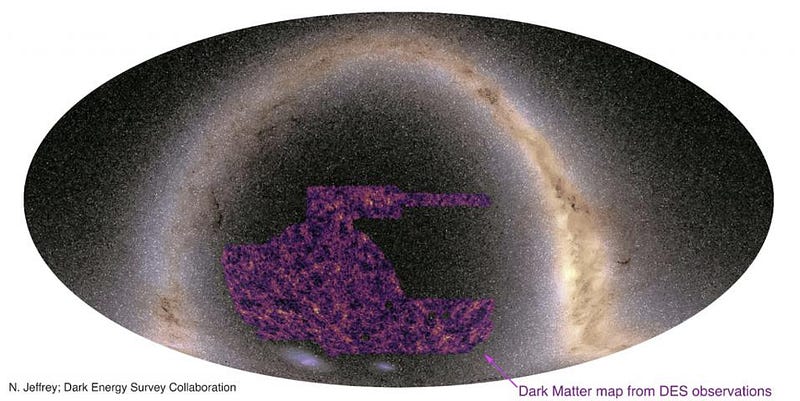
On May 27, 2021, the Dark Energy Survey collaboration released a series of papers — 26 in total (of a planned 30, so 4 more are still to come) — detailing the results from the largest galaxy survey of all-time. In total, they surveyed 5,000 square degrees of area, or the equivalent of about ⅛ of the entire sky. They obtained data on some ~226 million galaxies, including ~100 million of which were useful for understanding cosmic shear (the shape distortion of galaxies).
Perhaps most importantly, they were able to place constraints, based on this data, on a number of important cosmological parameters. These include:
- what is the total amount of matter (normal and dark, combined) in the Universe?
- what is the equation-of-state of dark energy, and is it consistent with a cosmological constant?
- is there strong evidence supporting either a higher (~73–74 km/s/Mpc) or a lower (~67 km/s/Mpc) expansion rate?
- and are there other parameters that conflict with the parameters inferred from other observations, like the size of the acoustic scale or the clustering amplitude?
After all, if we want to make the claim that we understand what the Universe is made of and what it’s fate must be, the different lines of evidence that we collect should all point to the same overall, self-consistent picture.
To be clear, the Dark Energy Survey team really did their homework. There are papers specifically on a variety of important aspects to address, including blinding procedures when multiple cosmic probes are used, internal consistency tests with posterior predictive distributions, and how to quantify tensions between Dark Energy Survey (galaxy survey) and Planck (CMB) data. There are also papers on how to address systematics, on how to properly calibrate their data for each of the three indicators they’re using, and how to account for various forms of bias.
When all is said and done, this team of hundreds of scientists synthesized together the largest galactic data set ever for these cosmological purposes, and obtained some spectacular results. In particular, some highlights are:
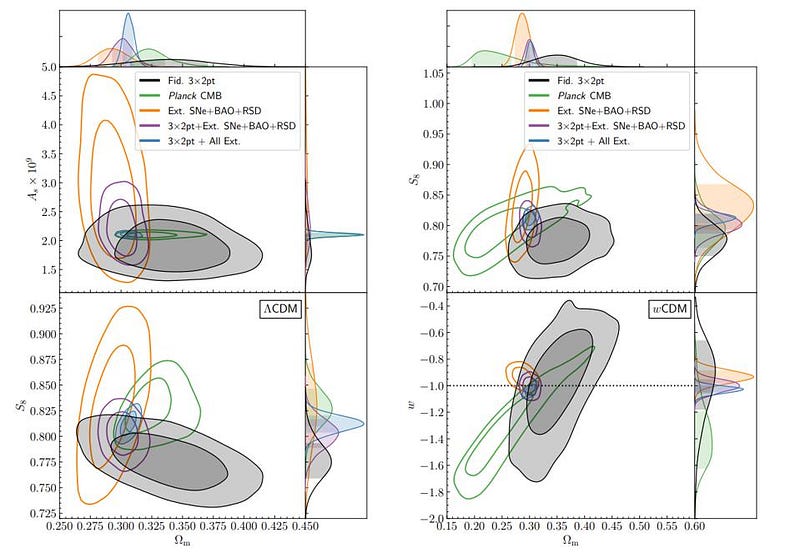
- the total matter density is between 31% and 37% of critical density, whereas Planck gave ~32%,
- the dark energy equation of state is -0.98 (with uncertainties of around 20%), whereas Planck gave -1.03 and a cosmological constant is -1.00, exactly,
- the favored value for the expansion rate, whereas Planck alone gave 67.4 km/s/Mpc, now rises to 68.1 km/s/Mpc when the Dark Energy Survey data is folded in,
- and the greatest “tension” with Planck arises in the value of what cosmologists call S_8, which you can think of as how strongly the Universe clusters together, as the Dark Energy Survey data favors a value of 0.776, while Planck previously had favored a value of 0.832. (Combined, the results yield a value of 0.815, squarely between the two.)
If you were to ask me — a theoretical cosmologist who isn’t part of the Dark Energy Survey collaboration — what this all means, I would likely sum up the results in three points.
- The Dark Energy Survey data, the largest galaxy survey ever conducted so far, has, through three independent methods, confirmed and refined the standard cosmological model.
- When Planck and Dark Energy Survey are taken together, we get a picture that’s essentially unchanged from the Planck data alone: similar matter density, similar support for dark energy being a cosmological constant, similar expansion rate, and a very, very slight shift to what we call the clustering amplitude.
- And the developments that have been made on how to handle such an enormous amount of data of this type will be useful as we look to the future of large galaxy surveys, including ESA’s Euclid, NSF’s Vera Rubin Observatory, and NASA’s Nancy Roman Telescope.
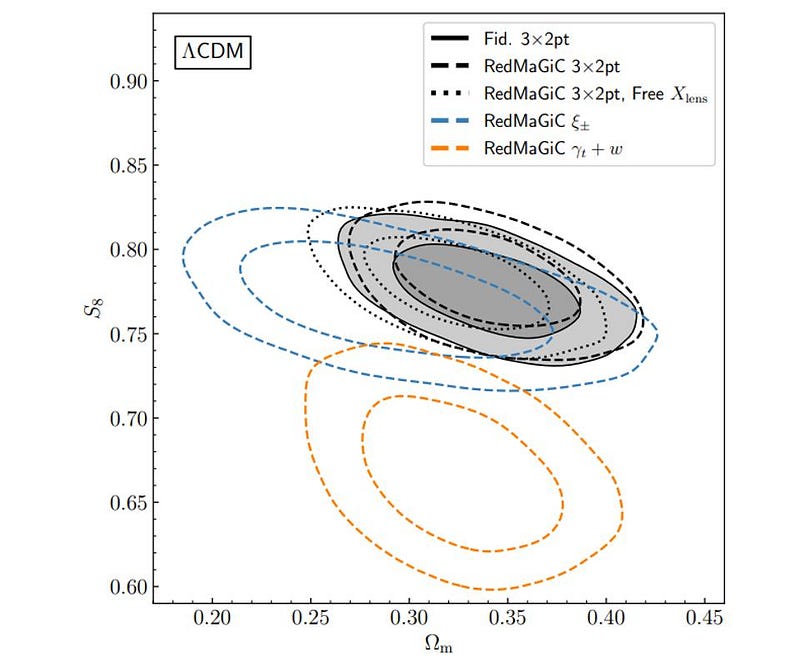
In fact, the biggest surprise they encountered was that the clustering amplitude and the lensing amplitudes, which should match, appeared to disagree. Although this was discussed at length in Section V of the main results paper, further investigation into what could be causing or explaining this issue is needed.
But this is no justification for the absurd headlines that have ensued, with many touting a cosmic mystery that, as Dr. Niall Jeffrey from the Dark Energy Survey team put it, “if this disparity is true then maybe Einstein was wrong.” Carlos Frenk, a cosmologist not associated with the Dark Energy Survey, has also been quoted, stating, “I spent my life working on this theory and my heart tells me I don’t want to see it collapse. But my brain tells me that the measurements were correct, and we have to look at the possibility of new physics.”
These assertions, based on experience, are unlikely to pan out for a variety of reasons. First off, this is the first time we’ve ever compiled or extracted data from a catalogue this large, and a large number of new methods and techniques are being trialed for the first time. Second off, the sample of galaxies used to calculate the discrepant components was only a small fraction of the total number of galaxies; can we be certain that the right sample was selected? Third, there are an enormous number of properties found to be in spectacular agreement with the concordance model; why would we put all the focus on the one part — with questionable significance on the systematic end — that doesn’t match? And fourth, even if it doesn’t match, would you really bet against Einstein with less than 3-σ significance (when you take Planck + Dark Energy Survey data, versus Planck data alone), rather than betting against this one aspect of the data release?
If you want to get headlines, eyeballs, and attention, just say those three magic words, “Einstein was wrong.” You won’t be right, of course; no one has been thus far. Relativity, both the special and general forms, have passed every test we’ve thrown at them for more than a century, and scientists have arguably tried harder to prove Einstein wrong than any other scientist in history. Now, within the framework of General Relativity and in the face of the largest galaxy survey ever, we’re going to claim “Einstein was wrong” instead of looking at the far more likely possibility: that we haven’t handled this unprecedented deluge of data properly in the one instance where a small but significant discrepancy manifests itself?
The truth is we have an enormous new set of valuable data, and we can extract a fantastic amount of information about the Universe from it. The nature and amount of dark matter and dark energy have been confirmed; the Universe’s expansion rate lines up with precisely what previous studies have said; and the clustering amplitude is slightly smaller than we expected it would be. It’s doubtful, however, that this is a sign of new physics; if anything, it’s an issue to investigate further and cross-check with other galaxy surveys. If it turns out to be something that’s actually worth a second look, more and better data will show us the way.
Starts With A Bang is written by Ethan Siegel, Ph.D., author of Beyond The Galaxy, and Treknology: The Science of Star Trek from Tricorders to Warp Drive.