Survey shows Congress is more religious than America

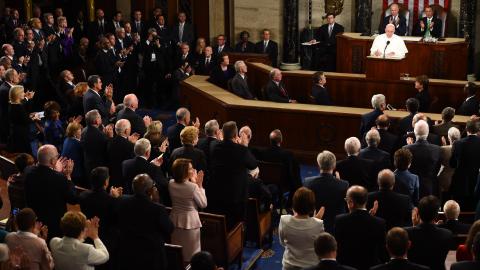
JIM WATSON/AFP via Getty Images
- The newest survey of congressional religious beliefs shows our representatives aren’t quite like us.
- Members of Congress are much more religious and more Christian than the general population.
- The effects of this disconnect are debatable.
The Congress of the United States is much smaller than the national legislatures of other Western Democracies in proportional terms. Each member of The House of Representatives comes from a district of about 700,000 people, and each Senator can claim to speak for an entire state, the smallest of which contains nearly 600,000 people.
Because of the numbers involved, it is probably inevitable that the legislature’s demographics are going to differ from that of the general population. For example, a higher percentage of them are dentists than you might expect looking at the general population.
The various rules and practicalities of office also produce some differences. The typical Senator is 62.9 years old, and the average Representative is 57.6. The median age for Americans is 38. People elected to federal office also tend to have more money than the people they represent.
A new report from Pew reveals that the religious affiliations in Congress also dramatically differ from those of the people they represent. Taken as part of a series of similar reports, it reveals certain trends in Congressional demographics that differ from that of the country as a whole.
A whopping 88 percent of Representatives and Senators are Christians. Breaking this down, 55 percent of them identify as some sort of Protestant, and another 30 percent are Catholic. Mormons make up around 2 percent of the legislature, with Orthodox Christians following at just above 1 percent. This puts them well behind the Jews, which 6 percent of the body identified as.
Behind them came the Buddhist, Hindu, Muslim, Humanist, and Unaffiliated members. Each of these categories amounts to under one percent of Congress by themselves, for a collective total of 12 members.
Eighteen members refused to answer the survey; many of them also refused to answer two years ago—speculation as to why this is and what they actually believe continues elsewhere.
For comparison, only 65 percent of the general public identifies as a Christian. Beyond that, only 20 percent of the population is Catholic, and another 43 percent Protestant. People with no religious affiliation make up another 26 percent. Judaism is three times as common in Congress as it is elsewhere in the country, with only 2 percent of the population identifying as such.
Mormons and Orthodox Christians enjoy nearly propositional representation, as they make up 2 percent and just under 1 percent of the population nationally. The remaining represented religions are in a similar situation. They are under-represented but not nearly as much as the non-religious—Buddhists, Muslims, and Hindus each make up about one percent of the general population. Unitarian Universalists are seated in Congress at the same rate as the aforementioned faiths but are just under one percent of the population.
Some trends emerge in this data. Since 1961, the year this survey was first sent out, the percentage of Christians has fallen, though by far less than the population overall. Like the rest of Protestant America, members of Congress are increasingly likely not to name a denomination, such as Lutheran or Baptist, but to instead identify with the more general term of Protestant.
It is also worth mentioning that there may be more to this topic than these questions can reveal.
Many Jewish people identify as such while also being agnostic or even atheistic. It is possible that the degree of actual belief among some of the members of Congress using the term varies dramatically. Likewise, the one “unaffiliated” member has stated before that they don’t want to be bound by labels, further reducing the usefulness of a survey that tries to label everybody.
In addition to the previously mentioned difficulties of having an entirely representative legislature, some religious groups are still more electable than others.
A recent Gallop poll demonstrates that only about 60 percent of Americans would vote for a qualified atheist and that only a few more would support a similarly capable Muslim. While these numbers have increased over time and differ greatly based on party affiliation, it is probable that many non-Christian potential candidates justify not running on the grounds of these numbers.
Before you point out that these are majorities, that is who is willing to vote for such a person at all, not a list of people who would for sure. You’d probably want better numbers than that unless you’re sure you can get all of them.
It doesn’t necessarily need to mean anything. Representatives of all faiths or lack thereof can govern in a secular manner that doesn’t favor any particular worldview.
The Congressional Freethought Caucus, dedicated to fostering science and reason while defending the secular nature of government, has 14 members. It is, obviously, impossible for all its members to be non-religious. Its members represent a variety of faiths and denominations of Christianity, including humanism, while supporting all people’s rights.
A remaining concern is that the disproportionate representation could lead to specific points of view not being heard. There are no atheists in Congress to articulate their viewpoints on legislation that concerns others like them. This lack of representation is something that can and has been said for other demographic groups both now and at different points in our history.
In any small body representing a larger one, there will be strange demographic mismatches by necessity. In the case of the United States Congress, these differences are rather pronounced. While they may have only a limited effect on legislation, there may be other, less tangible ways that this disconnect causes issues.
Or, it might be nothing more than a statistical curiosity.


