327 – City Maps As A Rorschach Test
This map, showing the surface and population of selected world cities, is outdated by over two decades. It was published in the Dallas Morning News on 9 June 1983, since when the population of Dallas itself, for example, has grown from just over 900,000 to well beyond 1.2 million inhabitants (2007).
Some of the shapes of the cities shown here might be outdated too; as they grow, cities tend to expand into and annex their environs. The tentacularity of London in this map is a good indication of that process – but has itself become obsolete: this shape no longer corresponds with any present-day depiction of the city.
What remains striking about this map, even though we’re talking about populations and surfaces of 25 years ago, are the relative population densities of the cities. Dallas and Houston are comparable to each other in population and both are in the same category, surface-wise, as London and New York. But the population of the latter two cities is roughly 6 to 8 times higher than either Houston or Dallas, indicating that these have a much lower population density. A possible explanation: the automobile (and the flat prairie they were built upon) has allowed both Texan metropolises to sprawl in ways unimaginable just over a century ago, and impossible even today in more constrained surroundings.
The two other European cities depicted here (apart from London, i.e. Amsterdam and Rome) have city centres that are smaller and more densely populated than their American cousins. About equal in size to Rome (and to each other) are Toronto, Montreal and Boston, but they are much less packed with people (2.6 million for Rome, between half a million and 1.2 million for the other cities). Chicago’s sprawl and density puts it somewhere between Dallas and London. DC and San Francisco are special, in that they are very constrained surface-wise (legally in DC’s case, physically by the Bay and the Ocean in San Francisco’s case). This ‘pressure cooker’ circumstance causes their populations to be much denser than in either of the sprawling Texan cities.
All of which is very interesting, but this is not what first drew me to this map. It is interesting in a more primordial, psychologically more revealing way, as a Rorschach inkblot test. That test, as you will recall from any number of treatments of the subject in popular culture, allows an analyst to make deductions about a subject’s personality and emotions by the way he or she interprets the shapes of random inkblots.
The method is still used, but controversial, as suggestibility, bias and other aspects of subjectivity might prevent a valid “reading” of the result. As is best summarised by this classic Rorschach joke:
“A man and a woman making love in a park,” the man replies. The psychiatrist holds up the second picture and asks the man what he sees. “A man and a woman making love in a boat.” He holds up the third picture. “A man and a woman making love at the beach.”
The psychiatrist says, “It looks like you have a preoccupation with sex.” The man replies, “Well, you’re the one with the dirty pictures.”
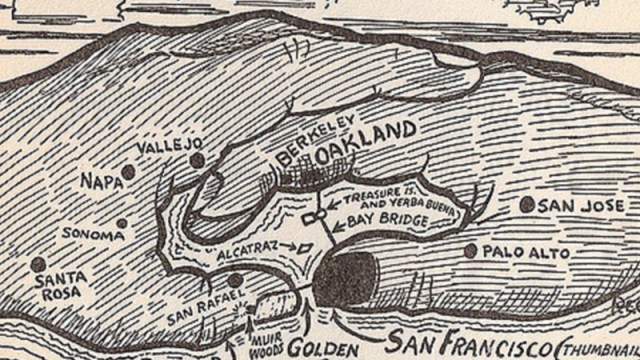
Here’s what my imagination makes of some of the city shapes presented here (feel free to add your own):
Incidentally, Rorschach inkblot tests were named after the Swiss psychoanalyst Hermann Rorschach, who devised the first such test in 1921. Mr Rorschach’s family name derives from an eponymous Swiss town, on the southern shore of Lake Constance. A map of Rorschach unfortunately only demonstrates that it looks like nothing at all…
Many thanks to Robert Allison for providing this link to the map.


