Record-Breaking 3D Map Of The Universe Reveals Some Big Surprises
How quickly is it expanding today, and how does that expansion rate change over time?
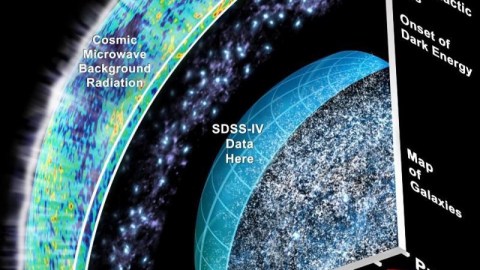
What is the Universe made of? How quickly is it expanding today, and how does that expansion rate change over time? If we could know the answers to these questions, we’d understand both the past history and future fate of our Universe. Yet even with our best measurements of the Universe itself, different methods don’t give the same answer. Measuring the Big Bang’s leftover glow, the cosmic microwave background, gives us one set of answers, while measuring stars, galaxies, and supernovae gives us a different, incompatible answer. The discrepancy is, arguably, the biggest conundrum in modern cosmology.
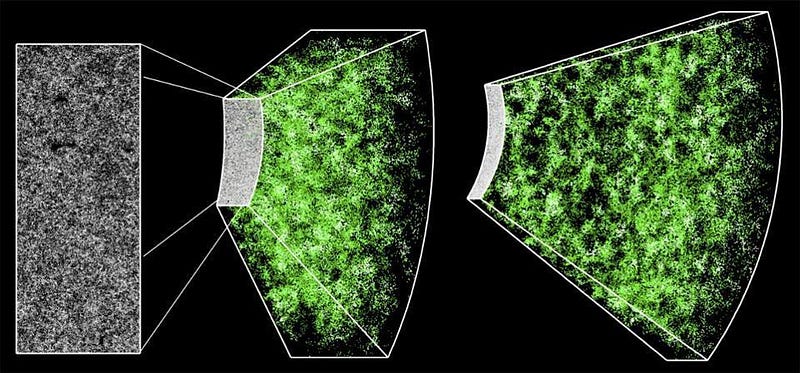
But with more than two decades of data — and a detailed, 3D map of more than 2 million galaxies — the Sloan Digital Sky Survey might help us finally solve this cosmic mystery. These galaxies are spread out over more than 19 billion light-years in all directions, corresponding to more than 11 billion years of cosmic history in our expanding Universe. But what is it made out of? How quickly is it expanding today? What else have we learned, and what comes next for astrophysics? Here’s the remarkable story.
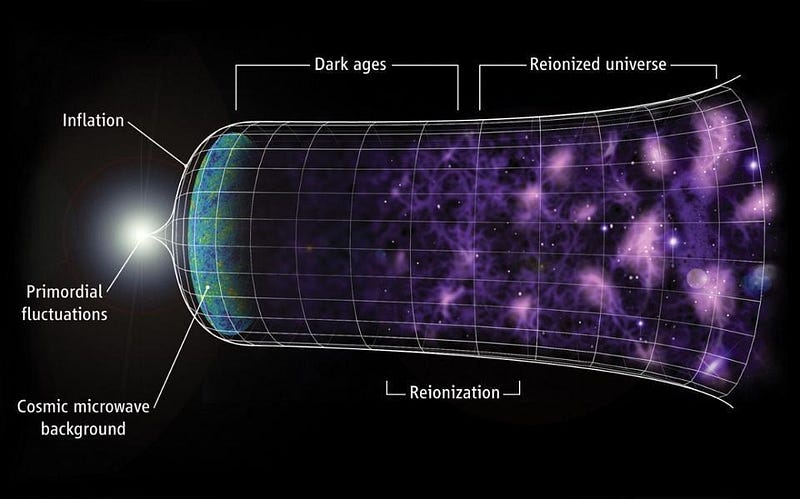
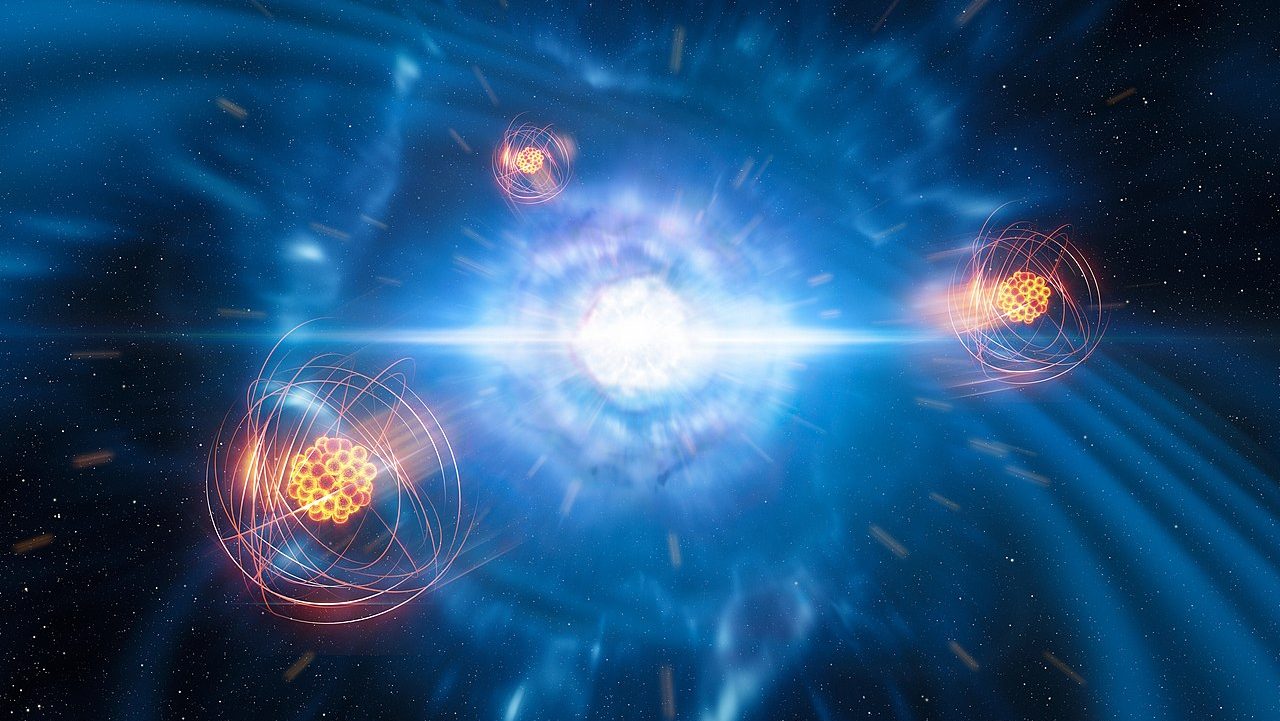
Imagine the Universe, if you can, in the early stages of the hot Big Bang. Over the first few minutes, nuclear fusion can occur between subatomic particles, creating light elements like various isotopes of hydrogen and helium. Over the subsequent years, gravitation works to to pull matter — both normal matter and dark matter — into the regions of greatest density, while radiation pushes back differently on the normal matter (which it interacts with) than the dark matter (which it doesn’t).
This effect, of getting pulled in by gravity but pushed out by other interactions, creates wave-like effects in the density of normal matter. Billions of years later, after the Universe expands and forms stars and galaxies, these waves can still be seen: they’re imprinted in the Universe itself. If you put your finger down on any random galaxy and ask the question, “how likely am I to find another galaxy a certain distance away,” you should actually be able to map out not only the impact of these waves, but you can see how that impact changes as the Universe expands.
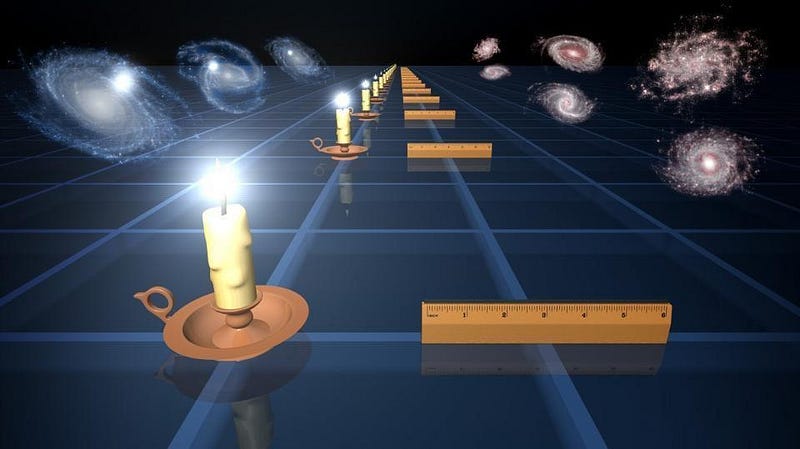
In our nearby Universe, for example, which has been expanding for 13.8 billion years since the Big Bang, we’ve measured how galaxies cluster together. You can imagine starting at a galaxy and setting down an invisible “ruler” to measure the distance between that galaxy and every other galaxy you can find. On average, you’ll discover that:
- you’re likely to find a galaxy close to your own, because gravity is attractive,
- as you move farther away, you’re (gradually) less likely to find another galaxy,
- until you run into that “wave” feature imprinted in the very early Universe.
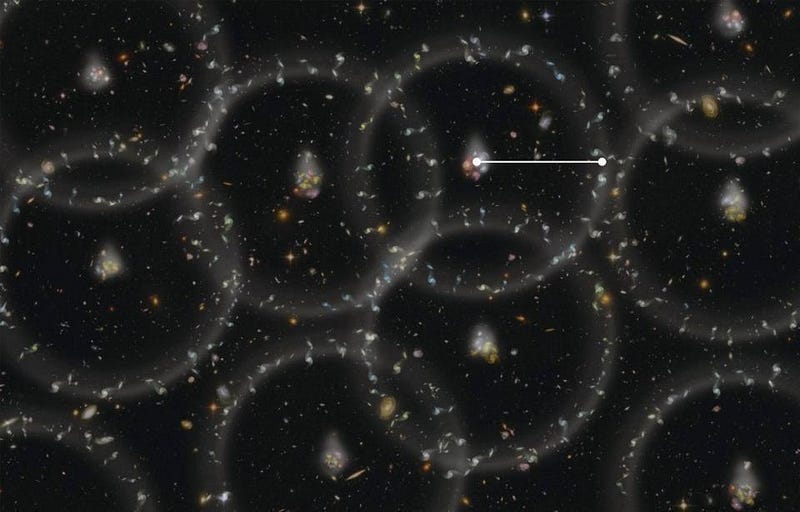
It means that, today, if you drew a smooth curve that represented how likely you’d be to find another galaxy, the wave feature means that you’re actually more likely to find a galaxy that’s 500 million light-years away than you’d anticipate, but less likely to find one 400 million or 600 million light-years away.
This imprint has a name: baryon acoustic oscillations, because it’s the normal matter (baryons) imprinting pressure waves (acoustic oscillations) on the large-scale structure of the Universe.
It’s one thing to calculate the effect, which we can do from a theoretical perspective. It’s another thing to measure the effect nearby, which the Sloan Digital Sky Survey has been doing since it began science operations in 1998. But it’s a giant leap to measure it all throughout the Universe, over the majority of our cosmic history, which is what the latest release has just accomplished.
The reason is simple: the size of the acoustic scale stretches to be longer and longer as the Universe expands.
In other words, if you can map out the galaxies in the Universe not just nearby, but far away as well, you can measure how the Universe has expanded over time. There are a lot of challenges that get in the way, including:
- it’s harder to see distant galaxies because they’re fainter,
- it’s harder to resolve individual galaxies that are close to one another,
- it’s hard to map out distance in the third (depth) dimension,
- and that other effects can come into play, biasing our conclusions.
A simple example of bias can be seen just by looking at the closest galaxy cluster to Earth: the Virgo cluster.
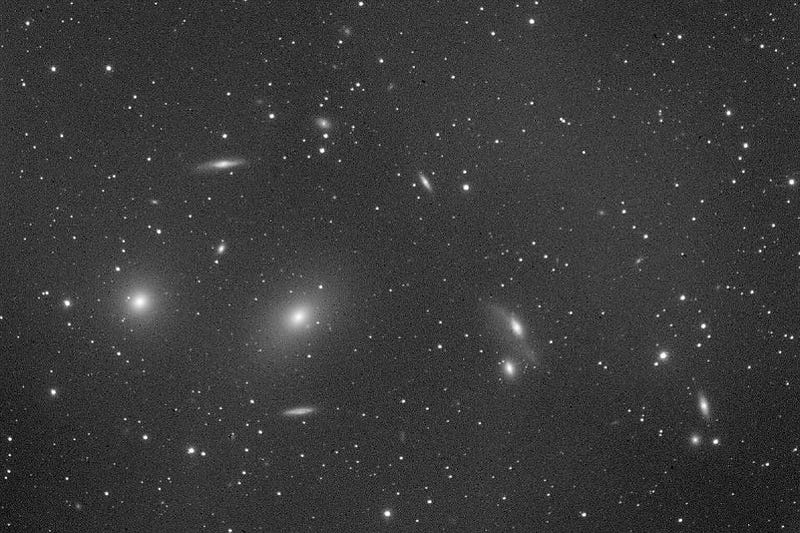
The Virgo cluster is a large collection of galaxies — more than 1,000 of them — that’s located between about 50 and 60 million light-years away. There are few measurements we can take to help us understand how distant a galaxy is: we can measure its brightness, we can measure its apparent size, and we can measure its redshift. The redshift measurement is an important component, since it tells us how fast this object appears to be receding from us, an important component of understanding how the Universe has expanded.
But there are two causes for the redshift of any particular galaxy: the large-scale cosmic expansion, which affects all galaxies equally, and the effects of gravitation. When you have a large collection of mass, like a galaxy cluster, it causes the individual galaxies within it to move around very quickly, including along our line-of-sight direction. Astronomers call this peculiar motion, which gets superimposed atop the expanding Universe. If we were to plot out where galaxies are and ignored this effect, we’d see that their inferred positions were incorrect.
The first plots, in fact, that saw this effect led to a very catchy name for these redshift-space distortions: Fingers of God.
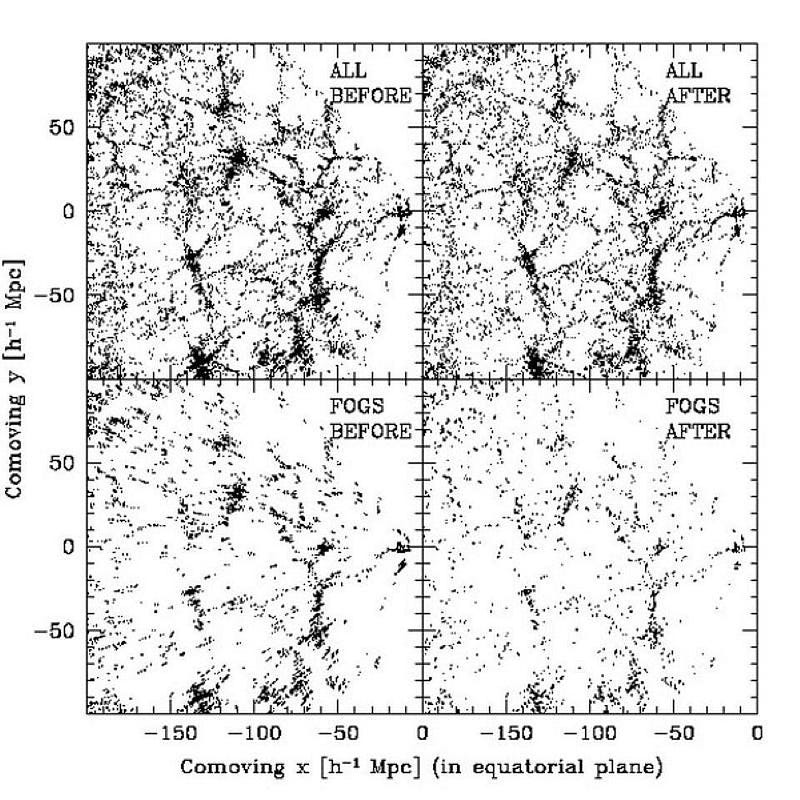
But with a good enough understanding of the Universe, we can correct for this effect, and transform our maps from “redshift space,” which is biased, to “real space,” where that bias is removed. The latest results from the Sloan Digital Sky Survey not only utilize an unprecedentedly large number of galaxies over the largest distance span ever, they also employ the full suite of corrections that we know how to make in modern cosmology. We can be more confident than ever before that the Universe, as we’re seeing it, is a reflection of how it actually is.
As far as data goes, we’ve never had anything like this before. Within the most recent 2 billion years, we have light from nearby galaxies, mapped during the first decade of the Sloan Digital Sky Survey (1998–2008). Beyond that, we have old red galaxies that take us out from 2 to 7 billion years in the past. Beyond that, there are young blue galaxies from 6-to-8 billion years ago, with quasars extending from about 7 billion years ago all the way to 11 billion years ago. Even beyond that, from 11 billion years to just over 12 billion years ago, we have a sample of galaxies that emits light from its hydrogen atoms, which take us to earlier times than ever as far as structure formation is concerned.
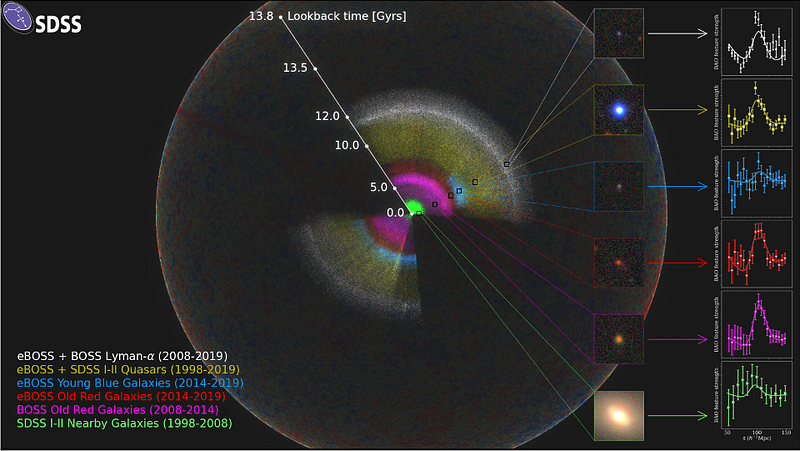
According to Will Percival, the Survey Scientist for the extended Baryon Oscillation Spectroscopic Survey (eBOSS) project, “Taken together, detailed analyses of the eBOSS map and the earlier SDSS experiments have now provided the most accurate expansion history measurements over the widest-ever range of cosmic time. These studies allow us to connect all these measurements into a complete story of the expansion of the Universe.”
And yet, the story that we learn is comforting in many ways — as it confirms, independently, a number of things we thought were true — but it sheds a surprising light on many aspects of the Universe.
The non-surprising results are extremely important. For one, they found that dark energy is incredibly consistent with a cosmological constant: there’s no good evidence that it evolves with time or varies through space. Its energy density remains constant over time. Another exciting confirmation is that the Universe is incredibly spatially flat: its maximum allowable curvature is just 0.2% of the critical density, a constraint that’s 20 times stronger than last year’s controversial claim that the Universe might be closed instead of flat.
There are other unsurprising results that represent incremental improvements in our understanding as well. We still haven’t seen an imprint of neutrinos in the large-scale structure of the Universe, constraining their total mass (of the electron, muon, and tau neutrinos combined) to be less than 0.11 eV, meaning that the electron must be at least 4.6 million times heavier than all three neutrino masses combined. They find a Universe that’s 70% dark energy and 30% total matter (normal matter and dark matter combined), with an uncertainty of only ~1% on both figures.
But the biggest surprising result comes from the attempt to measure the expansion rate of the Universe. Remember, there’s an enormous controversy over this, as teams that measure the distances to objects individually (known as the “distance ladder” method) consistently get values of 72–75 km/s/Mpc, but teams that use the Cosmic Microwave Background consistently get values between 66–68 km/s/Mpc.
Without appealing to either of those other two data sets, the best results from this latest study yield an expansion rate of 68.2 km/s/Mpc, robustly requiring a Universe with dark energy.
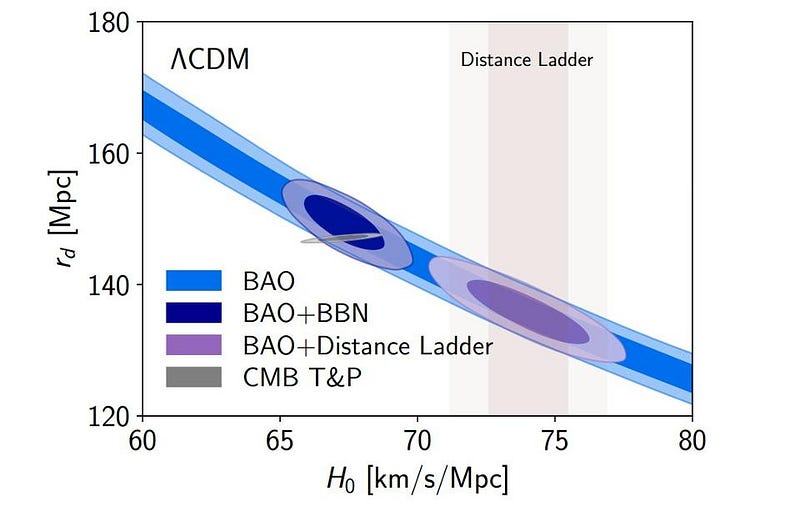
But there’s a catch. You have to provide a value, at some point, that answers the question of “how big was the Universe at this particular time?” You can do that exquisitely with data from the Cosmic Microwave Background, which is the narrow grey ellipsoid on the above graph. But doing so would defeat the purpose of having an independent data set, just as using the “distance ladder” ellipsoid (in purple) would defeat having an independent data set.
That’s why the team used data from BBN: Big Bang Nucleosynthesis. By measuring the abundances of various hydrogen and helium isotopes created shortly after the Big Bang, we can get a constraint for the expansion rate that doesn’t depend on anyone else’s measurements for it. Even though there remains some wiggle-room, it’s very clear that this data favors the lower expansion rate from the Cosmic Microwave Background. This doesn’t solve our cosmic conundrum over how fast the Universe is expanding, but deepens it, adding a remarkable new data set into the camp favoring a lower rate for its value.
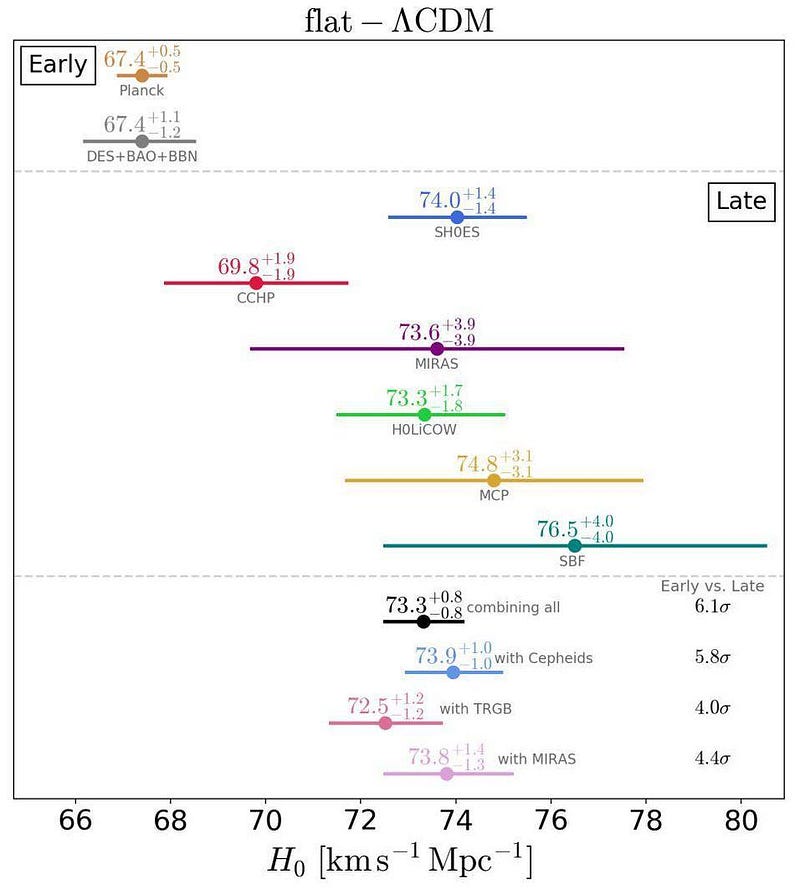
The Universe is not curved on the largest scales, but is spatially flat to 499 parts in 500: the tightest constraint ever. The Universe not only needs dark energy, but it makes up 70% of the Universe and is perfectly consistent with a cosmological constant. Of the other 30%, 25% is dark matter and just 5% is normal matter, with the Universe expanding at 68.2 km/s/Mpc. This is based on over 2 million galaxies observed from nearby to in excess of 19 billion light-years away, corresponding to more than 11 billion years of cosmic history.
In the coming years, the Dark Energy Spectroscopic Instrument (DESI) will take us to tens of millions of galaxies, with even greater advances coming with the launch of ESA’s Euclid, NASA’s WFIRST, and the NSF’s ground-based Vera Rubin Observatory. There are now three major players in the quest to measure the expansion of the Universe: the Cosmic Microwave Background, the cosmic distance ladder, and the imprint of acoustic oscillations in the Universe’s large-scale structure. The first and third methods agree with each other, but not with the second. Until we figure out why, along with the puzzles of dark matter and dark energy, this will remain one of the most compelling mysteries about the very nature of our cosmos.
Ethan Siegel is the author of Beyond the Galaxy and Treknology. You can pre-order his third book, currently in development: the Encyclopaedia Cosmologica.
