How one decision can create “a new self” From Copernicus to Flatland, Yale philosopher L.A. Paul shares examples of transformative experiences, and how participating in them changes more...
This planet-wide analysis, using data from NASA's Black Marble, shows which portions of the planets have brightened (in gold) and dimmed (in blue) over the time period from 2014-2022. While a few notable areas in northwest Europe and in central/south America have dimmed, the overall radiance change has been a 34% increase in artificial lighting at night over this nearly 9-year time period.
Back in the 19th century, the night sky from all locations on Earth was pretty much as it had been since prehistoric times: pristine, free from both artificial light pollution and human-made satellites.
Beginning with the rise of electrification, light pollution has severely dimmed our view of the heavens, particularly with the rise of LED lighting, while artificial satellites often outshine the sky’s natural wonders.
In a new study of the artificial light at night, changes from 2014-2022 across the globe were tracked, showing just how much of the sky humans have been losing. The problem is worse than nearly anyone realizes.
An astrophysics column on big questions and our universe.
Most of humanity, historically, experienced pristine night skies.
Although extended objects, like the plane of the Milky Way and a few distant galaxies beyond our own, are identifiable with the naked eye, there are only a few thousand stars that can be seen and resolved with the naked eye. Depending on your eyesight and the darkness conditions, most humans can see between 6000 and 9000 stars if you could see the entire sky at once.
Without electrified, artificial lighting, all of the night’s brightness was extraterrestrial.
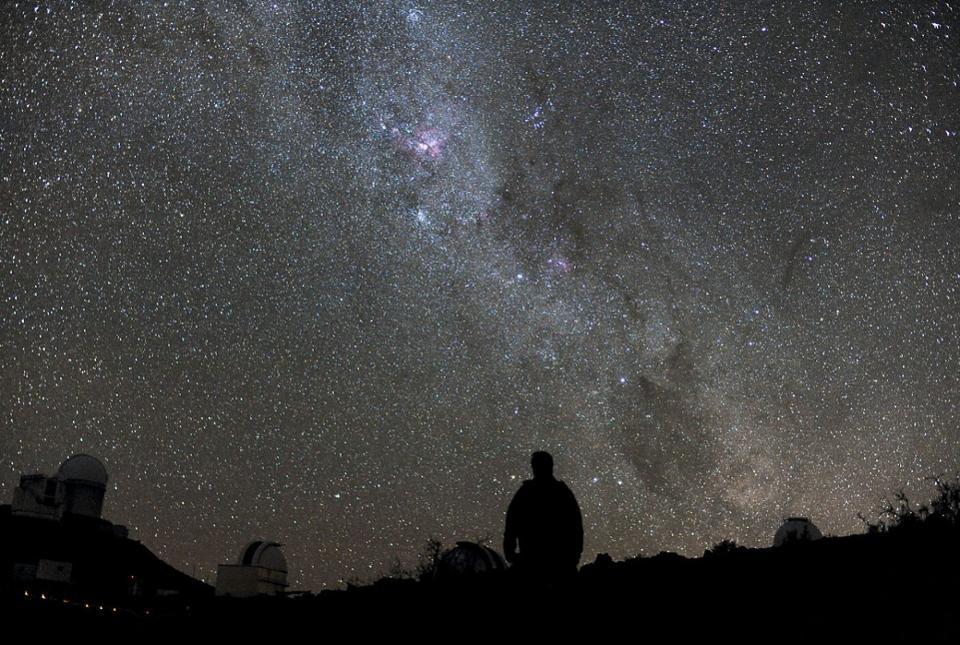
Behind the dome of a series of European Southern Observatory telescopes, the Milky Way towers in the southern skies, flanked by the Large and Small Magellanic Clouds, at right. Although there are several thousand stars and the plane of the Milky Way all visible to human eyes, there are only four galaxies beyond our own that the typical unaided human eye can detect. We did not know they were located outside of the Milky Way until the 1920s: after Einstein’s general relativity had already superseded Newtonian gravity. Today, this view helps us appreciate the awe and wonder that the Universe, and the cosmic story, holds for each of us.
Between 6000-9000 stars, cumulatively, appeared to the naked human eye nightly.
The Milky Way and planet Jupiter shine brilliantly in this photo from the top of Mauna Kea. The yellow glow are the lights from the city of Hilo, located about 25 miles (40 km) away from the mountaintop summit. If not for the effects of light pollution and satellites, humans would be able to see the same pristine views of the Universe that our hominid ancestors saw from millions of years ago up until the advent of gas lighting in the late 1700s and electrification some 100+ years later.
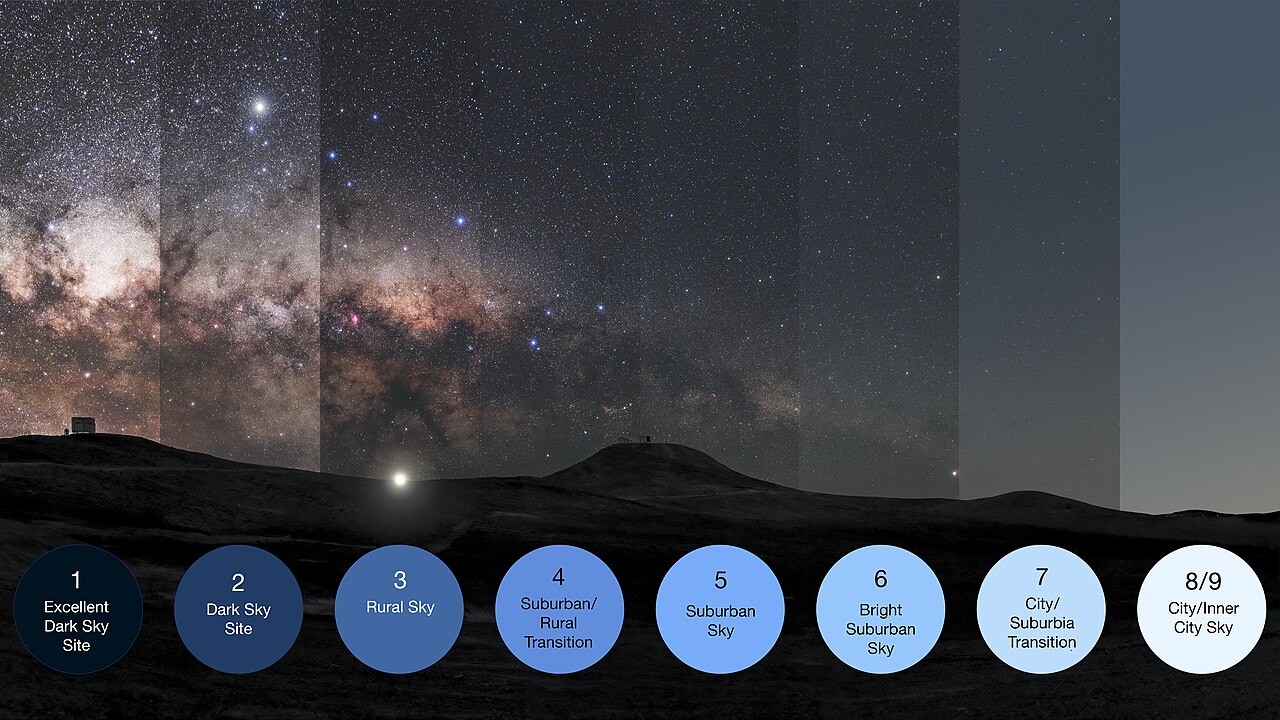
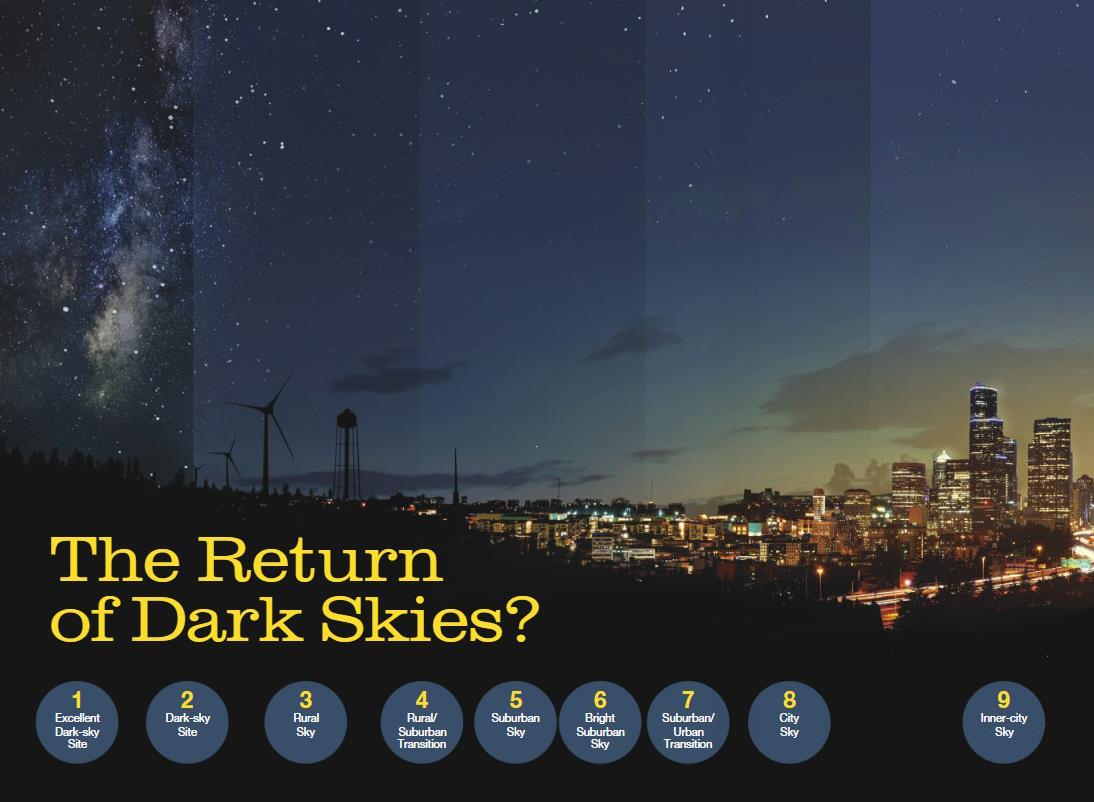
Under a pristine night sky, the Milky Way’s center casts shadows. As light pollution worsens, nebulosity and stars disappear, until maybe a few dozen stars remain. The numbers 1 through 9 are the Bortle scale, which provides observers with a metric to measure the darkness and clarity of the sky overhead at their location. Only a few locations remain on Earth with pristine, dark skies. A full Moon, by itself, can provide brightness equivalent to a 7 or 8 on this scale.
This map of the world depicts light pollution as a function of geographic location. Every location with a yellow-or-brighter coloring has more brightness coming from the ground than the natural sky, highlighting the severity of light pollution across the world, particularly in Europe, Asia, and the Americas. Fewer than 20% of global inhabitants can see the Milky Way at all at night from where they reside.
Credit: Falchi et al., Science Advances, including Dan Duriscoe/NPS; Bob Meadows/NPS; Jakob Grothe/NPS contractor, and Matthew Price/CIRES and CU-Boulder
As a result, fewer stars, nebulae, and natural features are routinely visible.
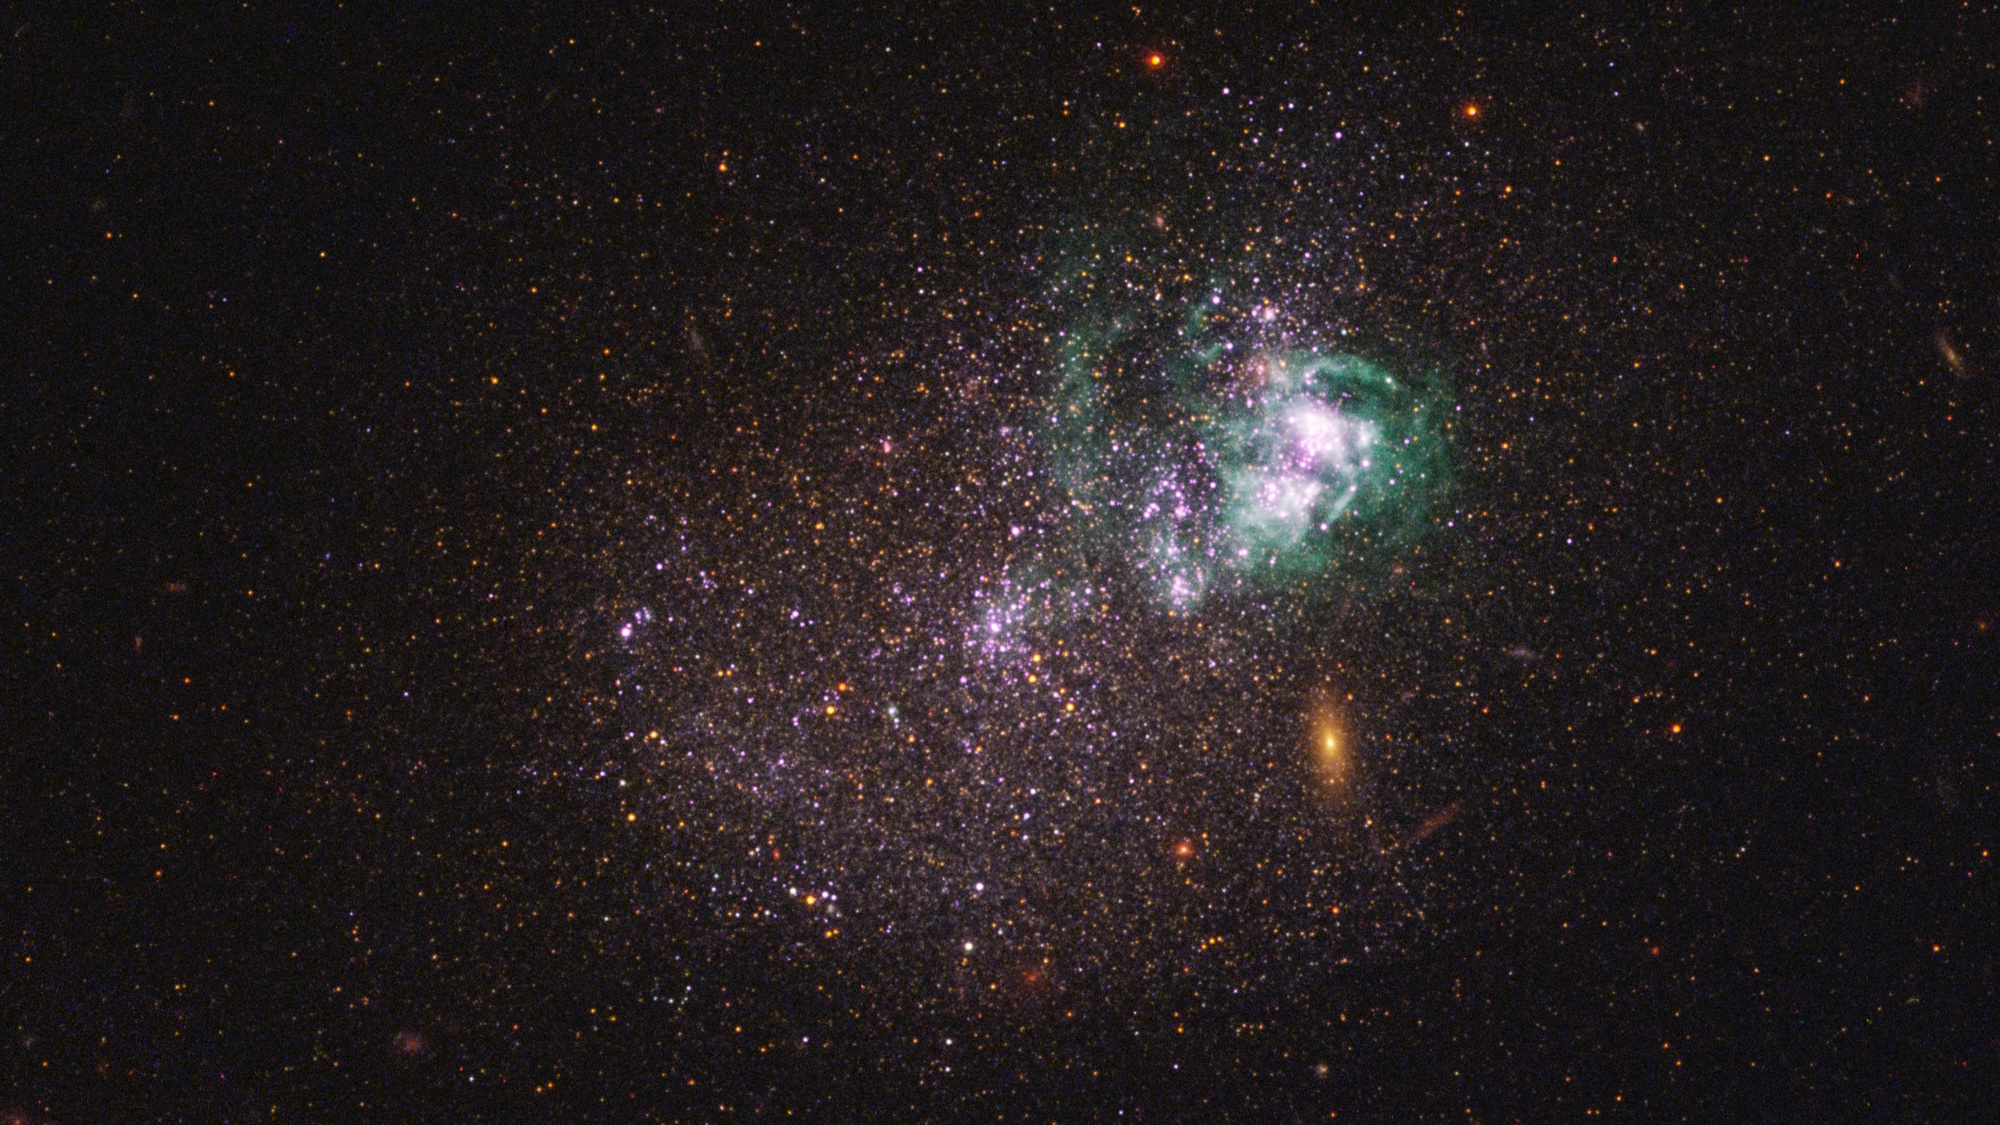
This animation changes between two 30-second exposure images taken with the same camera from a protected dark-sky site (at the summit of La Palma, dark) and from a typical modern rural sky (in Washington State near Mt. St. Helens, blue). The difference between the two images, as well as the difference in total sky brightness, is profound.
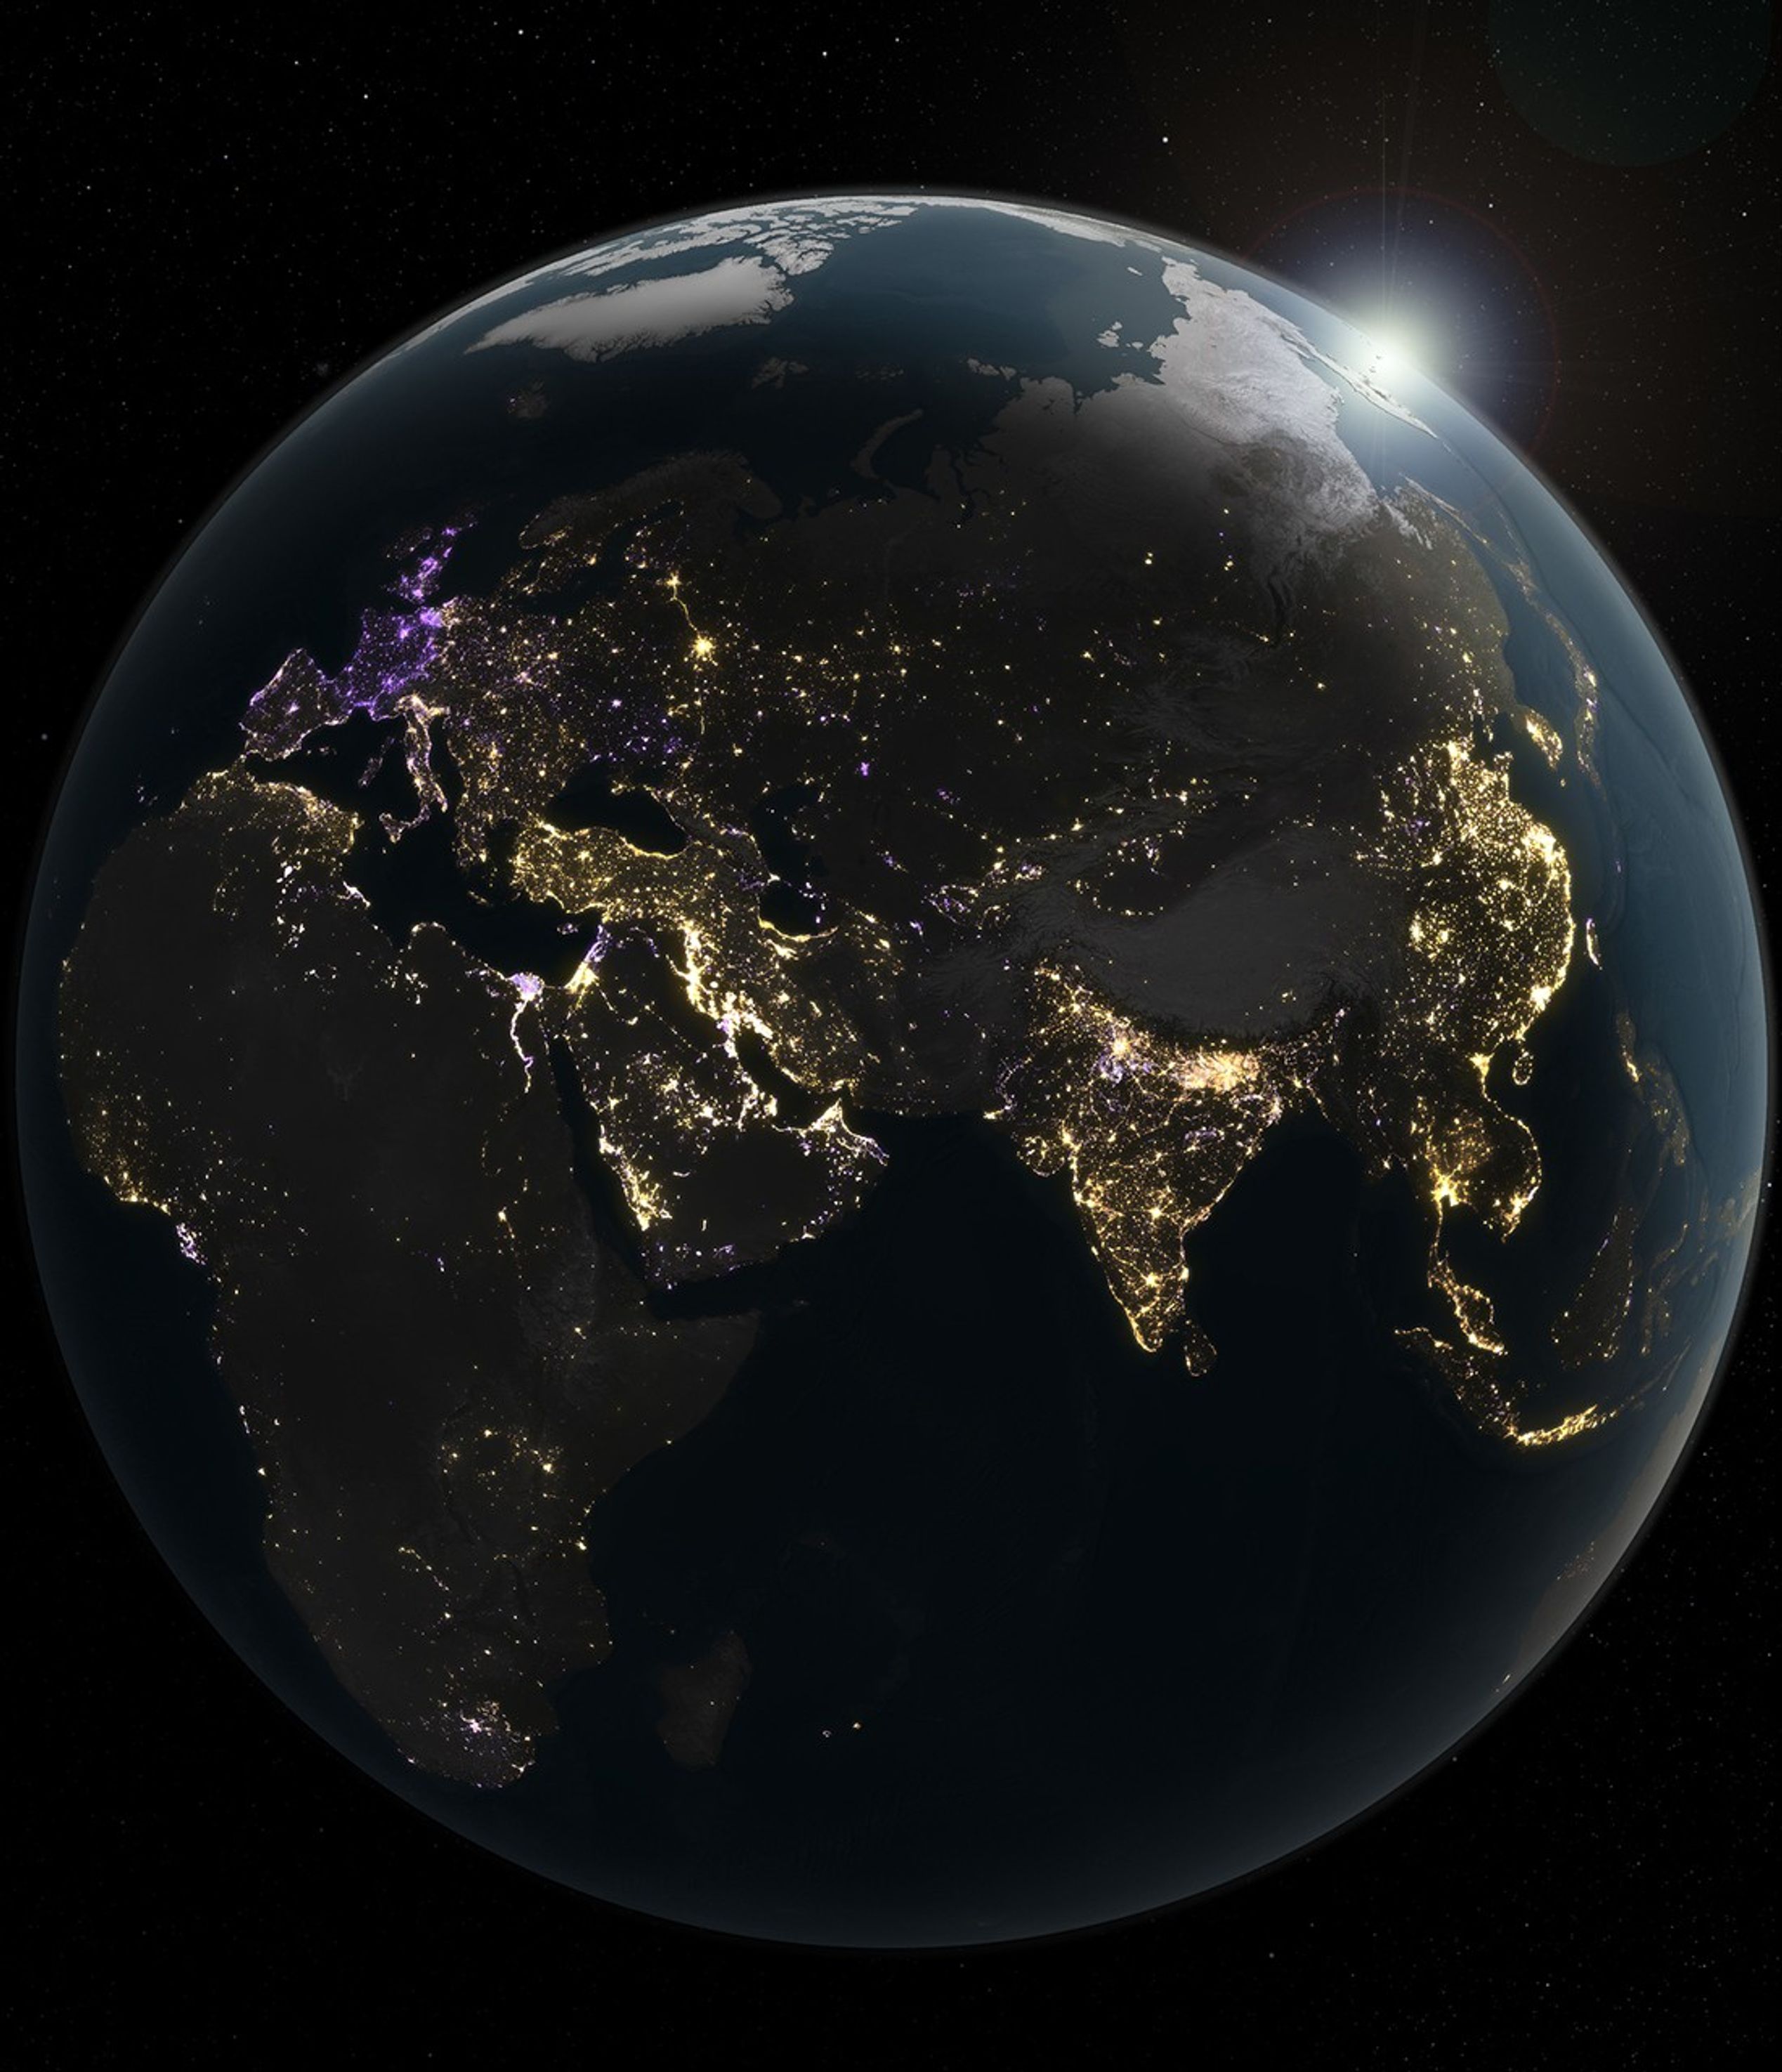
This view of the Earth at night, acquired aboard the Artemis II mission, shows the tremendous effects of global light pollution in a way that none of the Apollo missions ever could. The widespread electrification of the Earth at night, especially since the rise of LED lighting, has led to the greatest-ever levels of global light pollution in history. The locations of cities can be identified even from tens of thousands of kilometers away in space.
An analysis of nearly a decade of nighttime lights data (2014-2022) from NASA’s Black Marble product revealed areas of brightening (gold) and dimming (purple) shown here across the Eastern Hemisphere. China, southeast Asia, India, and the Middle East, as well as Northern Africa and Eastern Europe, have experienced the greatest amounts of brightening from 2014-2022.
This animation focuses on North and South America, as viewed from space at night as part of NASA’s “black marble” program, which illustrates just how severely the artificial lighting at night (ALAN) has changed from 2014-2022. Only a few select areas in South America, plus Cuba, Puerto Rico, and Central America have gotten dimmer with time, while many places, concentrated largely in Florida, Texas, California, Mexico, and the coast of South America, have led to a net increase in artificial luminance at night.
Credit: K. Elkins & M. Garrison; data: T. Li & Z. Zhu
This animation shows the continents of Europe, Africa, and most of Asia on a rotating globe, showing the change in artificial light at night (ALAN) from 2014-2022. Nearly all regions that show up brightly represent regions where the total artificial lighting has increased, with only a few small regions in blue (concentrated in France, Belgium, and parts of the UK and Ukraine) representing regions where the cumulative brightness has decreased.
Credit: K. Elkins & M. Garrison; data: T. Li & Z. Zhu
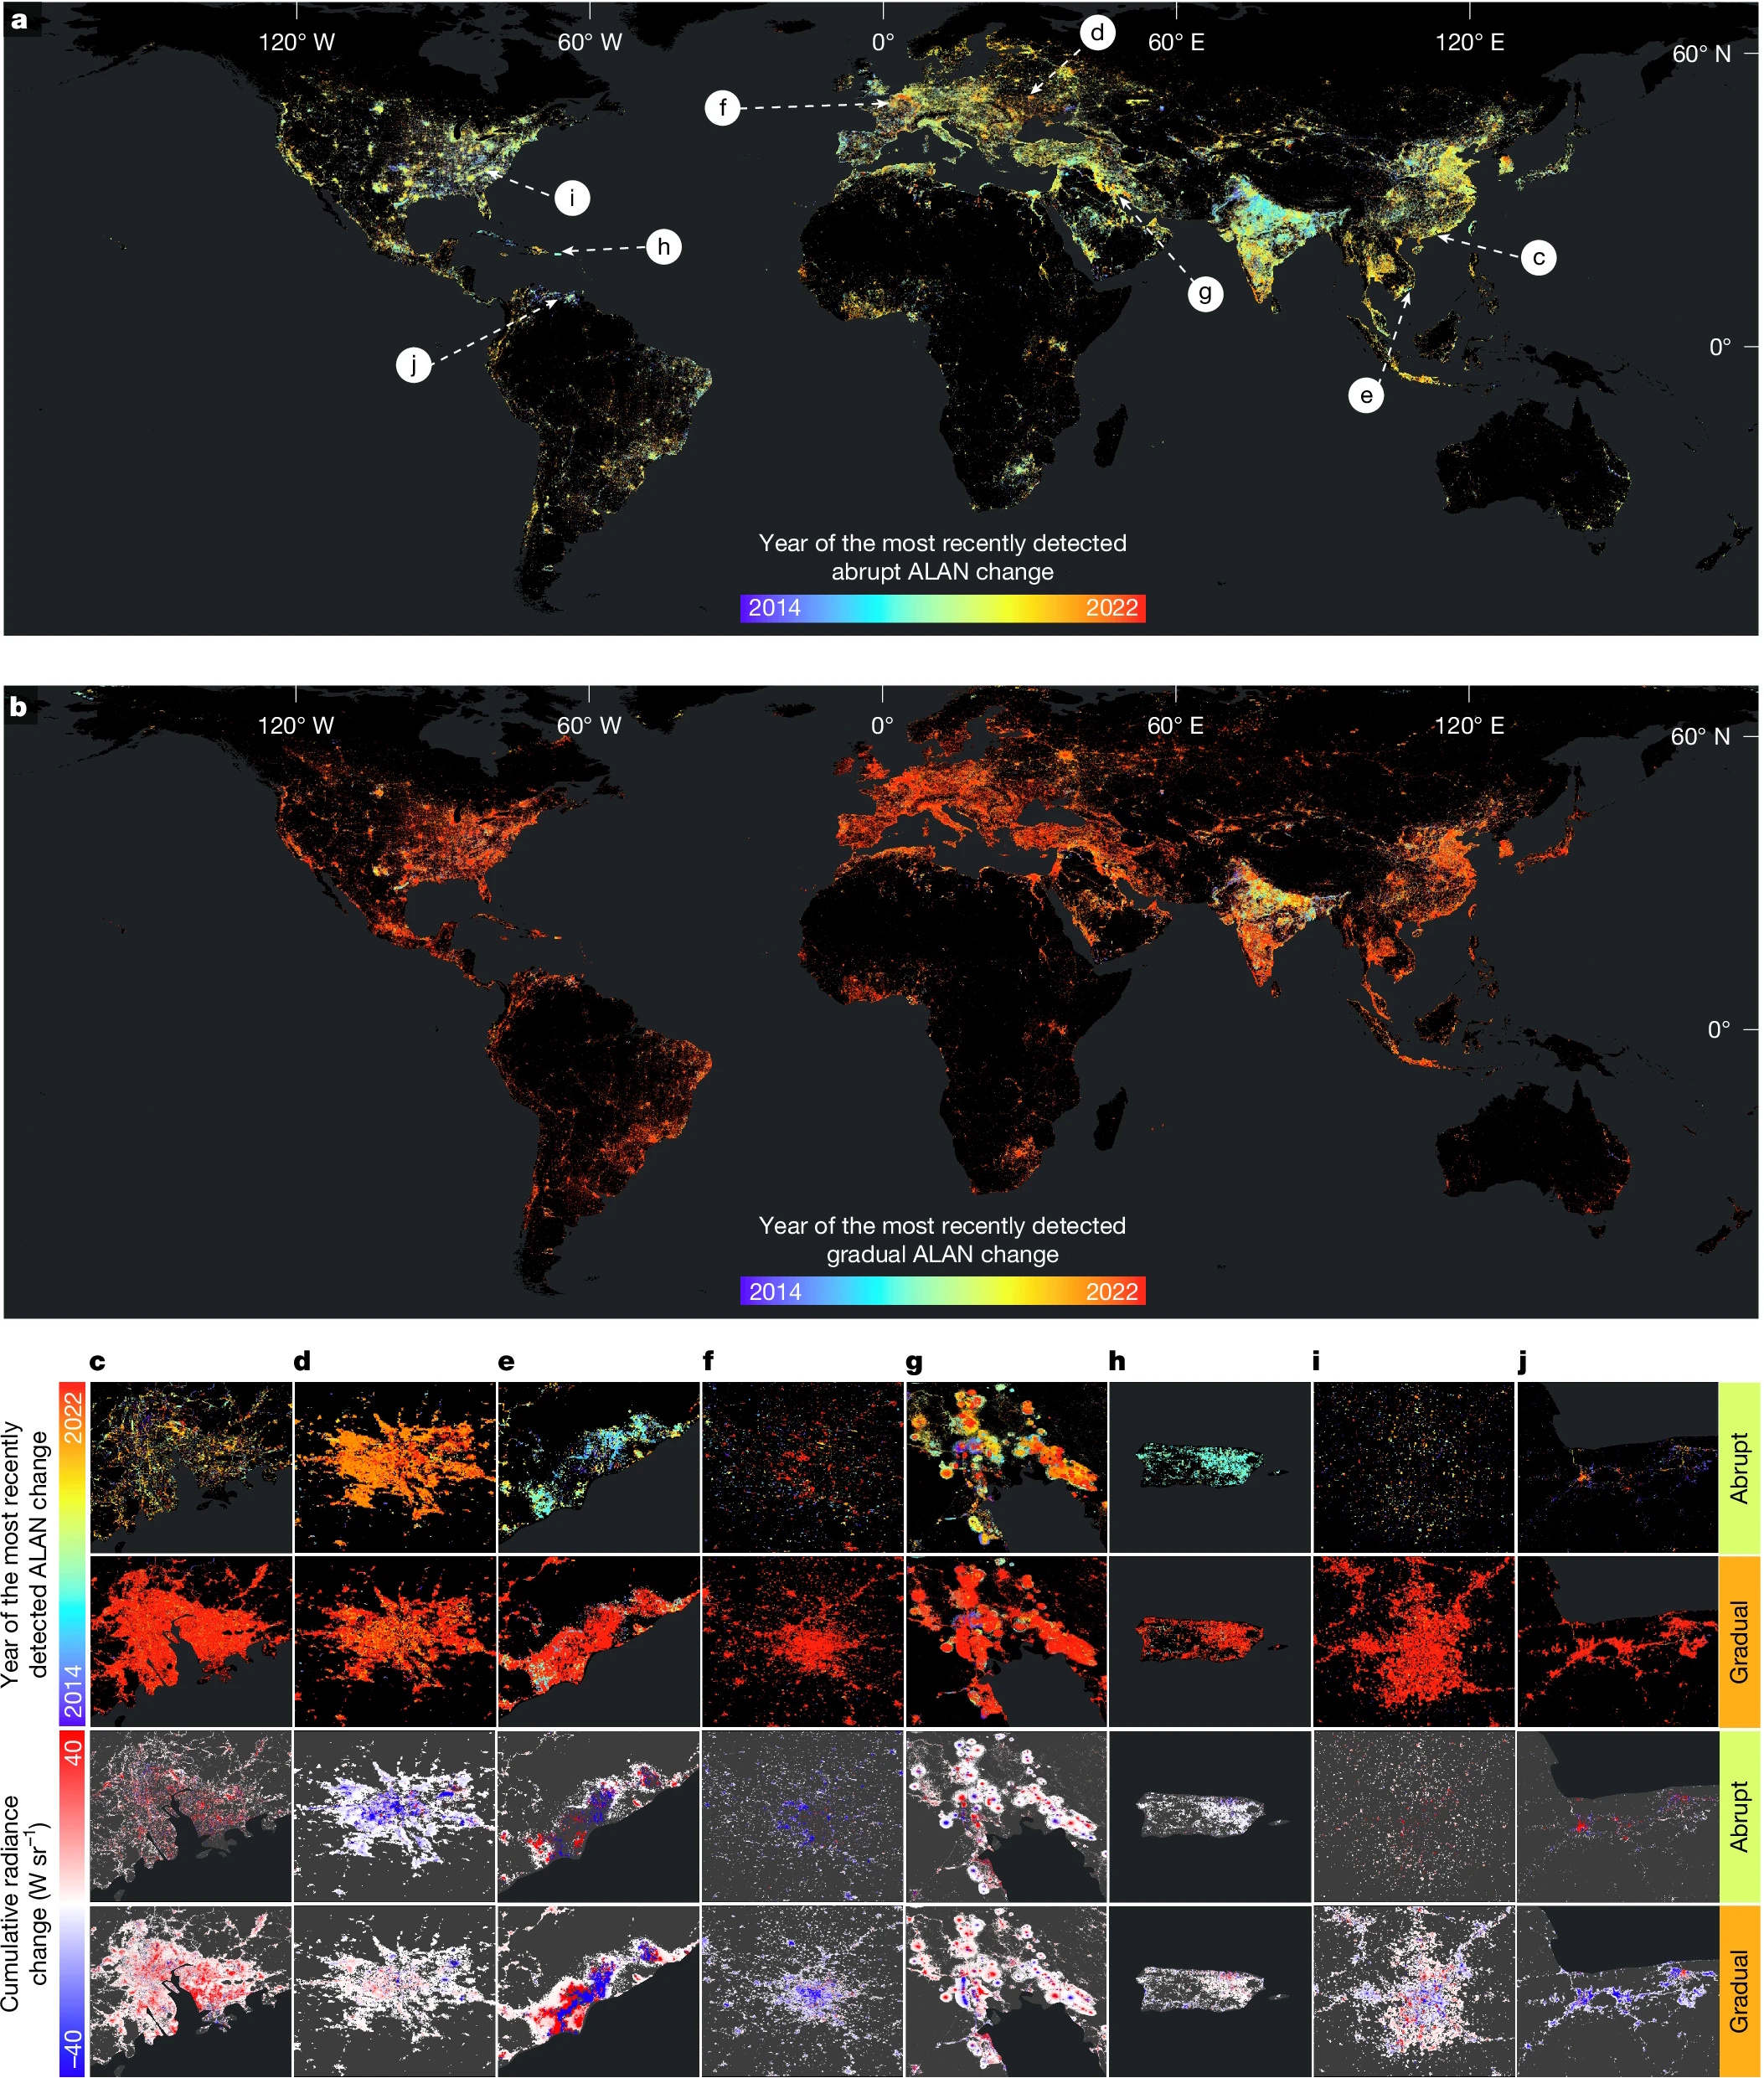
These maps show the accumulated change in artificial lighting at night (ALAN) for abrupt changes (top), the cumulative changes in ALAN from 2014-2022 that show nearly all of the world, cumulatively, has experienced brightening over that time (middle), and a few zoomed-in regions showing both gradual and abrupt brightening. Red is color coded as brighter, while blue is dimmer, in all diagrams.
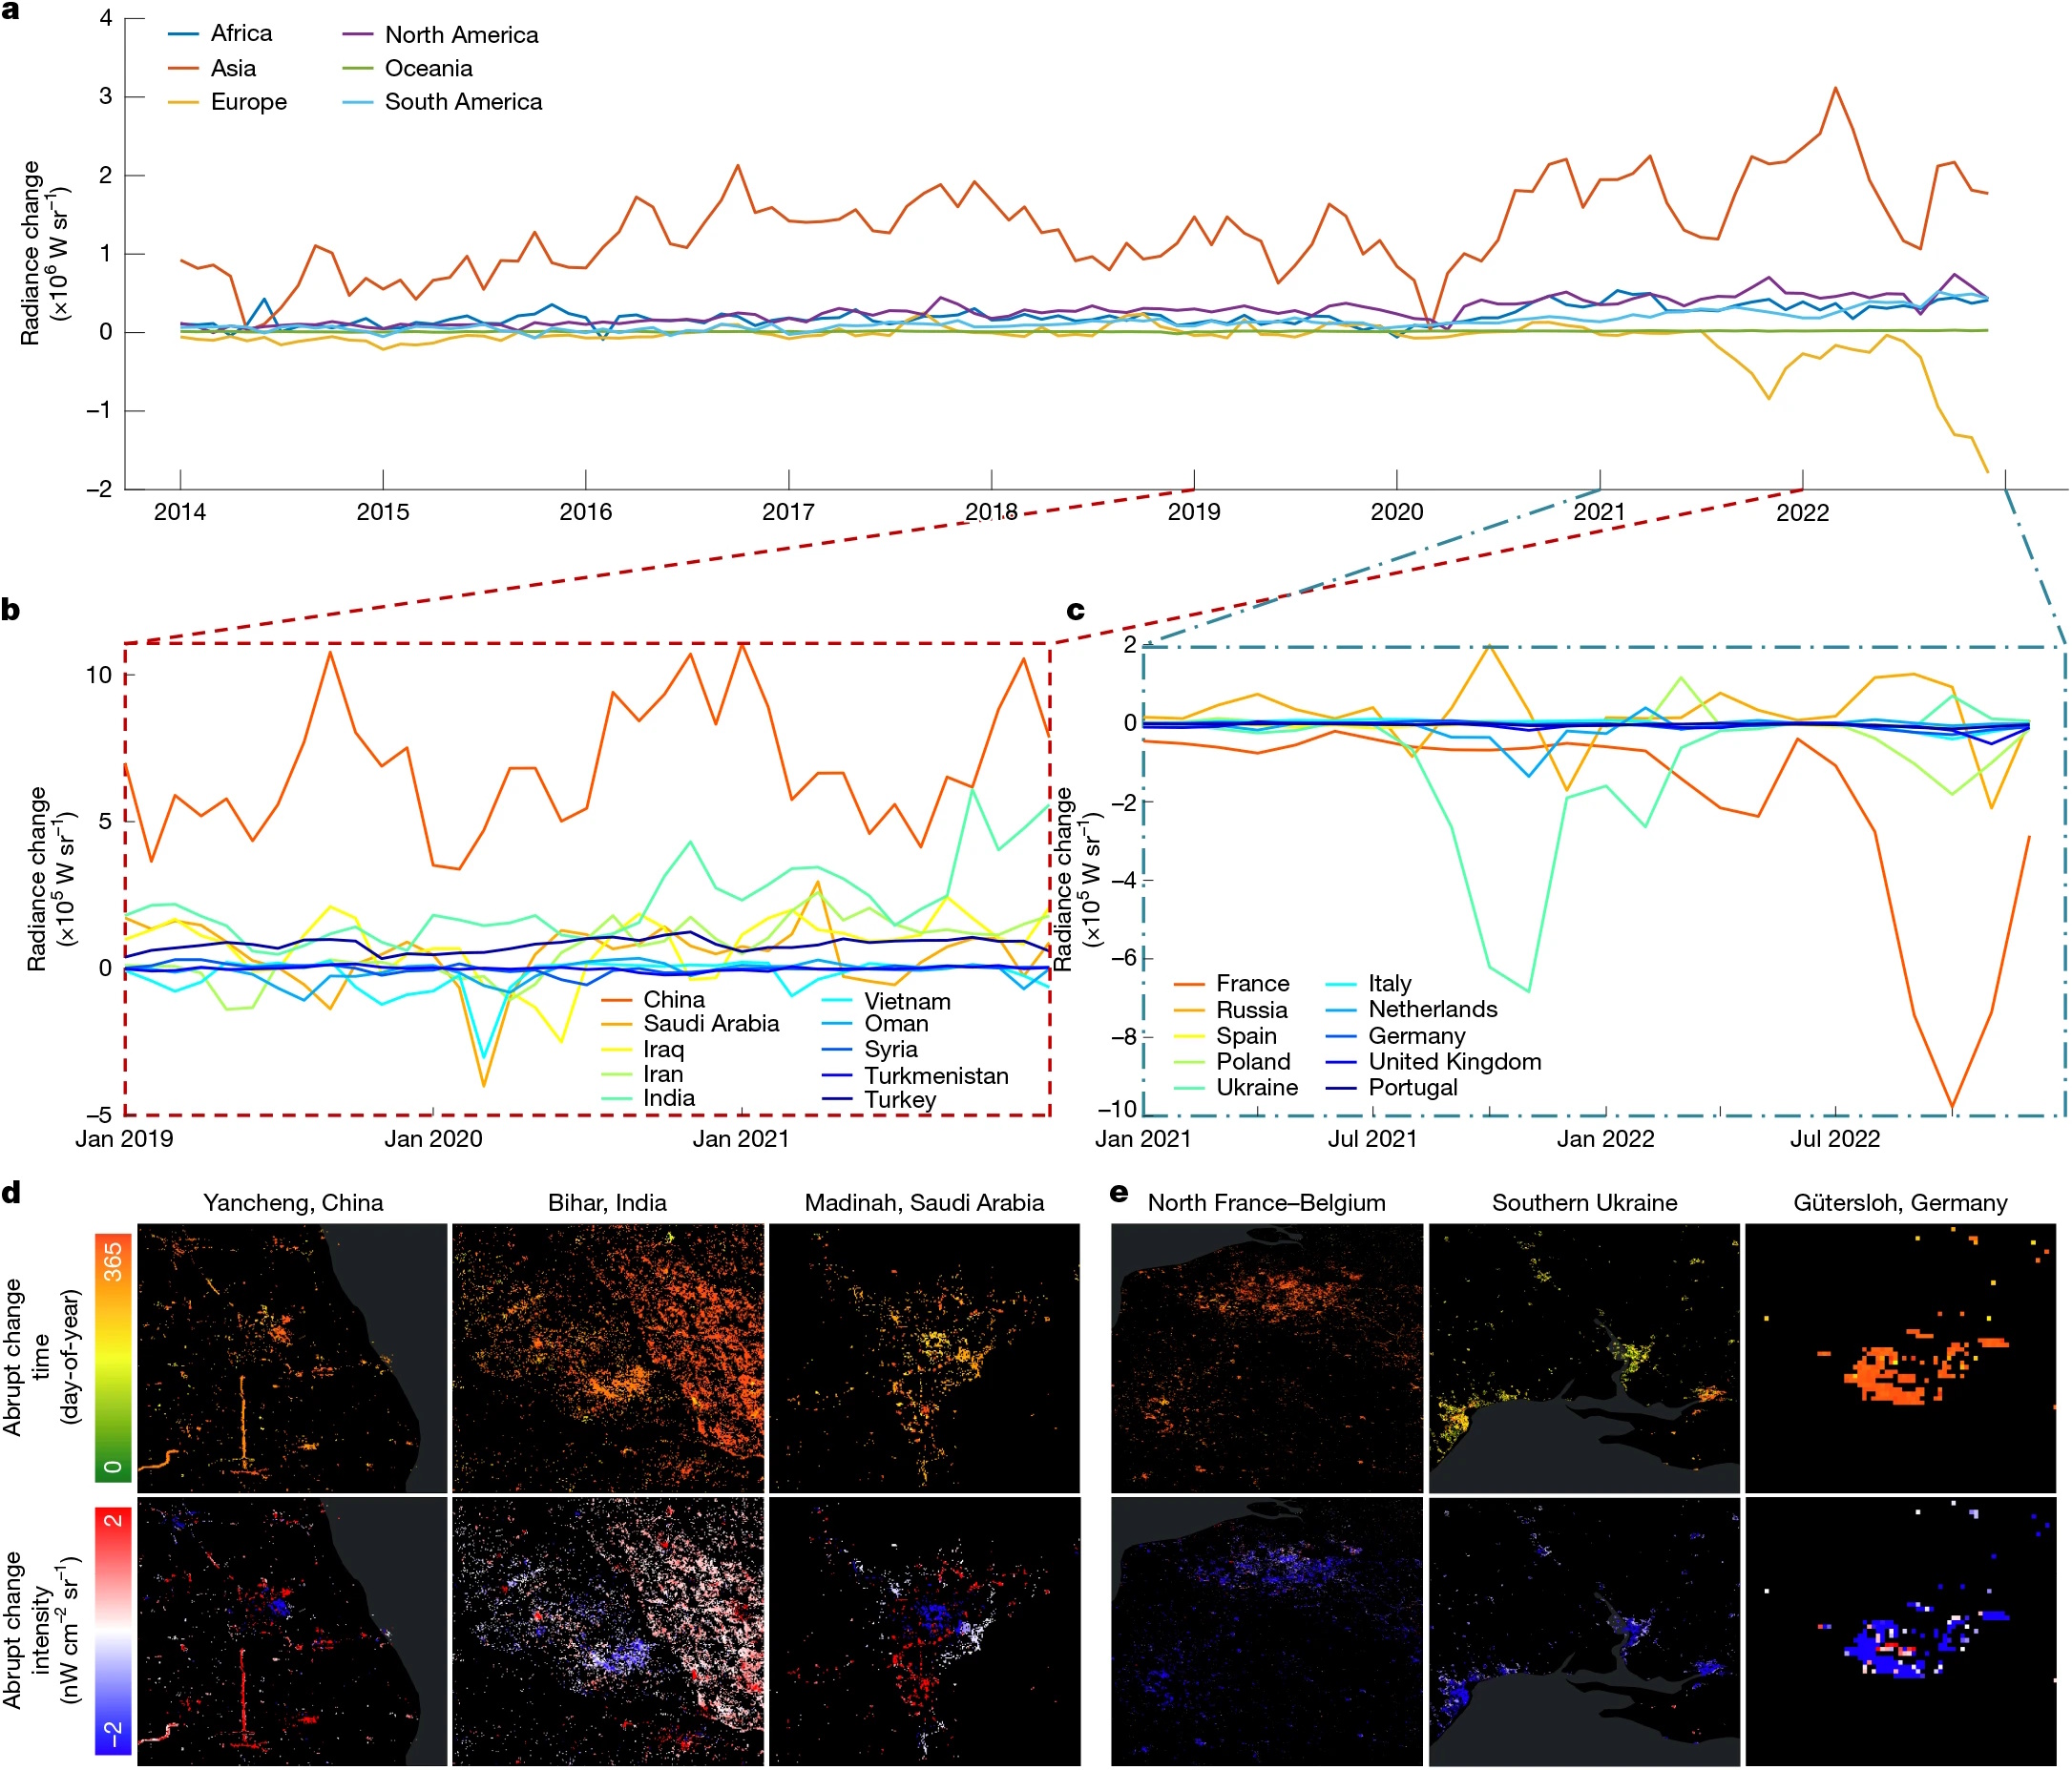
From 2014-2022, most places in the world have experienced an overall brightening as measured from space at night. Asia’s light pollution has grown by the most, whereas in Europe it has grown by the least. France’s and Belgium’s light pollution dropped due to planning, whereas Ukraine’s earlier dimming occurred due to the war with Russia.
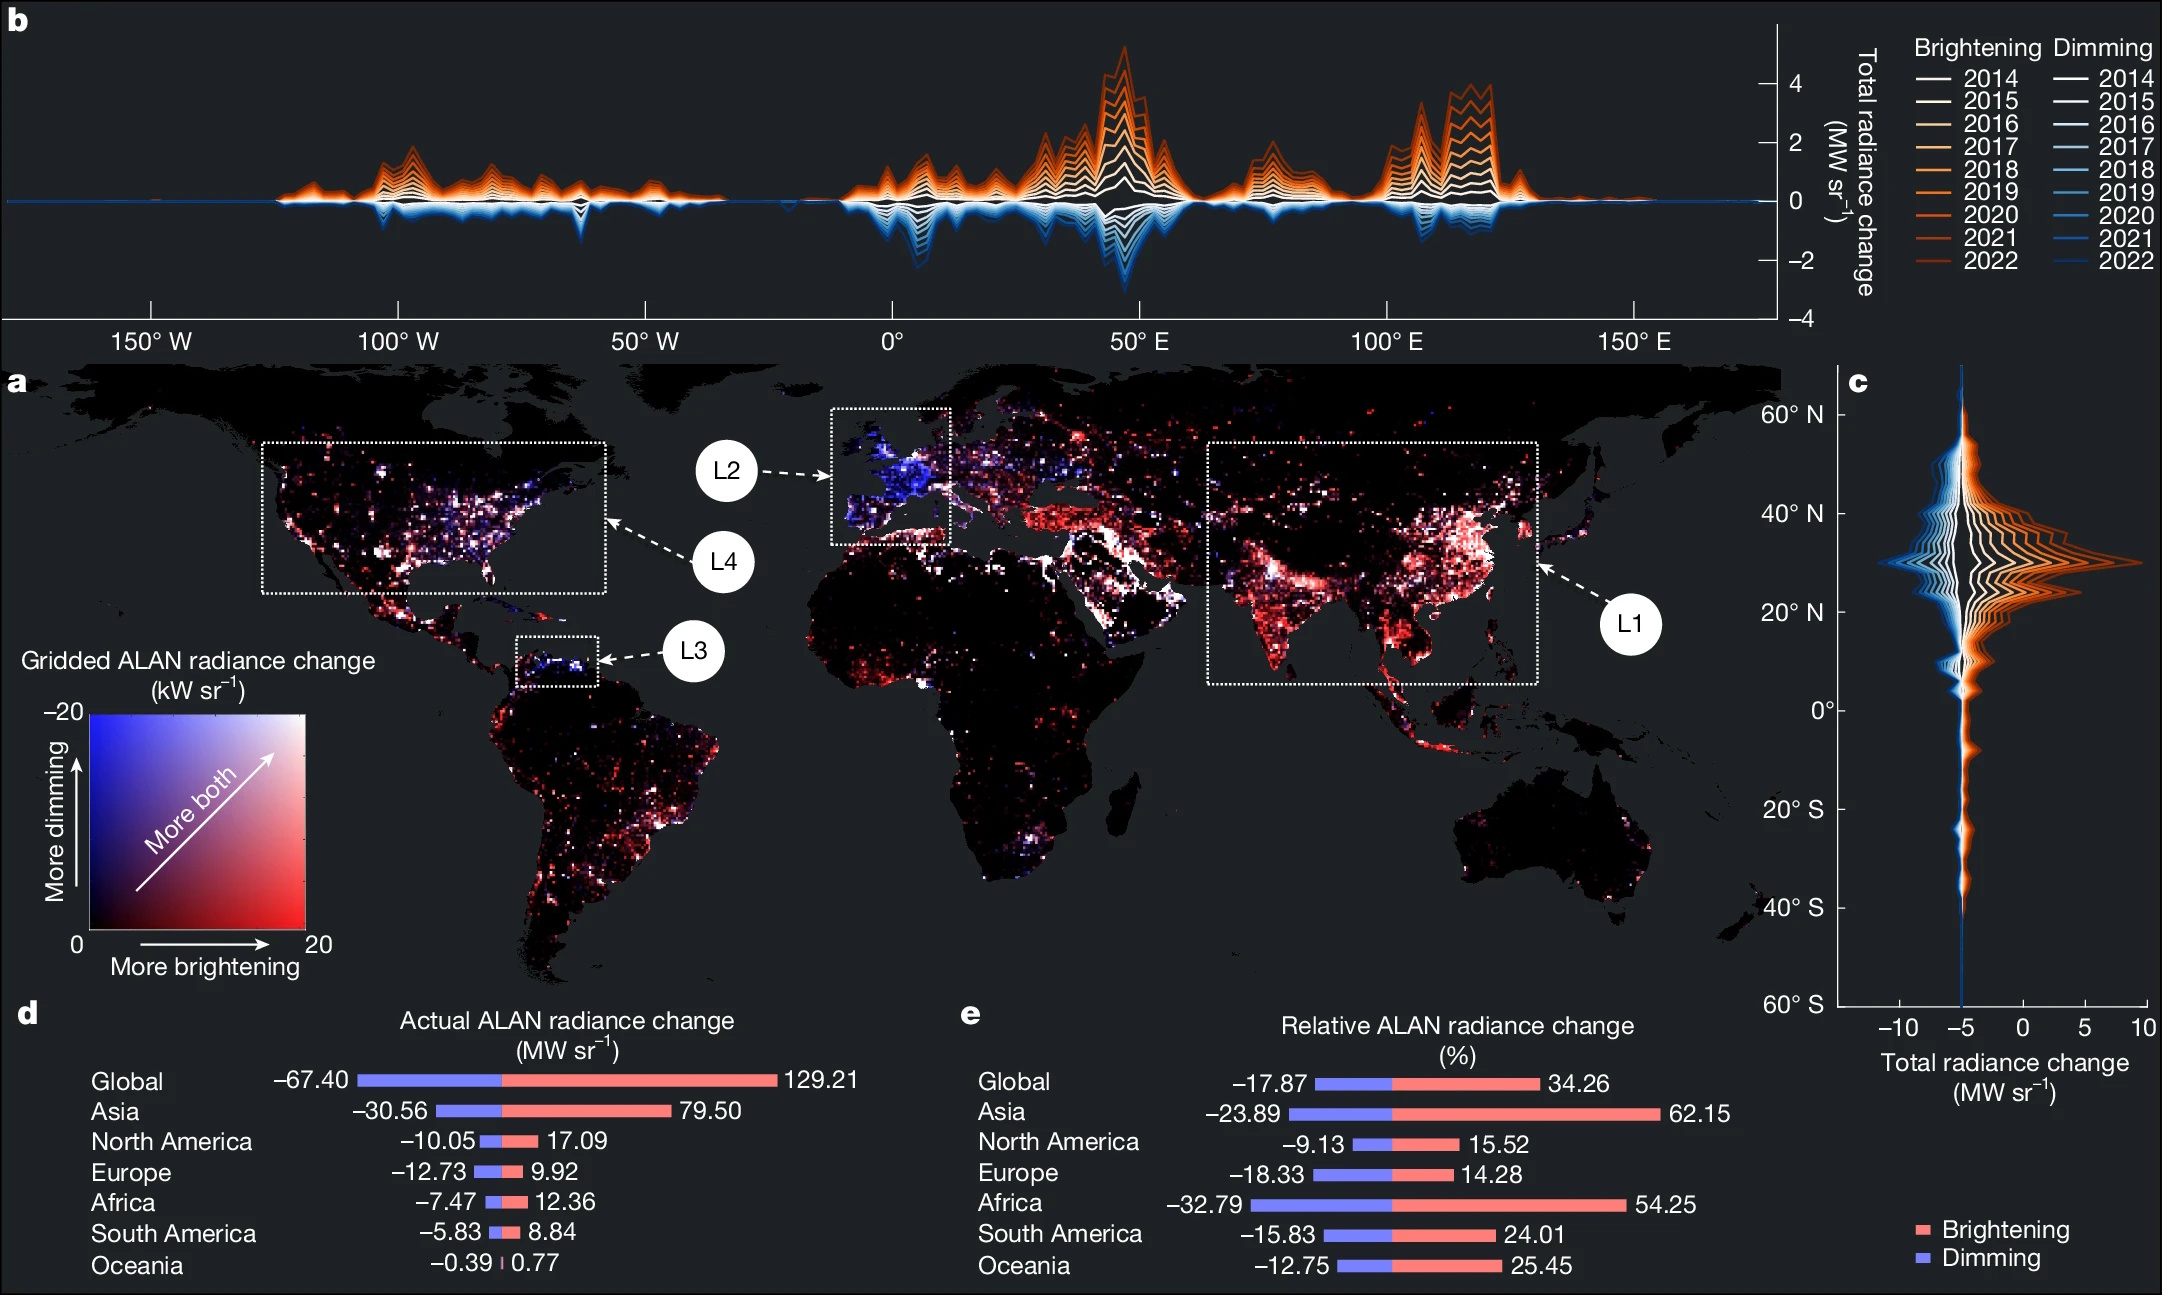
This image showcases the global pattern of changes in artificial lighting at night (ALAN) by including both brightening and dimming effects. Over 21 million square kilometers of Earth has experienced a major change in radiance during that time, with only a few areas (like northwestern Europe and northern South America) experiencing a net dimming. Most of the world has gotten brighter in that time, with an overall increase in global radiance at night by 34% from 2014-2022.
Out of the 219 countries measured for changes in light output at night, only 30 of them (13.7%) have dimmed their existing light output while decreasing the overall brightness of their light pollution emissions. The majority of countries, the majority of land area, and the majority of people in the world are now experiencing brighter, more heavily light polluted skies in 2022 and beyond as compared with 2014 and earlier.
China, India, Indonesia, the Middle East, and most of the Americas have brightened severely.
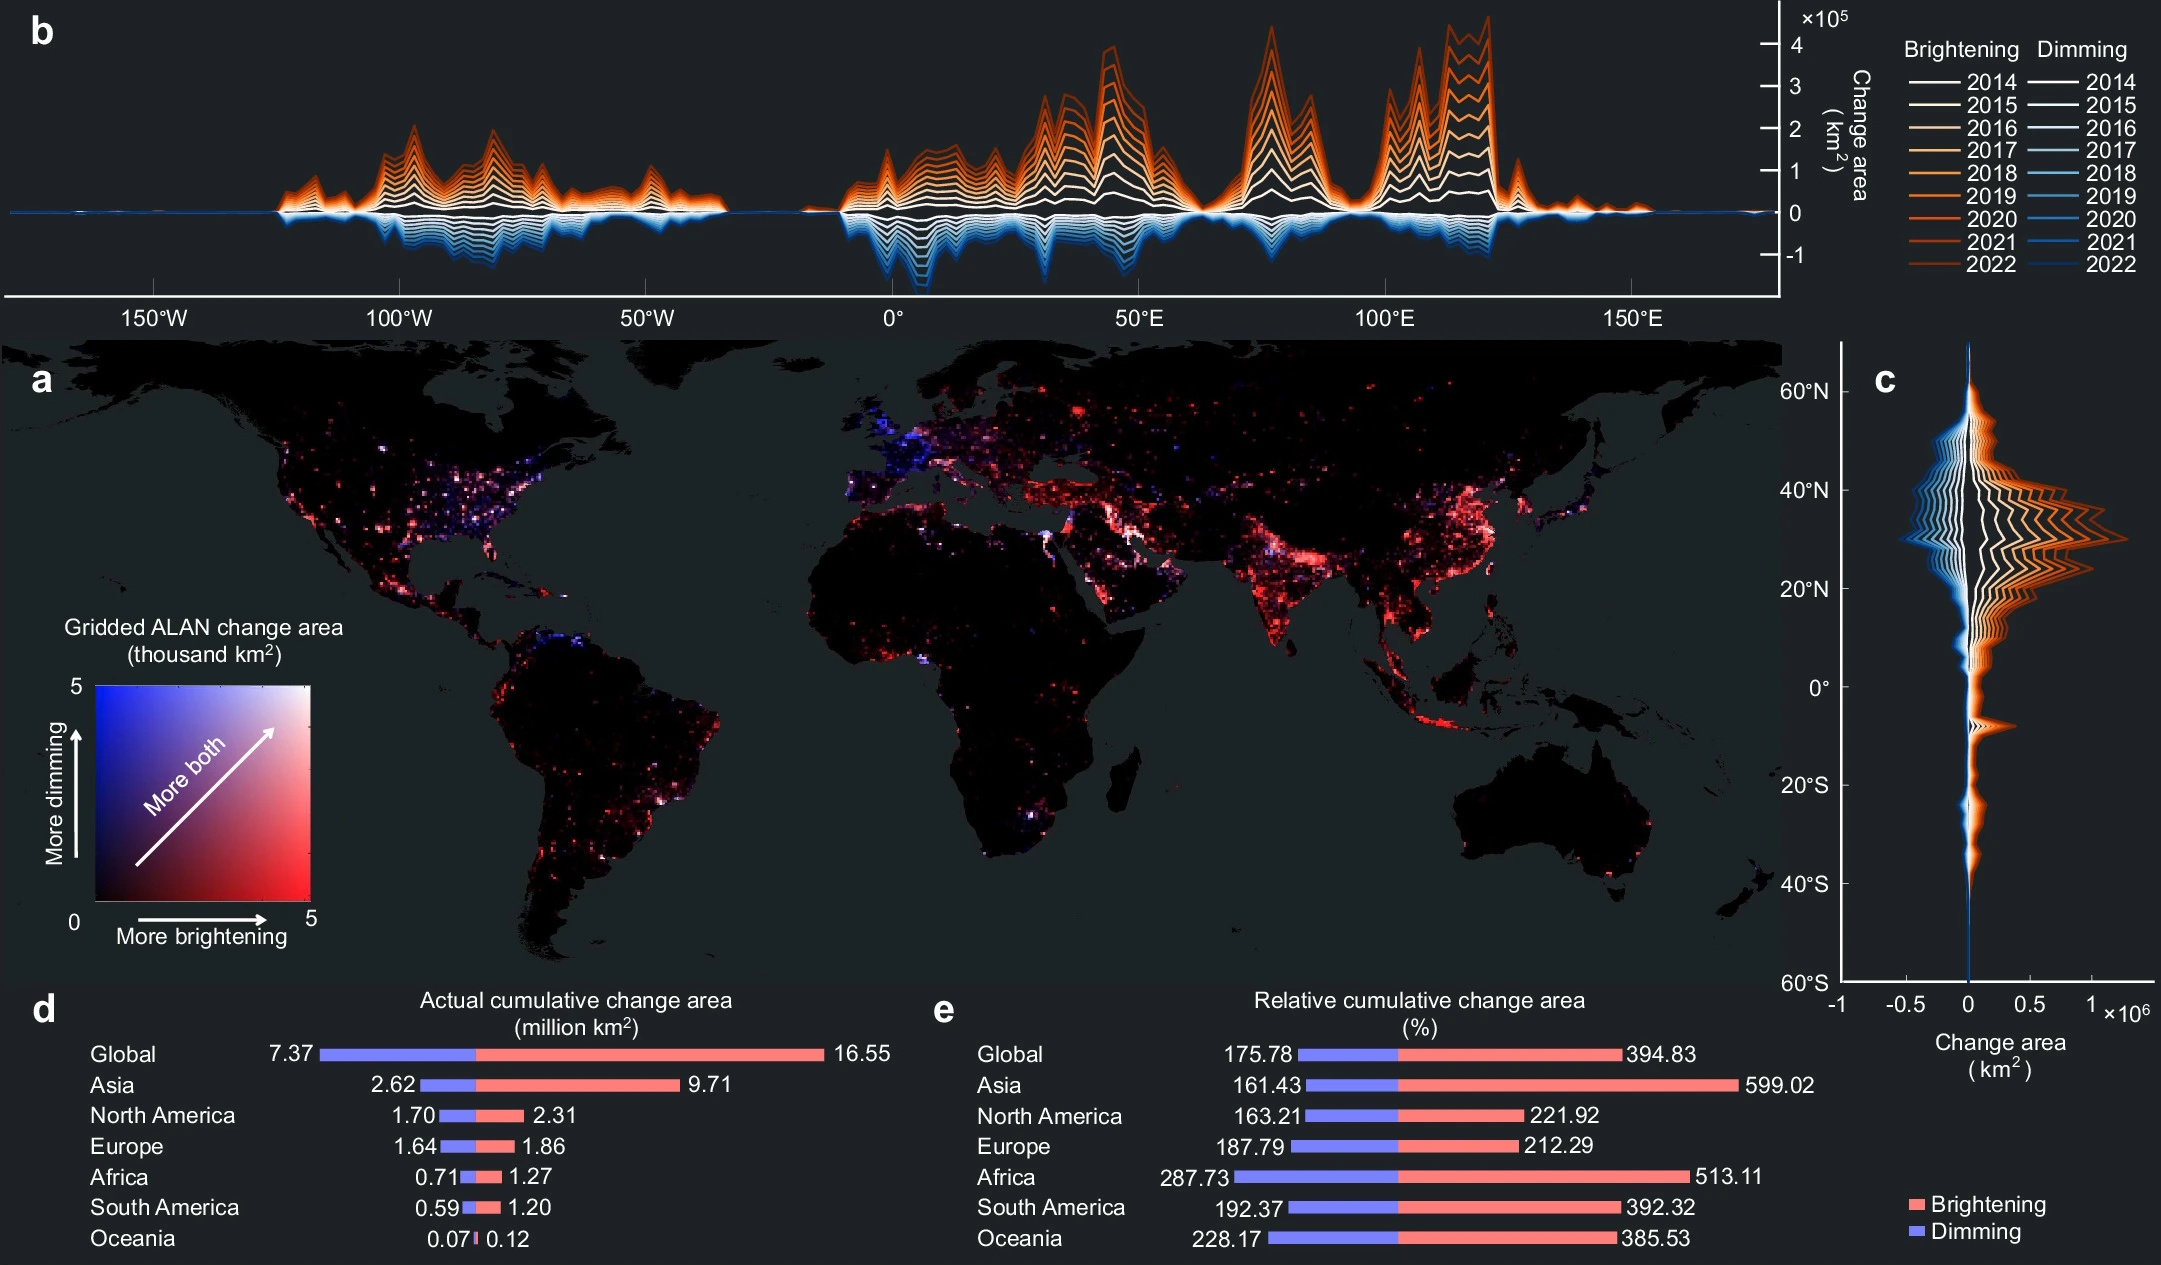
This figure from a 2014-2022 global study showcases the areas that have become brighter (in red) or dimmer (in blue) over the 2014-2022 period as compared with 2014. The greatest increases in brightness occur in the red-coded areas which have experienced large enhancements in brightness over area as well: concentrated in Asia, particularly China, India, and Indonesia, as well as the Middle East, followed by the North American areas of Mexico, plus Texas, California, and Florida in the United States, as well as Eastern Europe and coastal areas in South America.
Most of this light is wasted: illuminating the sky, not the ground.
The greater the amount of light that gets shunted upward or horizontally, the more light pollution will be emitted by a fixture. The best light fixtures will shunt all their light downward, toward the ground, as shown at right. However, the most common types of fixtures are the ones closer to the left of the diagram, resulting in an enormous amount of cumulative light pollution impacting planet Earth.
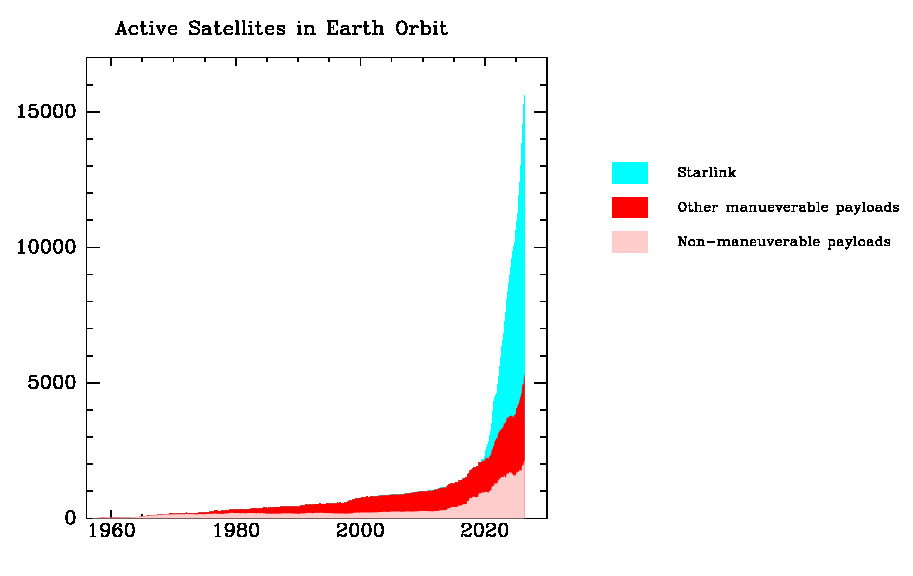
Contemporaneously, active satellite numbers rose from 1167 in 2014 to 15,623 as of today.
Back in 2014, there were only 1167 active satellites in orbit. At the start of 2019, that number was still hovering right around 2000 when the first set of Starlink satellites were launched. As of May, 2026, there are now over 15000 active satellites in low-Earth orbit, and plans for over 1,000,000 satellites have now been filed.
The average human now sees barely 100 stars, rather than thousands, each night.
Under a pristine night sky, the Milky Way’s center casts shadows. As light pollution worsens, nebulosity and stars disappear, until maybe a few dozen stars remain. The numbers 1 through 9 are the Bortle scale, which provides observers with a metric to measure the darkness and clarity of the sky overhead at their location. As of 2016, approximately 80% of humans live under conditions that are a 5 or higher under the Bortle scale: where the natural night sky is severely washed out and the Milky way is invisible. The past decade has seen sky brightening largely worsen.


_(flipped_left-right).jpg)