The Hubble tension: still unresolved, despite new measurements
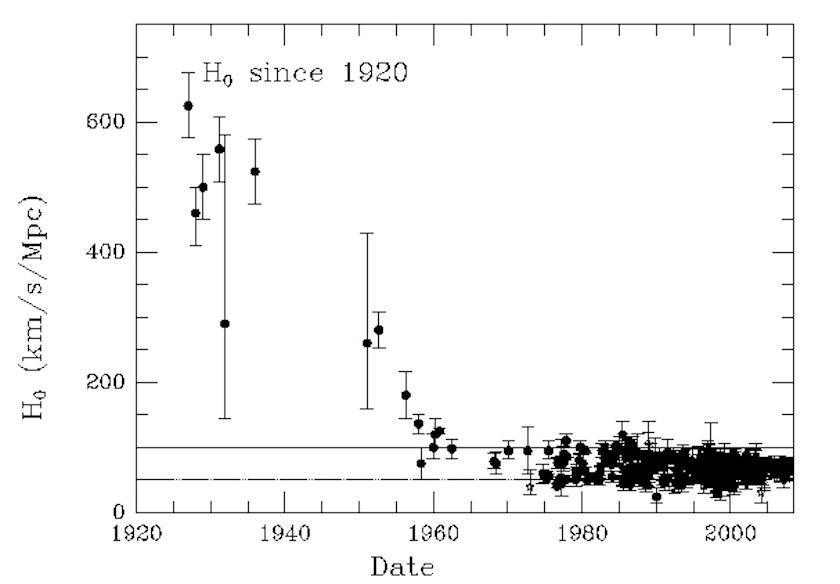
- For several years now, it’s been a puzzle why using distance ladder measurements to determine the Hubble constant yield ~73 km/s/Mpc, but “early relic” methods yield ~67 km/s/Mpc.
- A new group, using a novel “rung” to link local parallax measurements with distant type Ia supernova measurements on the distance ladder, determines a surprisingly low value for the Hubble constant: 68 km/s/Mpc.
- Does this potentially resolve the Hubble tension, casting doubt on the other distance ladder measurements? A deep look shows that the answer is “no,” and instead highlights just how deep the tension truly runs.
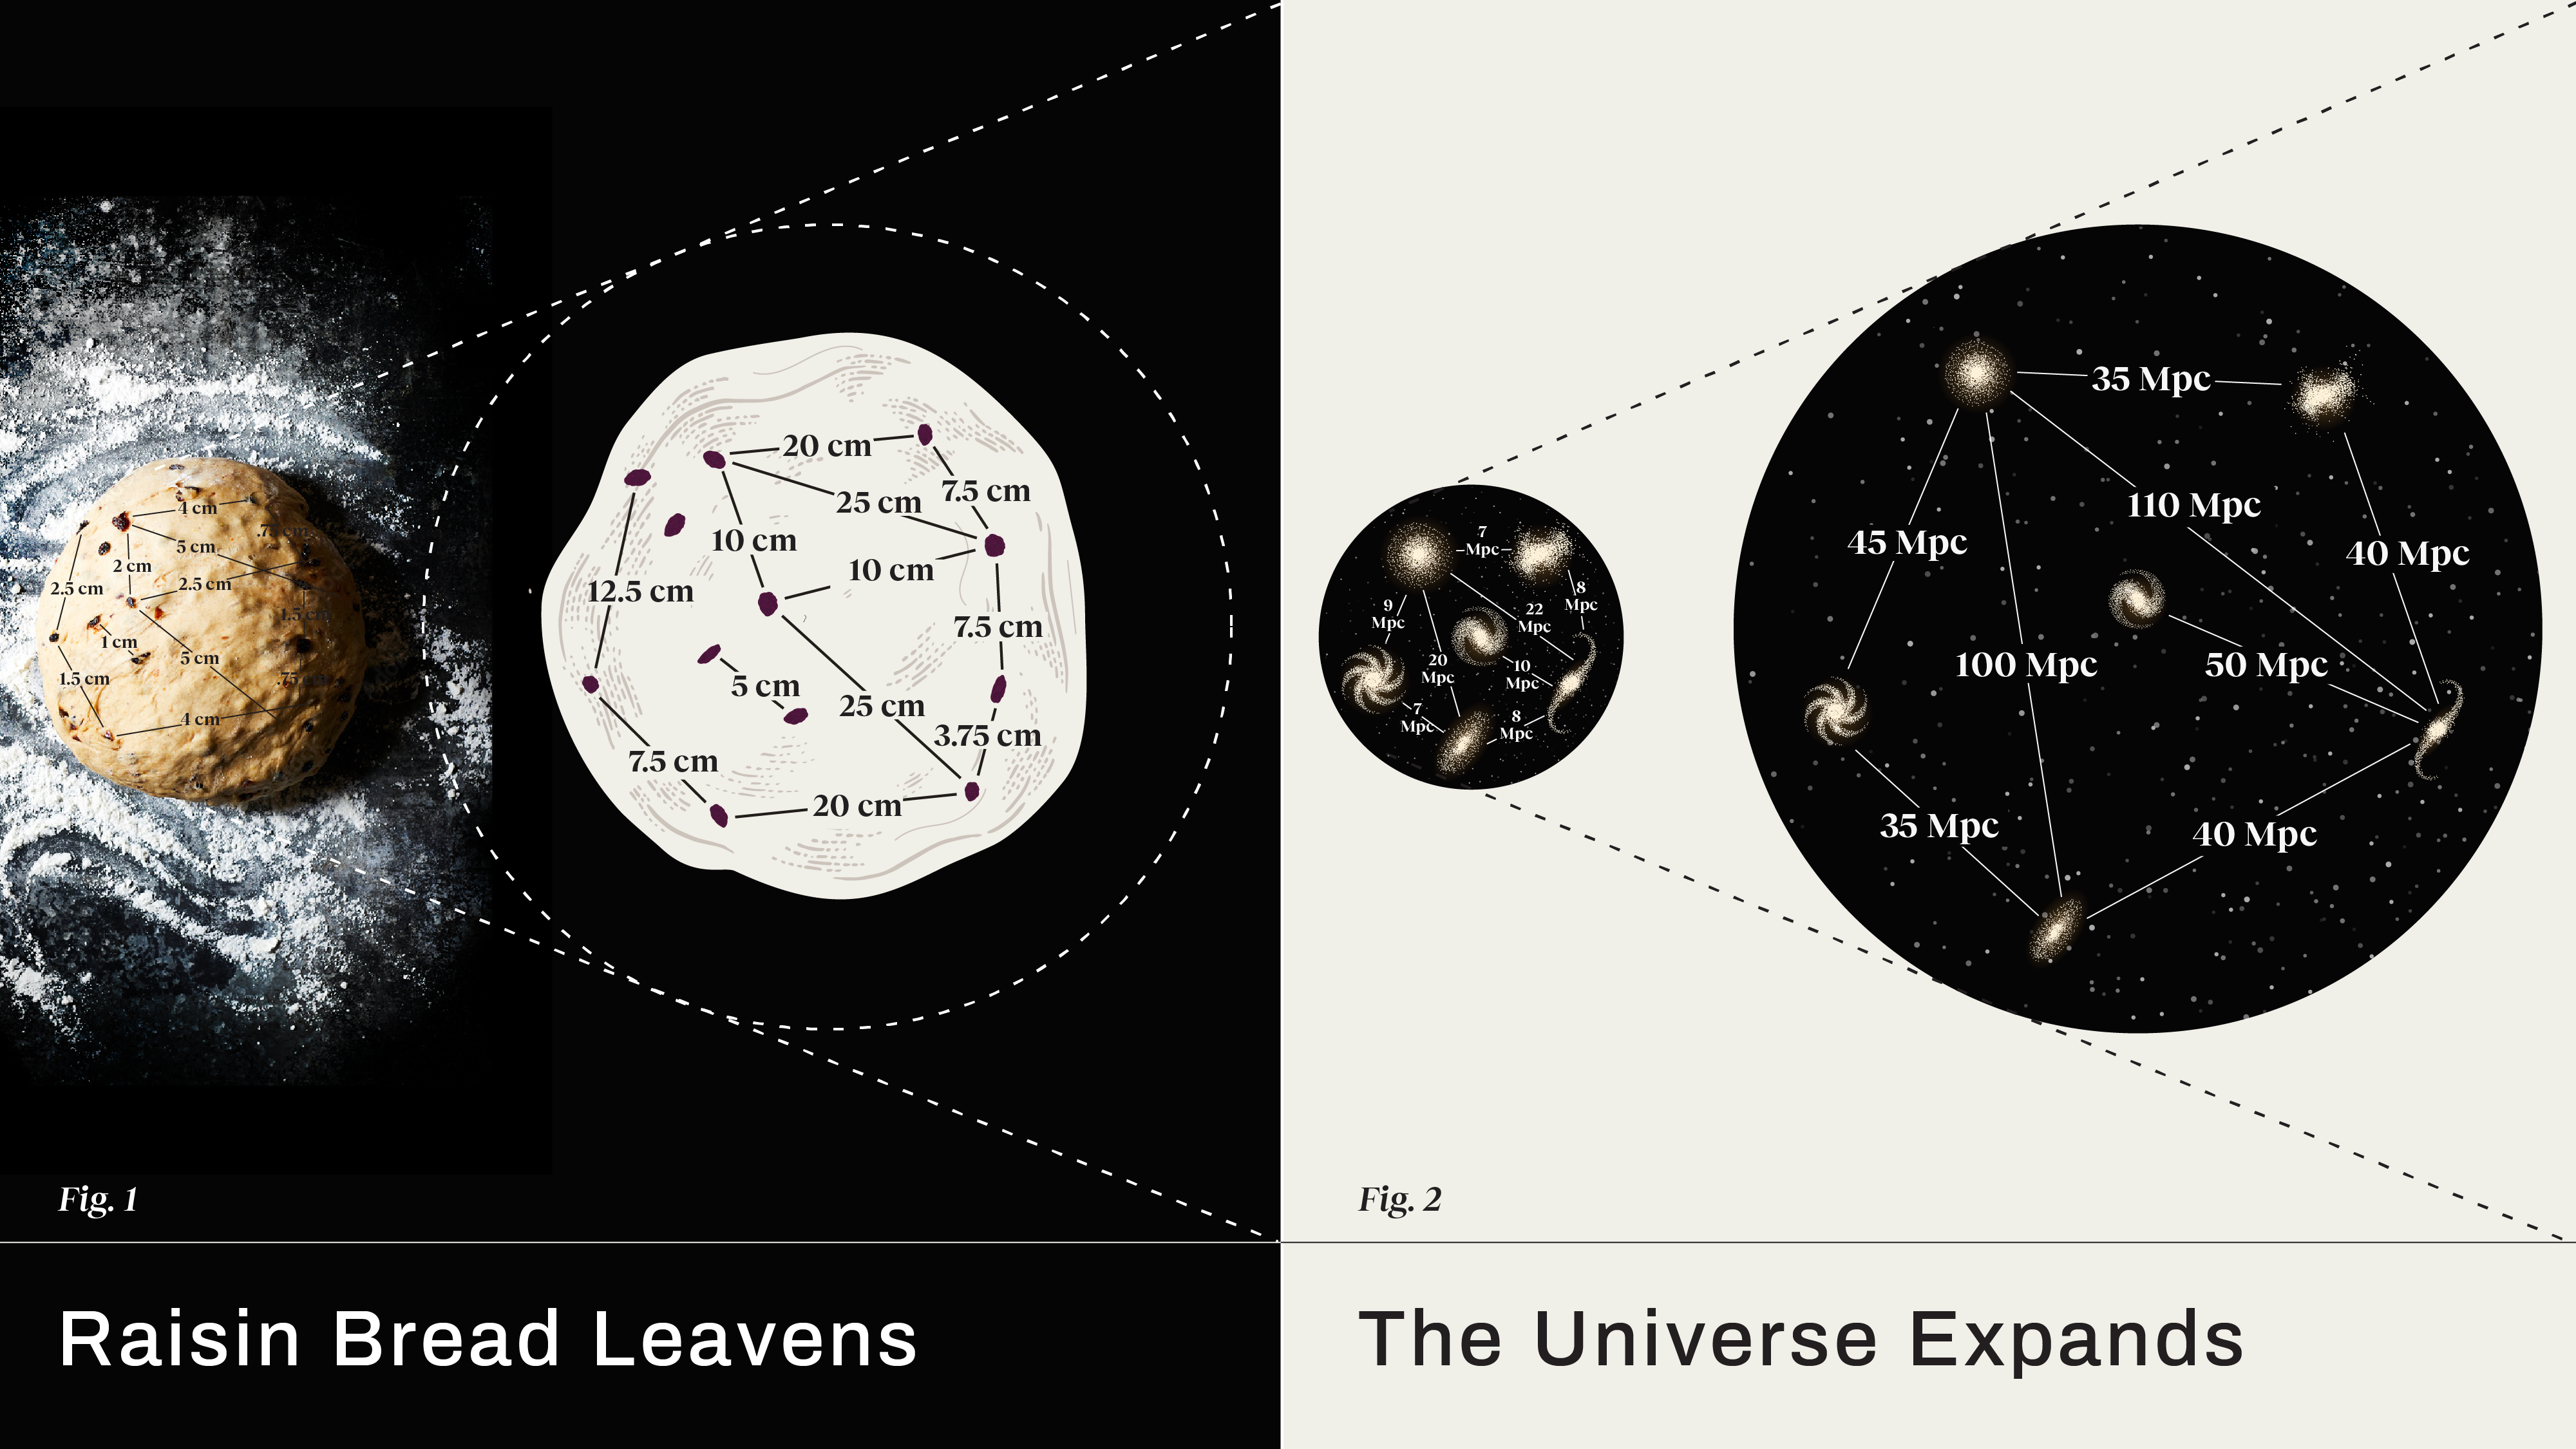
One of the most puzzling facts about our Universe is that even though we have many different methods of measuring how fast the space between galaxies expands, two broad classes of measurements disagree significantly. One of them, known as “distance ladder” measurements,
- starts by measuring the distance to nearby stars within the Milky Way of a specific type,
- next finding stars of the same type in nearby galaxies,
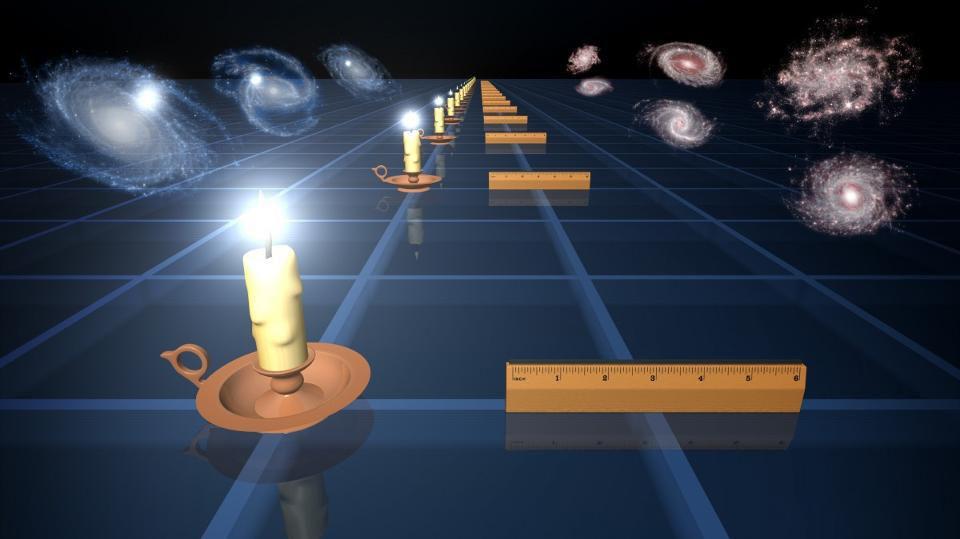
- then measuring some brilliant property (such as type Ia supernovae) that occur in those same galaxies,
- and finally linking those bright signals (e.g., supernovae) to ones found at even great cosmic distances.
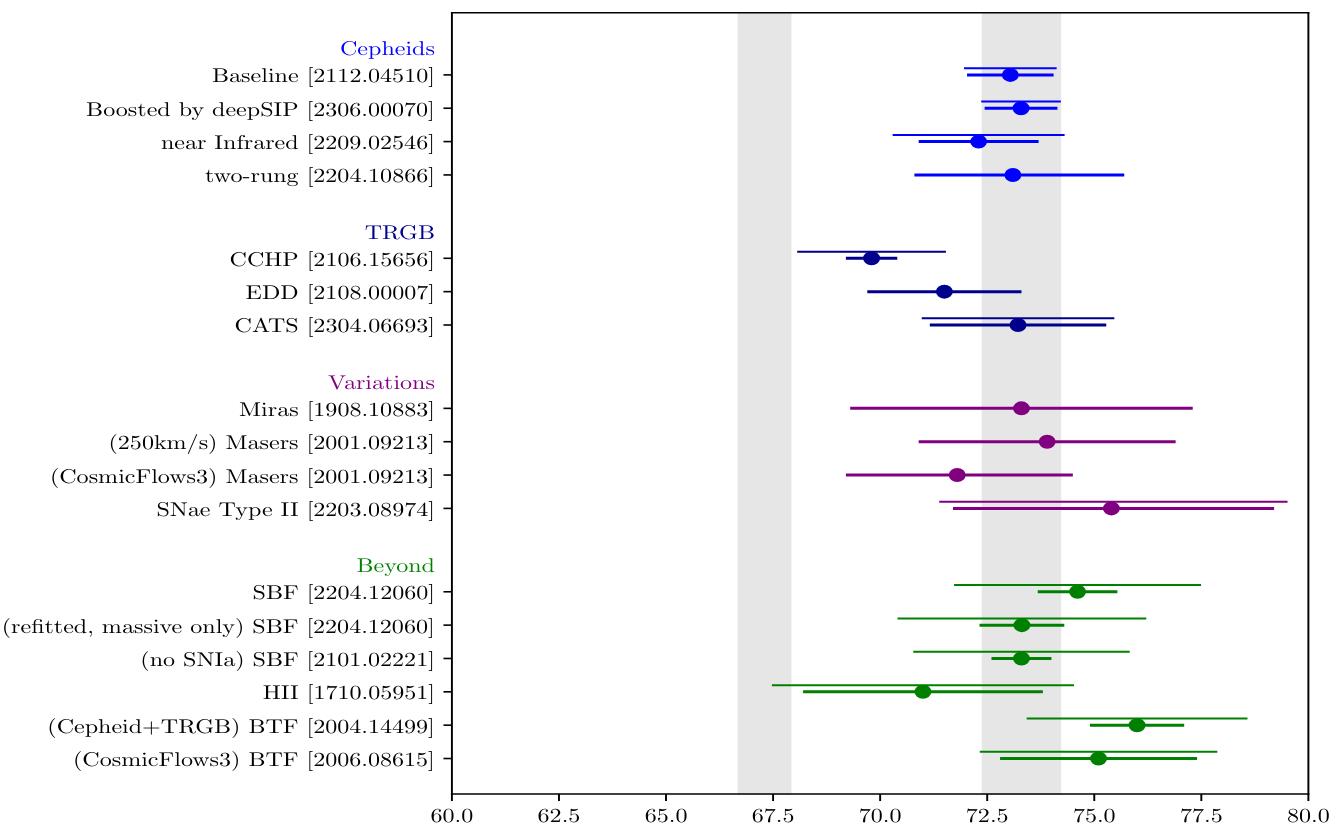
That method, regardless of the specific indicator or star type used, seems to lead to a value of H0, the Hubble constant, that’s around 73 km/s/Mpc, with only a 1% uncertainty.
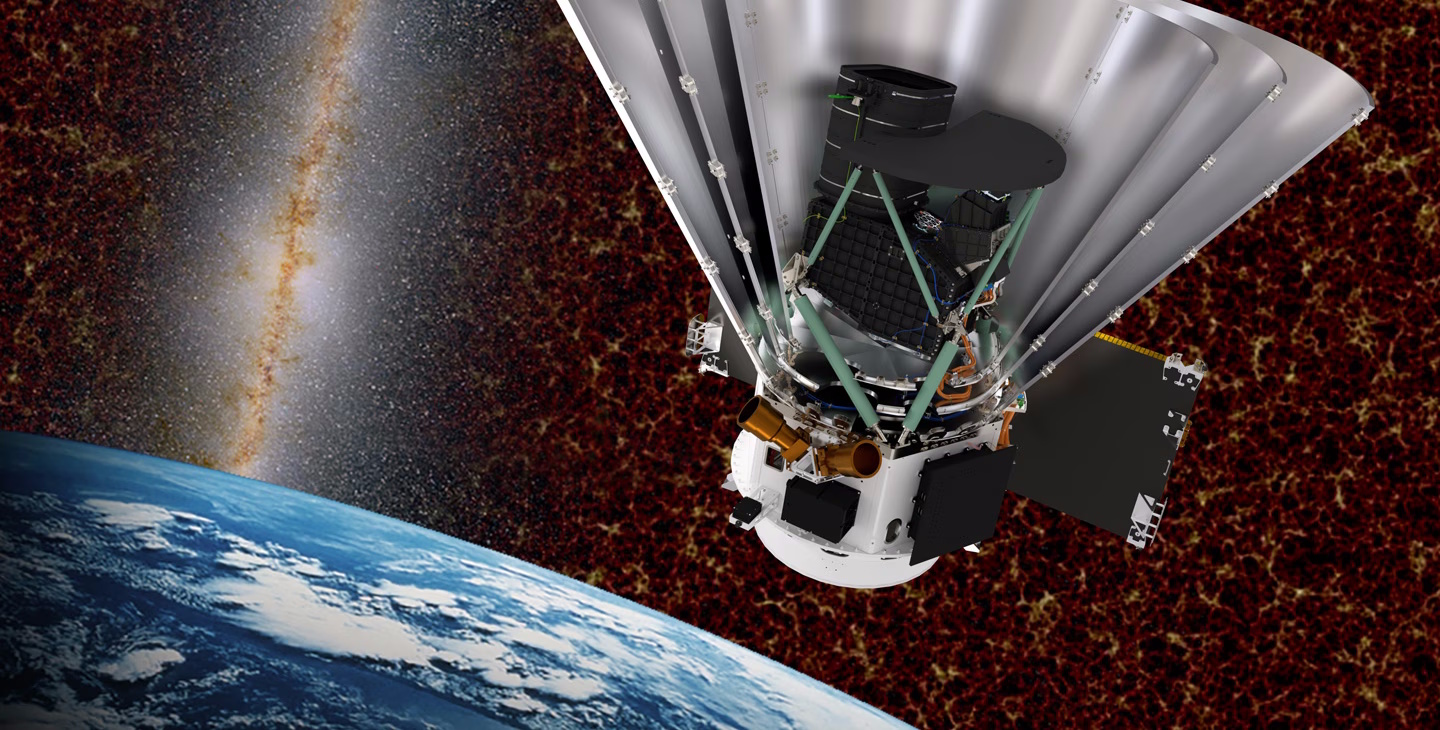
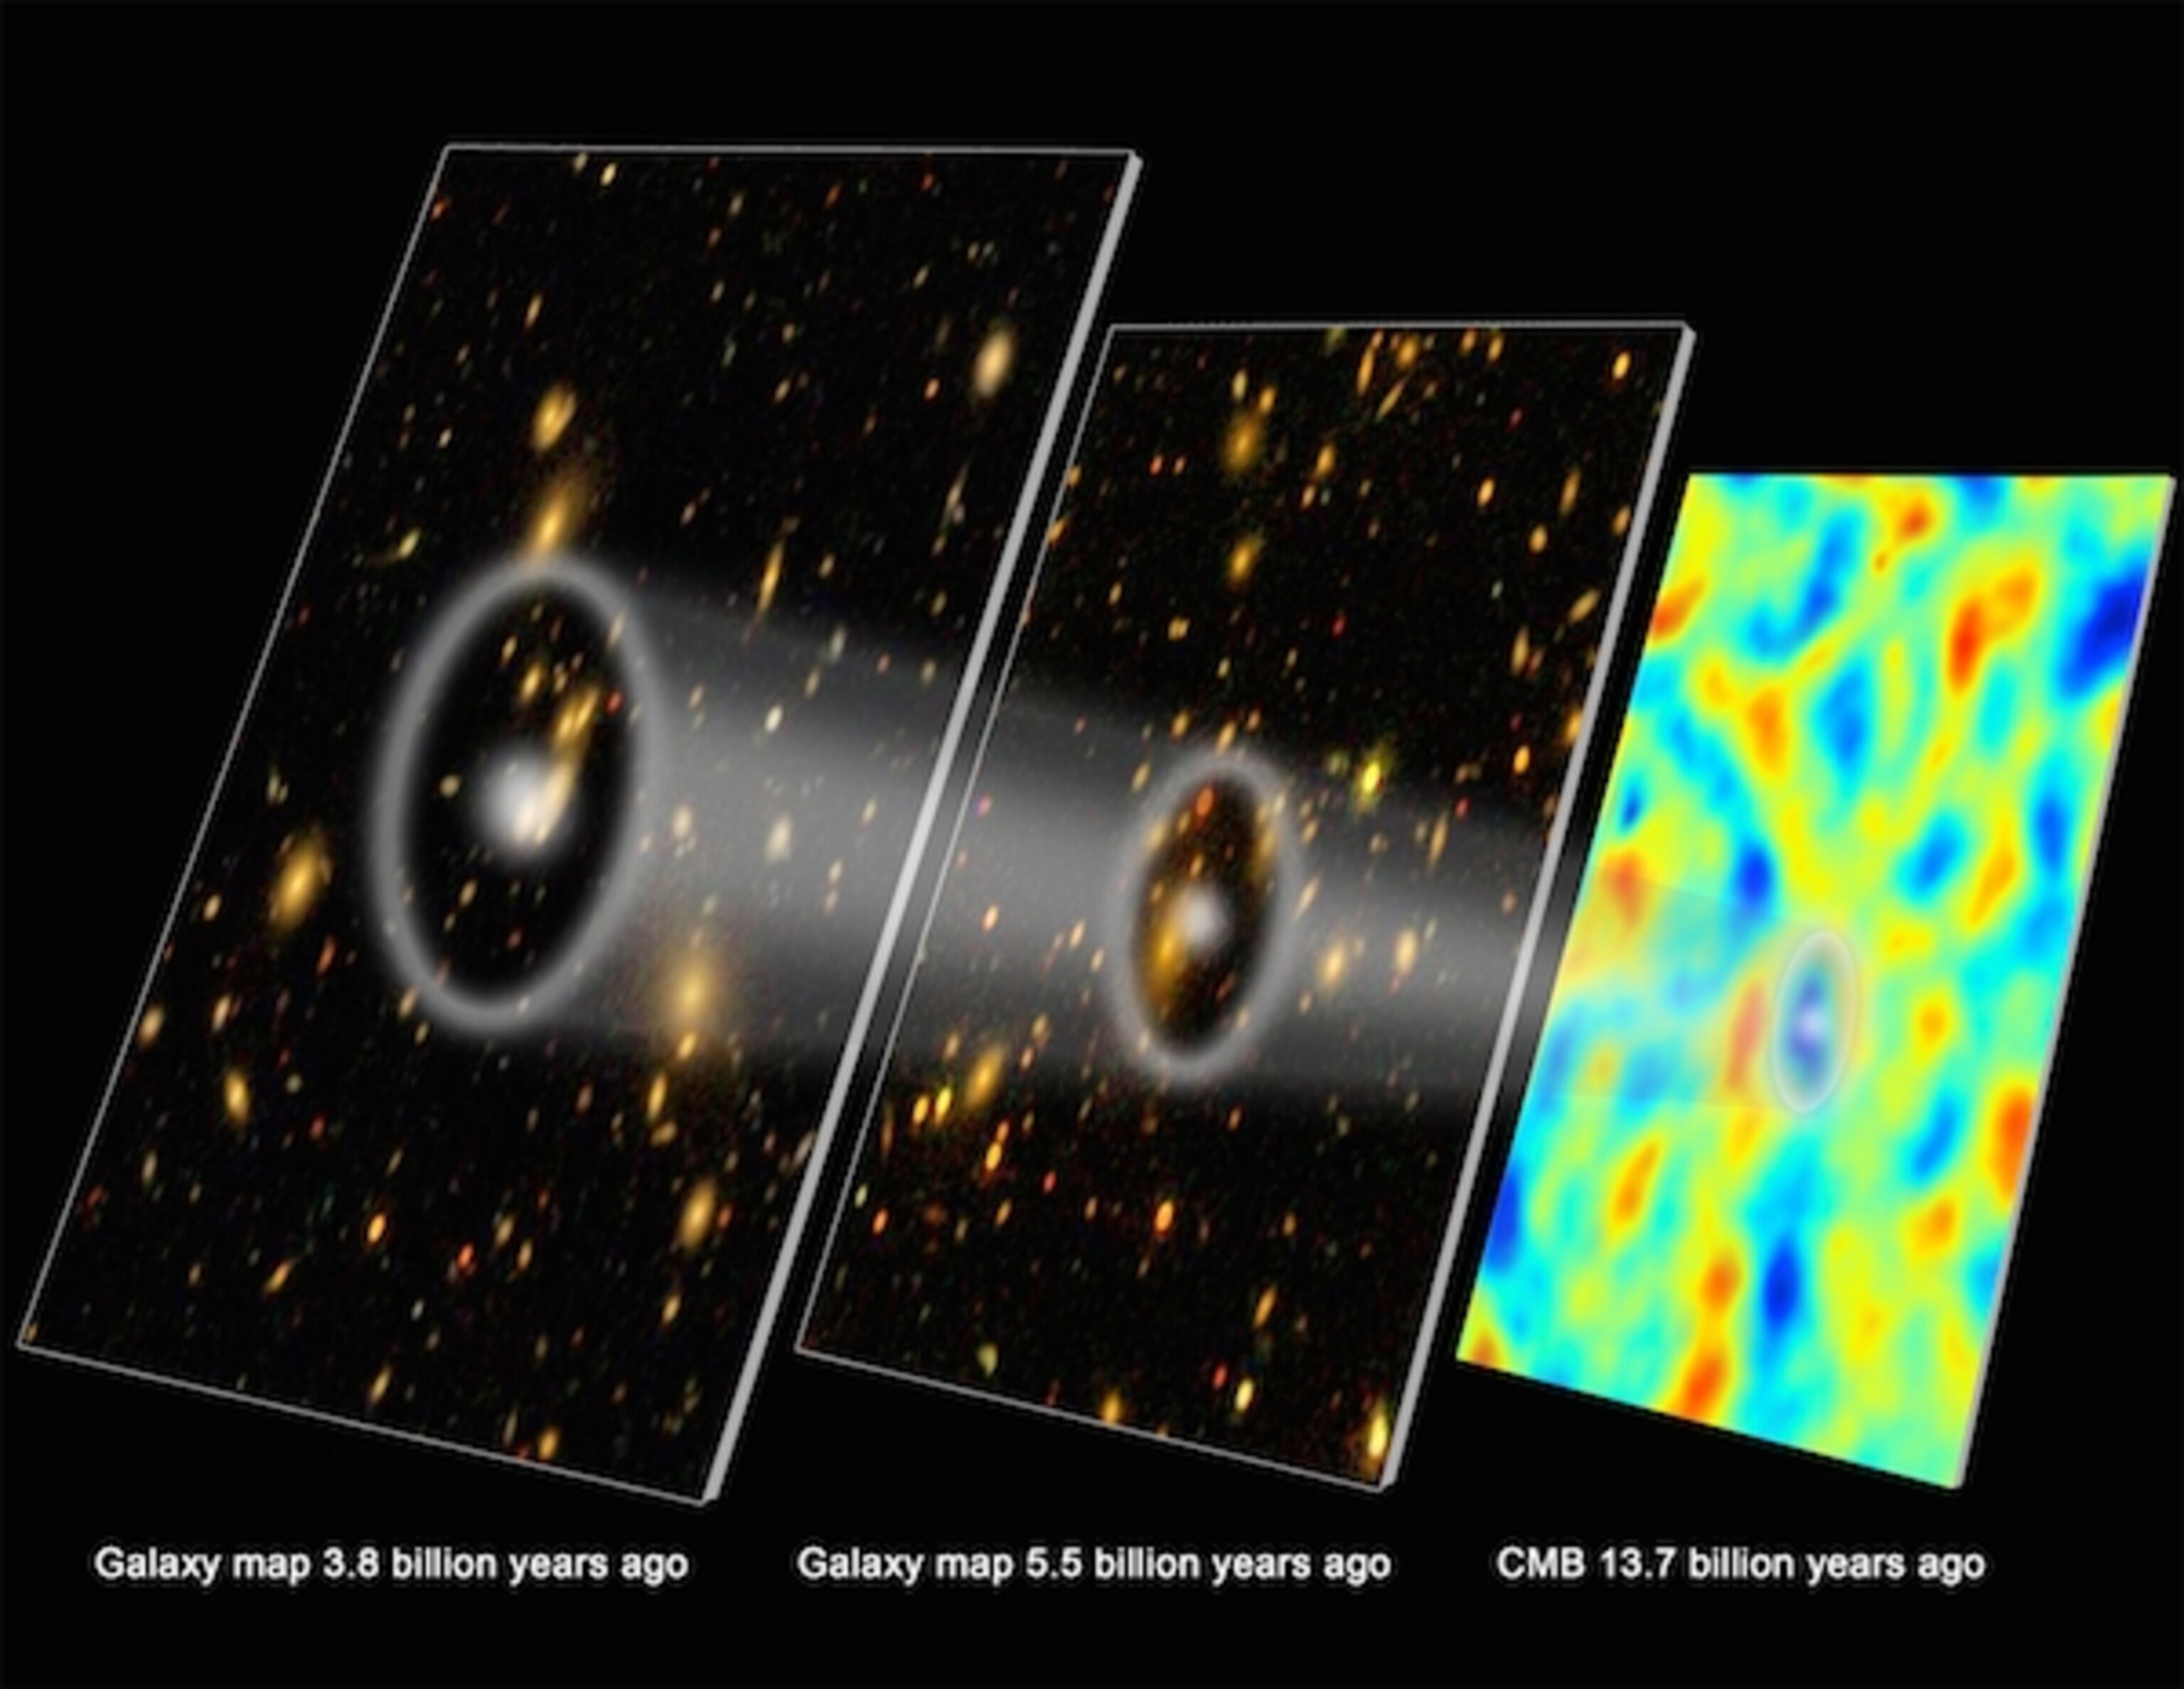
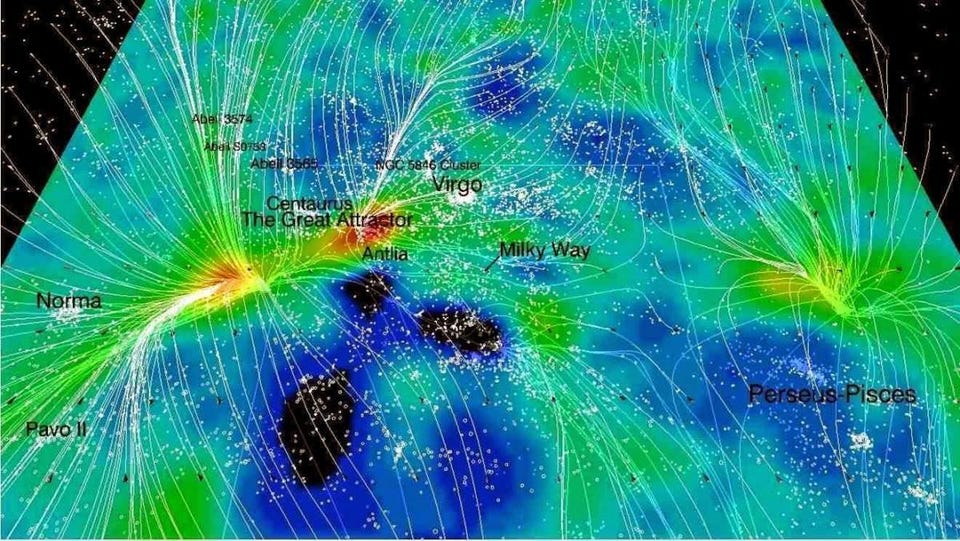
But if you instead begin with a signal imprinted onto the cosmos in the early Universe, such as the acoustic scale (resulting from the interactions between normal matter and radiation), imprinted in either the cosmic microwave background (CMB) or onto the galaxy-galaxy correlations found in the Universe’s large-scale structure, you get a much lower value of the Hubble constant, H0, of around 67 km/s/Mpc, again with only a 1% uncertainty. This puzzle, known as the Hubble tension, is one of the greatest conundrums facing modern cosmology today.
However, a new paper, whose preliminary results have been teased many times over the prior few months, claims that a new distance ladder method yields a much lower value of the expansion rate, H0, of just ~68 km/s/Mpc. This stands in stark contrast to other distance ladder methods, and presents a fascinating option: that perhaps we’ve done the distance ladder all wrong, and there is no puzzle. Is this a realistic take on a huge cosmic conundrum? Despite the claims of the new paper, the answer is a resounding “no.” Here’s the science behind why.
In most arenas in life, if “person A” tells you things are one way while “person B” tells you that things are another, incompatible way, chances are that someone is going to be right and someone is going to be wrong. Maybe person A has made a mistake somewhere along the way, whereas person B has done everything correctly. Maybe person A has correctly calibrated measuring devices, whereas person B’s measuring devices are off from the true value in some fashion. Maybe person A is using a small, low-quality data set while person B is using a large, robust, high-quality one. Or maybe person A and person B are using two different methods to arrive at their conclusions, and one of them — for reasons that may not be known to either — happens to be fundamentally flawed.
For several years now, this has perhaps been the mainstream view of what astronomers and astrophysicists now call “the Hubble tension,” or the fact that two different classes of technique for measuring the expansion of the Universe give two different, yet mutually incompatible, values. Our observations of signals imprinted upon the early Universe — both in the CMB and in the Universe’s large-scale structure — are mutually compatible and point toward an expansion rate that’s on the low side: ~67 km/s/Mpc, with an uncertainty of just ~1%. These data sets are extremely high quality; the errors and uncertainties associated with them are extremely small; the methods used to extract cosmological parameters from them are well-tested and have proven robust. As a result, many professionals have hoped that this Hubble tension would simply be the result of an error, perhaps even an undiscovered error, within the distance ladder data that leads to this apparent incompatibility.
A new distance ladder result that yields an outlier value compared to all the others — of 68 km/s/Mpc, instead of the 73 km/s/Mpc that are far more ubiquitously arrived at — might appear to bolster this view. However, there are many reasons to believe that this tension is far more problematic than the naive scenario where “someone just made a mistake,” and a single, outlier measurement using a new (but promising) method and a much smaller set of data doesn’t exactly inspire confidence that it provides a simple, straightforward resolution to this cosmic conundrum.
One common misconception about the Hubble tension puzzle is that there’s an incompatibility between:
- the supernova data, where type Ia supernovae are the most far-reaching reliable observable signature leveraged by teams using the cosmic distance ladder method,
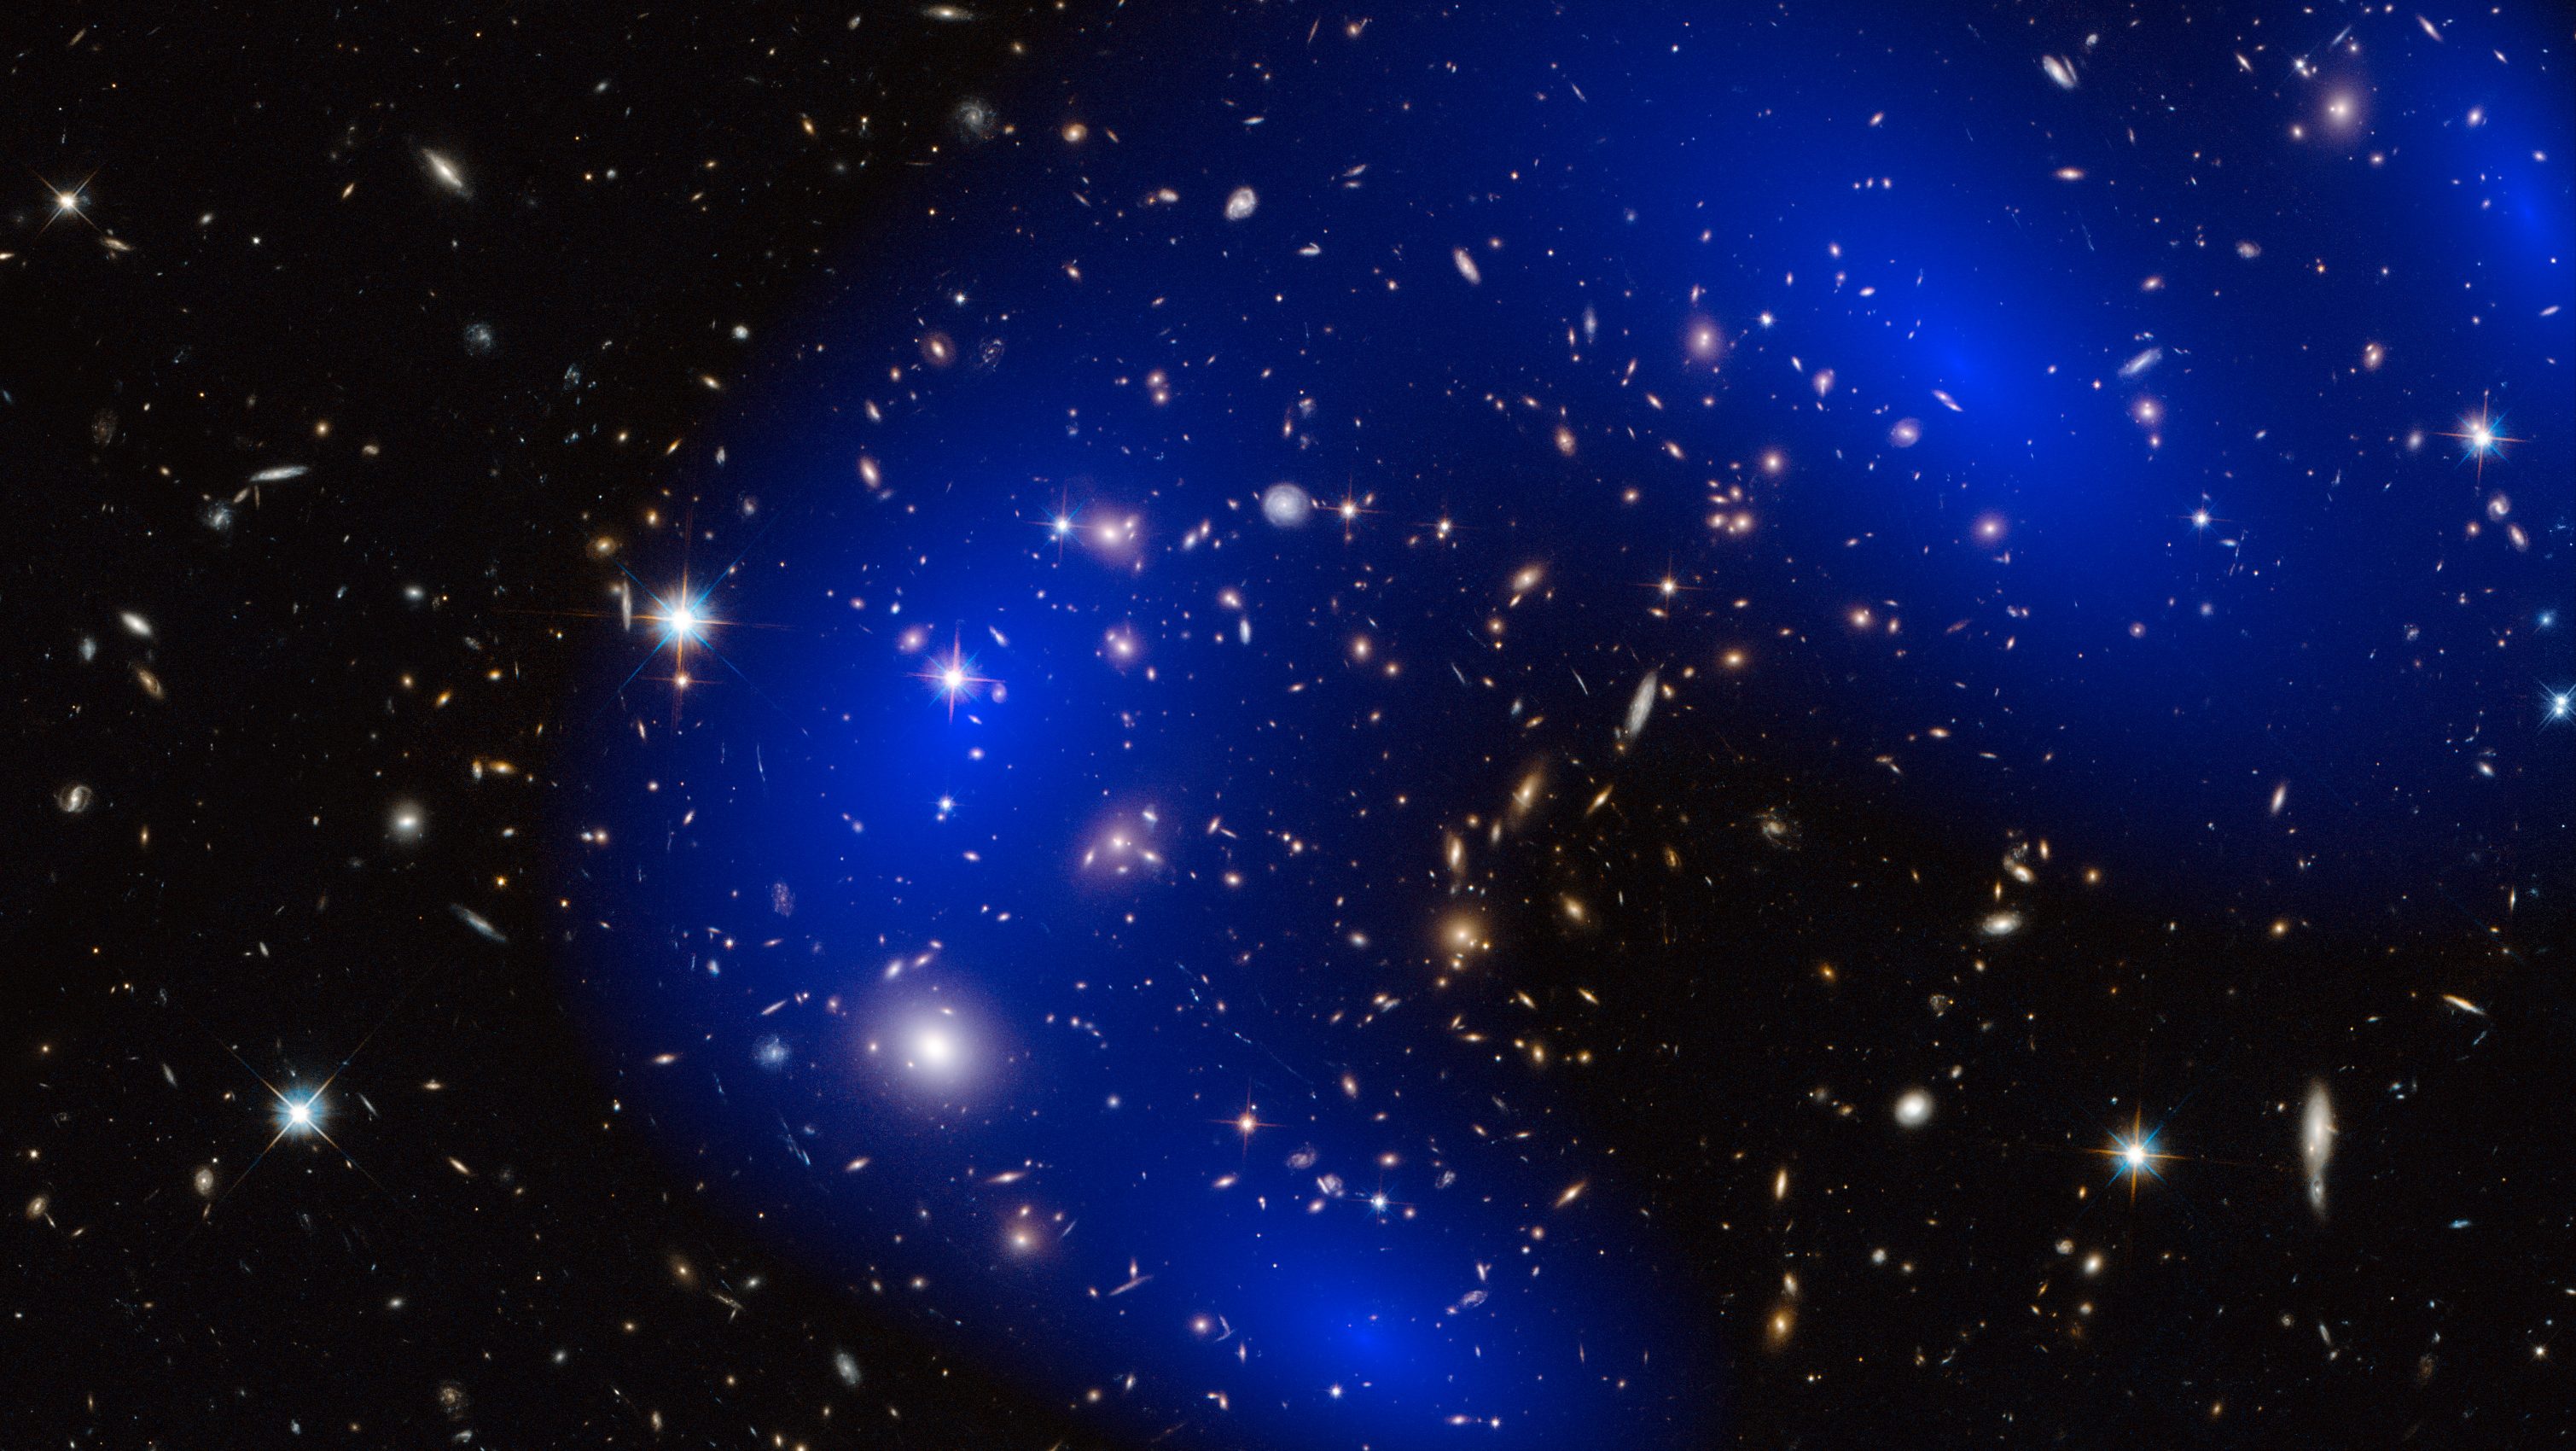
- the data from galaxy-galaxy clustering imprinted in the large-scale structure of the Universe (also known as the feature of baryon acoustic oscillations, or BAO, that reveals a characteristic distance scale which expands along with the expanding Universe),
- and the data from the CMB, which gives us a more direct measurement of the physical scale of the “peak” seen in temperature fluctuations of the Big Bang’s leftover glow, revealing what the “acoustic scale” was when the Universe was only 380,000 years old.
But the puzzle with the Hubble tension has nothing to do with these data sets being mutually incompatible at all.
In fact, the data sets are all incredibly compatible and consistent. The data from type Ia supernovae and baryon acoustic oscillations overlap substantially in space, and offer no disagreement with one another. The distance-brightness relationship for supernovae works great, and exhibits no tension between the distance-acoustic scale (i.e., angular size) relationship in galaxy-galaxy clustering. This often surprises people when they hear a statement like this, as they often believe that the different data sets are the very things that are in tension with one another.
That’s not exactly true, however. Instead, the tension arises when you choose a method for calibrating these data sets.
- For a distance ladder method, what you typically do is choose a nearby “anchor” for yourself: you say something like, “at these nearby distances, supernovae have this brightness and are this far away, and now we’re going to use the observed brightness and measured redshift (a proxy for distances) for more distant supernovae” to infer how the Universe has expanded over its history.
- For the CMB or BAO, which I’ll collectively call the early relic method, you instead start with the contents of your Universe (e.g., ΛCDM, or the “standard model” of cosmology) and the rules of how the Universe expands, and then use the measured features (e.g., the acoustic scale) to determine what the Universe was like long ago. Then, when you observe the light and its features today (either via the CMB or via BAO across cosmic history), you can infer how the Universe has expanded over its history.
This is where the tension comes from: whether you choose your anchor point to be nearby, and then extend it out into the ever-more-distant Universe, or whether you choose your anchor point to be close in time to the Big Bang, and then come forward to measure our cosmic expansion history since that time. The distance ladder method is the “start here, and then look out” way of doing things, and that consistently leads to values for the expansion rate of ~73 km/s/Mpc, whereas the early relic method is the “start early, and watch the acoustic scale grow as you come closer to the present” way of doing things, which consistently yields values of ~67 km/s/Mpc.
If this is where the problem, puzzle, or conundrum truly lies, then what could the resolution to this Hubble tension truly be?
It’s certainly possible that the “early relic” method is leading us astray. We have to recognize that even though we have an incredibly successful theory of the early Universe and our cosmic origins — a ΛCDM cosmology that obeys general relativity and the rules for a near-perfectly uniform expanding Universe — we’re building our model of the size of the acoustic scale based on things we have not directly observed. We are assuming that, prior to the emission of the CMB (or the last-scattering surface between photons and electrons from the final moments that the Universe was an ionized plasma), the Universe expanded in a particular way and at a particular rate, as predicted by the Friedmann equations, with no extra ingredients or caveats. But we have no proof of this; it’s possible that there is some new physics in the early Universe that alters the acoustic scale from what we predict, and we simply have no window into what that physics is. That’s one possible source of the mismatch between the two methods.
What’s less probable, however, is that there’s some similar problem with the distance ladder method. In general, here’s how the distance ladder method works in a modest amount of detail.
The first step is to begin nearby: in our own cosmic backyard. We can measure the distance to the stars using a method known as parallax, where we measure how much a relatively nearby star appears to shift (relative to the background, more distant objects) over the course of a year: as the Earth orbits the Sun and as the Sun and other stars move through space in all three dimensions. The ESA’s Gaia mission has made the most precise parallax measurements of all-time, and has done it for nearly two billion stars — stars of all types — within the Milky Way.
Then, as a second step, we take a subset of these stars that all fall into a particular class or category. These could be:
- intrinsically variable stars of a particular type, such as RR Lyrae stars or Cepheid Type I or Type II variable stars,
- stars that exhibit a particular change in apparent (rather than intrinsic) brightness over time, such as eclipsing binary stars,
- stars that exhibit a specific color-magnitude relationship that points to a specific stage in their stellar evolution, such as stars at the tip of the red giant branch (TRGB),
- or stars that are currently fusing carbon in their core that are destined to explode in a core-collapse supernova (e.g., asymptotic giant branch, or AGB, stars) that emit a specific amount of infrared radiation at a specific wavelength of between 1.1 and 1.4 microns (also known as the J-band).
Whichever method we choose, we measure stars of this specific type, and — assuming we understand them well enough — we can determine the distance to these stars simply by measuring readily observable properties. Since we find them both in the Milky Way (where parallax measurements can also be obtained) and in other galaxies that are far more distant, we can use these types of distance indicators to determine the distances to a significant number of galaxies beyond our own.

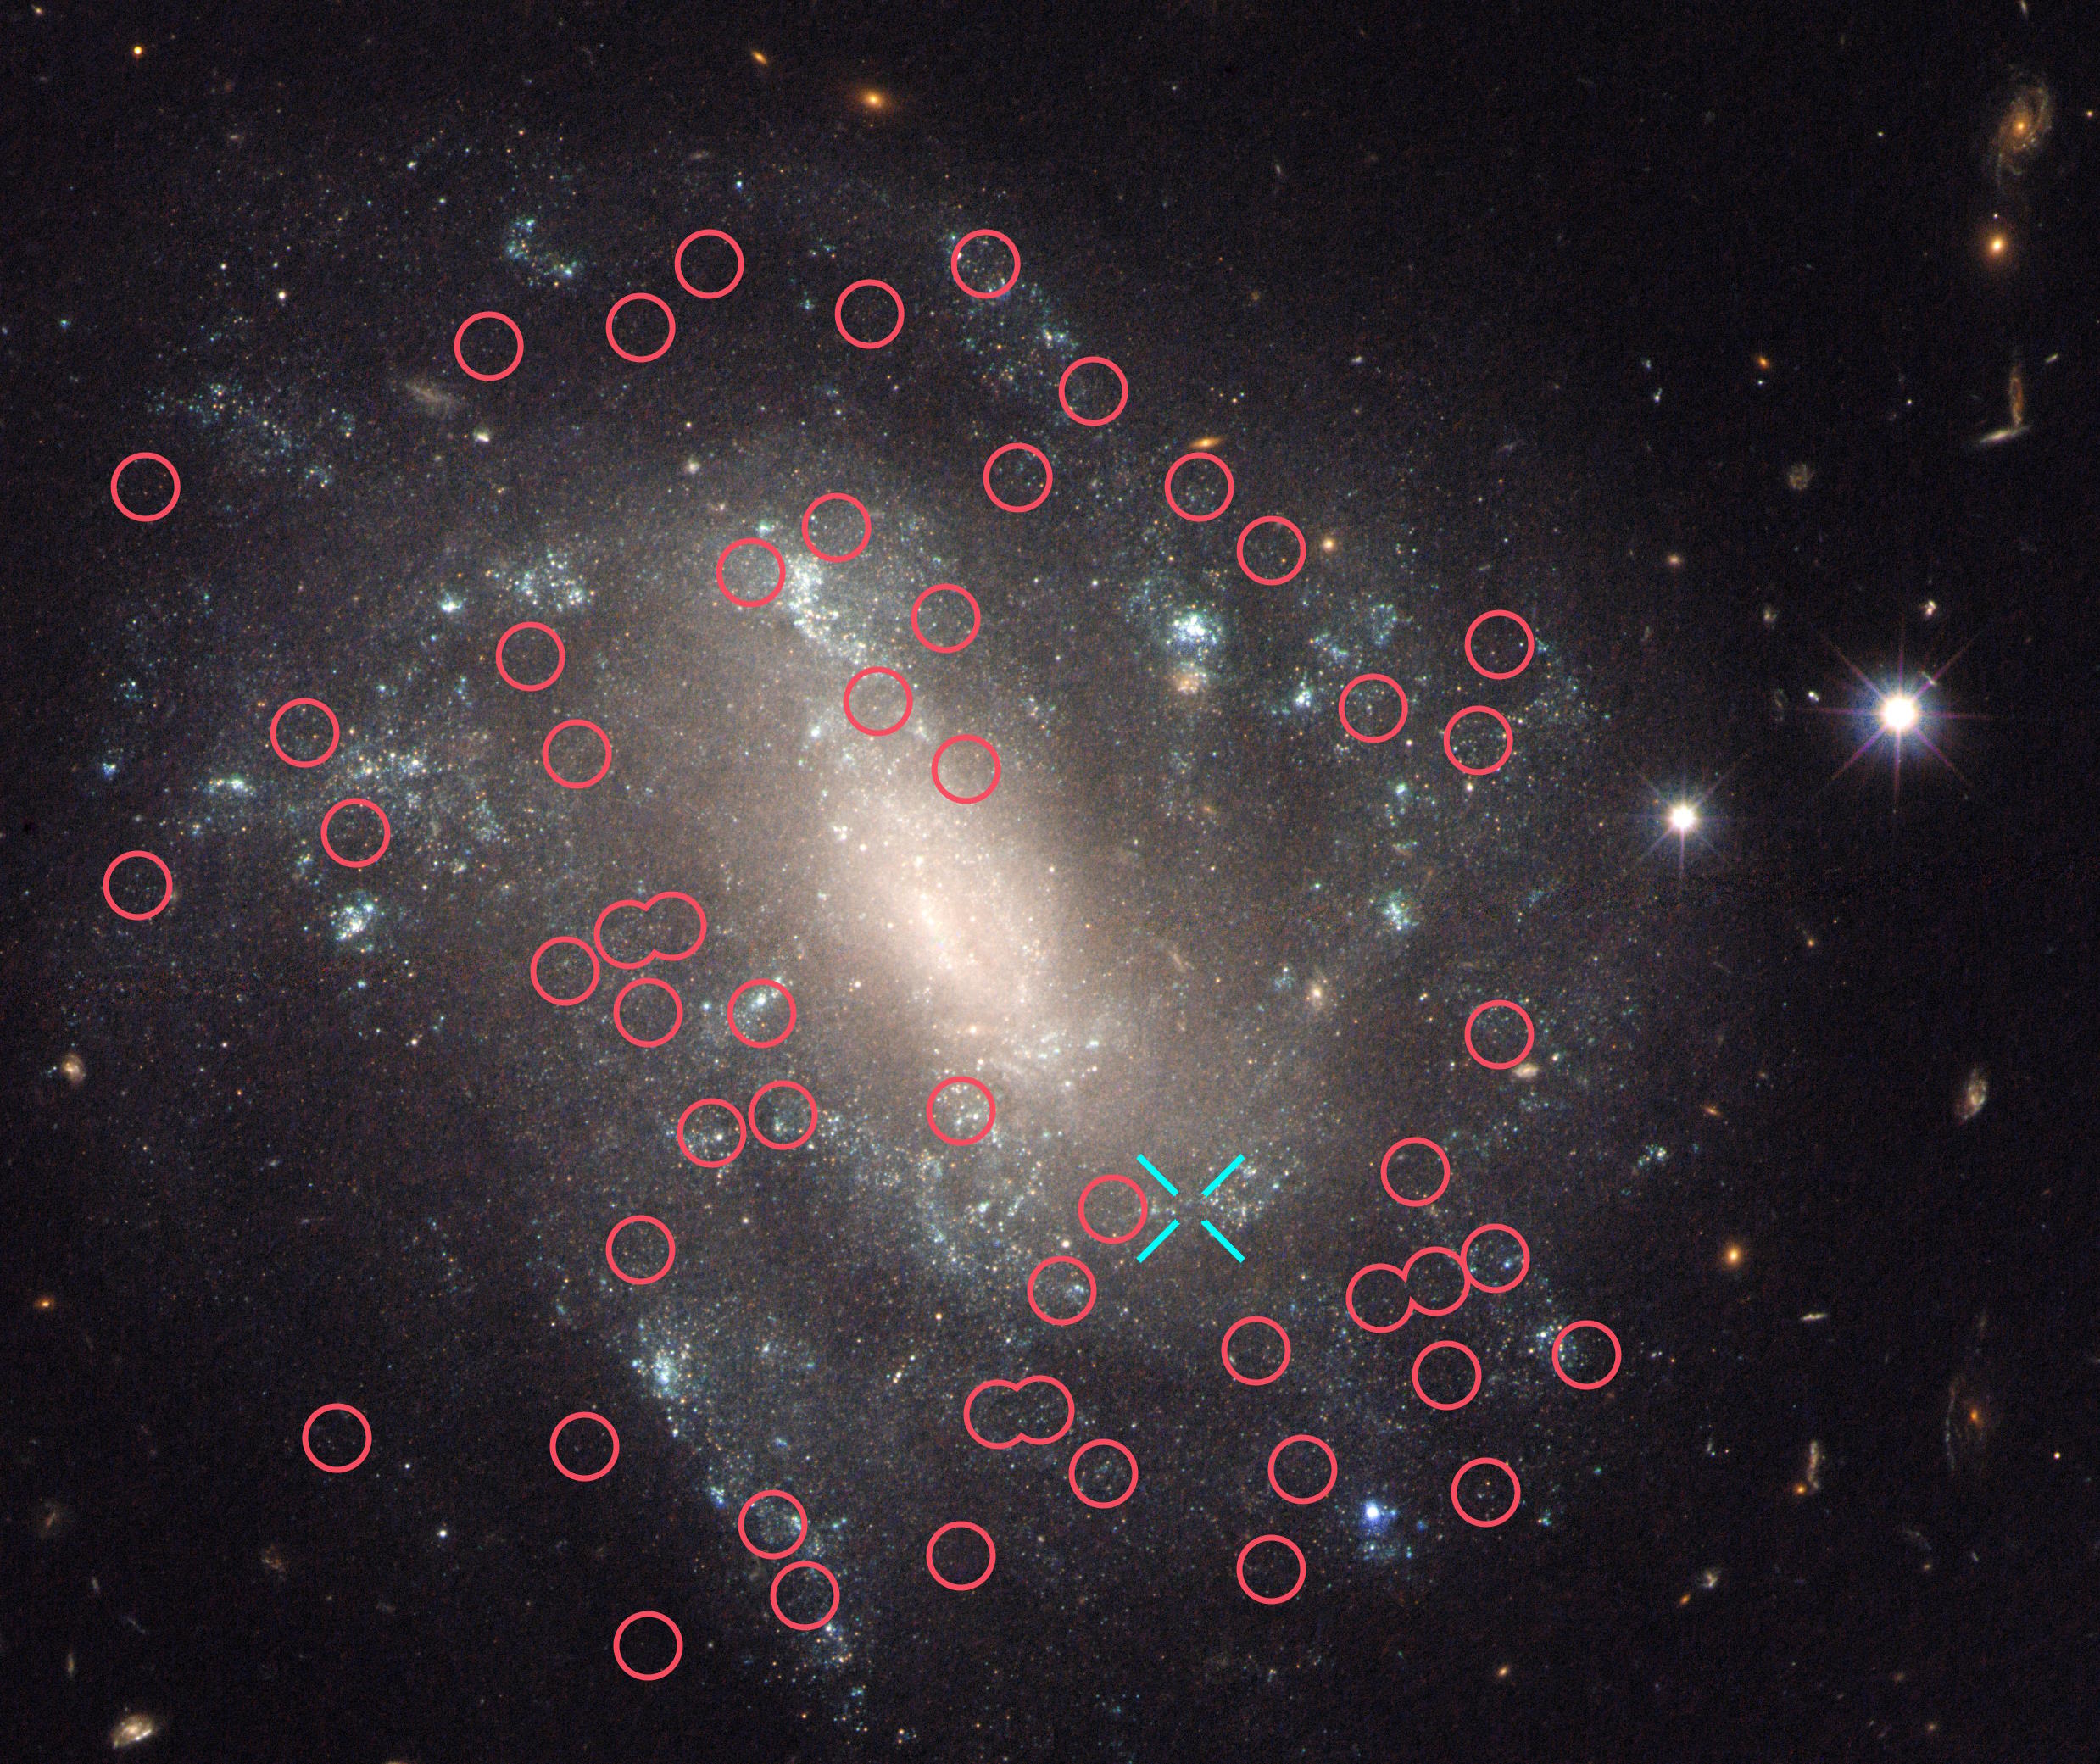
We’re going to return to this second step in just a minute, so don’t forget about it, but let’s be aware that there’s also a third step that takes us into the very distant Universe: we are going to measure some property of those more distant galaxies — either an overall property of those galaxies or of some standardized “event” that happens within those galaxies — that also contain one (or more) of those second-step distance indicators. Then, when we measure that same property in even more distant galaxies:
- such as velocity dispersion, allowing us to leverage the Tully-Fisher relation,
- or by measuring how the surface brightness of the galaxy fluctuates over time, allowing us to use the Tonry-Schneider SBF relation,
- or by choosing galaxies that have had recently observed type Ia supernovae explode within them, allowing us to use those type Ia supernovae as a distance indicator (this option reliably takes us to the greatest extragalactic distances),
that will take us all the way to the edge of the proverbial distance ladder.
There are two “keys” to making your distance ladder measurements as robust as possible. One is by choosing distance indicators — i.e., your choice of which method you use in the second and third steps — that are robust and whose validity is well-established over a great variety of distances. The more reliable your distance indicator is, and the less intrinsic variability there is among objects within that class, the fewer objects you need to get a reliable distance measurement.
But the second key to making a robust, high-quality distance ladder are these two related aspects: reach and overlap. A good distance indicator will be useful over a wide variety of distances, including out to greater distances than other comparable indicators. Lots of people build distance ladders out of Cepheids while very few people build them out of RR Lyrae stars, even though they’re both similarly well-understood classes of stars that are both intrinsically variable.
The reason for this is simple: Cepheids are much brighter than RR Lyrae stars, and can be observed, individually, at much greater distances than RR Lyrae stars can. Their reach, as far as “to what distances can they be observed in other galaxies,” is far greater. Similarly, type Ia supernovae, although relatively rare, can be observed out to distances of many billions of light-years, whereas properties like Tully-Fisher (based on velocity dispersion) or surface brightness fluctuations struggle to get out past a couple of billion light-years. Reach, alone, would be sufficient to explain why parallax plus Cepheids plus type Ia supernovae have been the “gold standard” in distance ladder measurements for many years now.
But there’s also the aspect of overlap: how much overlap is there between the second and third steps in the distance ladder method? The more galaxies you have that contain “one or more stars from step two” and “at least one good indicator from step three,” the sturdier your links are between these different rungs on the distance ladder.
Put simply: the more objects you have that allow you to “tie” different “rungs” of the distance ladder together, and out to greater and greater distances, the more confident you can be in the results that it gives you. If you only have a few objects that tie together various rungs, such as a few galaxies with both
- individually identifiable stars of a particular type,
- and also that have been host to at least one well-measured type Ia supernova,
that method is going to be subject to greater errors and uncertainties than a method that has a greater number of galaxies with both classes of relevant objects within them.
For years, this was a critical weak point in all distance ladder measurements. Only eight years ago, in 2016, there were a mere 19 galaxies that housed both identifiable Cepheids and also were host to a type Ia supernova. However, that number more than doubled between 2016 and 2022, making the “parallax + Cepheid + type Ia supernova” distance ladder incredibly robust, which is why, when that team claims to measure the expansion rate to be ~73 km/s/Mpc with a total uncertainty (including both statistical and systematic errors) of just ~1%, it’s definitely worth paying attention to.
The new result that’s got everyone hyped up?
Sure, they get ~68 km/s/Mpc using the J-band observations of asymptotic giant branch stars (JAGB) measurements combined with type Ia supernovae, but their claimed uncertainty of ±1.85 km/s/Mpc is only statistical, and doesn’t include systematic errors (which are likely to be around ± 4 km/s/Mpc). Furthermore, compared to the 42 overlapping “points” between rungs two and three on the distance ladder, they only have eight. These eight overlaps are all part of the sample of 42 used by the SH0ES team, whereas Cepheids have been used to provide reliable distances to an additional 34 galaxies that also have been observed to contain type Ia supernovae. There is no reason to believe that the eight galaxies used by the team competing with the SH0ES team (which has 34 additional ones) represent a better, more reliable sample than the more comprehensive one that’s part of a larger, more robust study.
A fair accounting of the different assumptions, choices, and sample selections that went into the JAGB-team’s study, compared to the parallax + Cepheids + type Ia supernova study by the SH0ES team (which has the vaunted ~1% total error), reveals that those choices bias their results to values that are lower by 4.8 km/s/Mpc compared to the SH0ES team. That accounts for practically the entirety of the difference between ~68 km/s/Mpc and ~73 km/s/Mpc. But the big lesson is this: when you don’t account fully and properly for your systematic errors, you can and should expect that your results won’t necessarily match up with studies that do account for them fully and properly.
That isn’t to say that using JAGB stars (or any and all other complementary methods) as a distance indicator isn’t an exciting and promising new venture as far as measuring the cosmic distance ladder goes. It’s vitally important that we make many different high-quality measurements of the Universe — using as many different methods as possible — in order to ensure that there are no hidden or unseen biases that are specific to any one method. But it’s also important that we be fully honest and transparent about our errors and uncertainties, and about the limitations and assumptions that go into our data sets. The Hubble tension is still very real, and is no closer to being resolved by these new studies. If anything, they only highlight just how problematic this puzzle really is for modern cosmology.