10 insights about the expanding Universe from a Nobel Laureate
- One of the deepest puzzles in modern cosmology is the Hubble tension: the fact that two different classes of method for measuring the expanding Universe give different, and mutually incompatible, answers.
- Recently, a few studies have come out suggesting that this “tension” over the expanding Universe may not be real, and that a new distance ladder method may be able to eliminate the tension entirely.
- However, that’s not at all what the data shows or indicates, as Nobel Laureate Adam Riess explains. Here are some deep insights that everyone ought to be aware of.
One of the most surprising discoveries in all of astronomical history occurred nearly a full century ago: when we discovered that the distant galaxies in our Universe aren’t stationary, but are mutually receding from one another. This realization first came about in 1927, and has since been interpreted to mean that the Universe is expanding, with the space between galaxies, galaxy groups, and galaxy clusters “stretching” to greater and greater distances as time continues onward. For most of the 20th century, the main quest of cosmology was to measure two parameters: how fast the Universe was expanding right now, and how that expansion rate changed and evolved over time.
In the late 1990s and early 2000s, both of those questions were finally answered with sufficiently good data. Our Universe was expanding at a rate of around 72 km/s/Mpc, with an uncertainty of only around 10%, and the recession speed of a distant galaxy wasn’t decreasing as we expected, but was actually increasing as time goes on. The latter discovery was a tremendous surprise, and compelled us to add a new species of energy — dark energy — to our conception of the Universe. In 2011, the Nobel Prize in physics was awarded for exactly that discovery, with Saul Perlmutter, Adam Riess, and Brian Schmidt sharing the accolades.
However, in the time since then, a new puzzle over the expanding Universe has arisen, and it has swiftly become perhaps the most confounding conundrum in cosmology today: the Hubble tension.

The Hubble tension arises from the fact that there are two fundamentally different classes of method for measuring how quickly the Universe is expanding today. You can either:
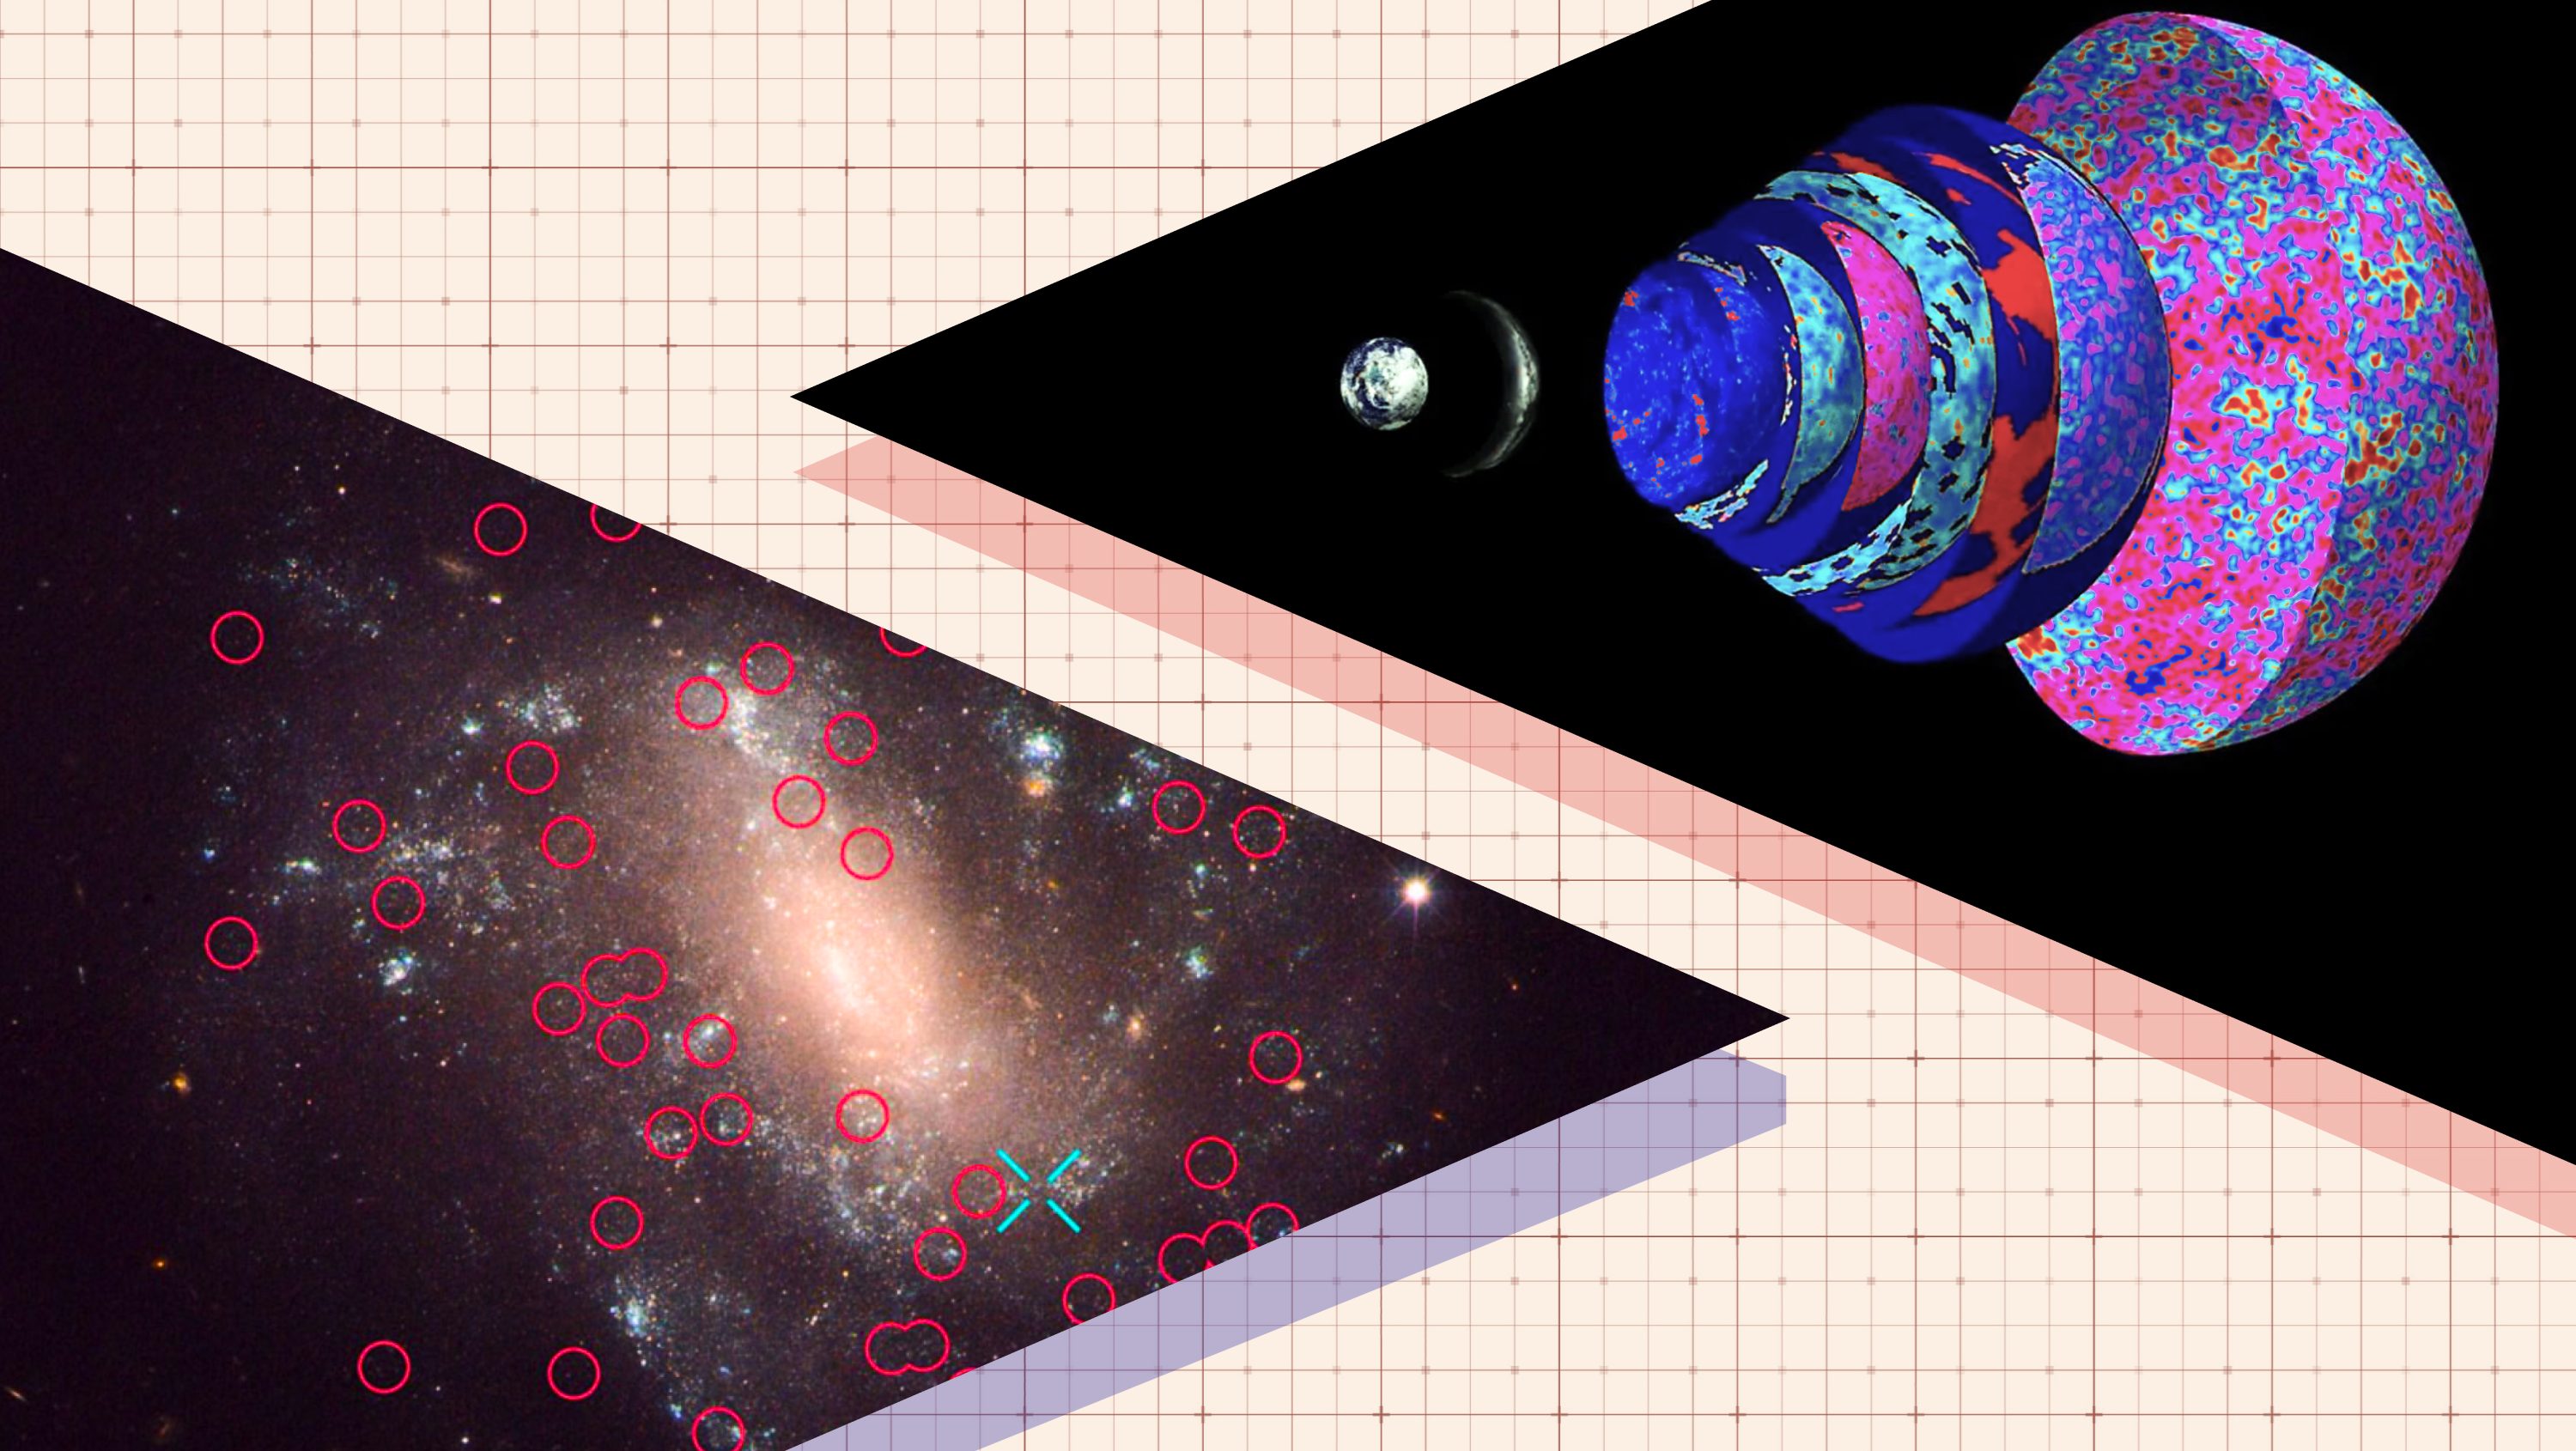
- begin nearby, by measuring stars in our galaxy directly, then measuring those same types of stars in a different galaxy, and then using some property or object within those galaxies to extend our reach to the distant Universe,
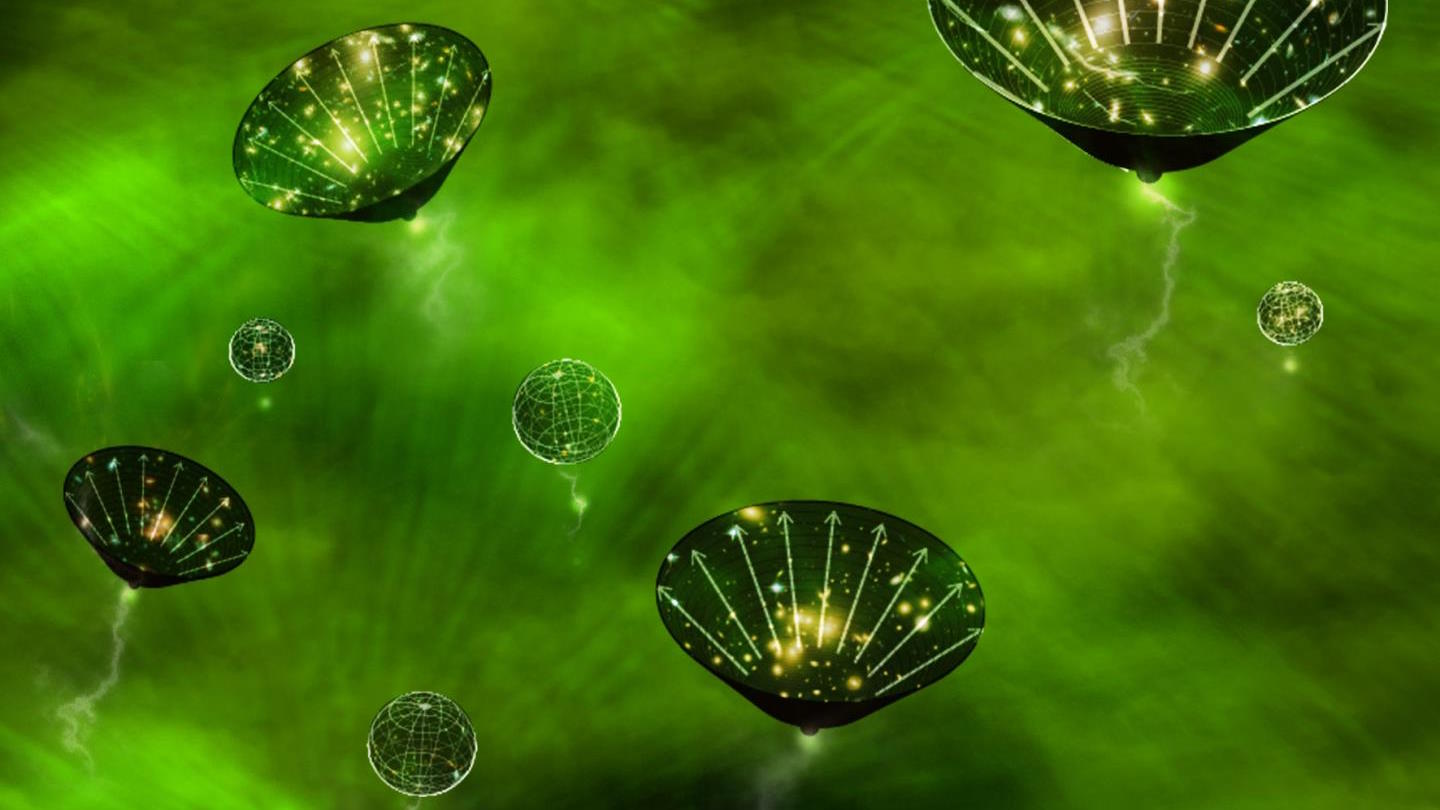
- or you can begin far away, shortly after the Big Bang, with an early relic signal that was imprinted onto the Universe, and then measure how that relic signal has evolved over time as the Universe has expanded.
The first method is known as the distance ladder method, and reliably yields an expansion rate of 73 km/s/Mpc, with the best (lowest-uncertainty) method providing that value to a precision of about ~1%. The second method, meanwhile, is known as the early relic method, and yields a value of around 67 km/s/Mpc, again with an uncertainty of just ~1%.
However, a recent study has claimed to find a value of 68 km/s/Mpc for the expansion rate while using the distance ladder method; a result that appears to “resolve” the Hubble tension by bringing the results from the two various methods into agreement. I took an in-depth look at this issue for myself (and you can read that analysis here), concluding that the study had some very important flaws — unquantified systematic errors, a sample selection bias, a small sample size, etc. — that it did not address, and that the Hubble tension remained as strong as ever.
However, my professional ability to evaluate such matters has its limits; I’m not an expert when it comes to observational cosmology, although I know quite a few people who are. It was with that goal in mind that I contacted Nobel Laureate Adam Riess, who agreed to do a question-and-answer with me about exactly this topic. Here are the fruits of that exchange.
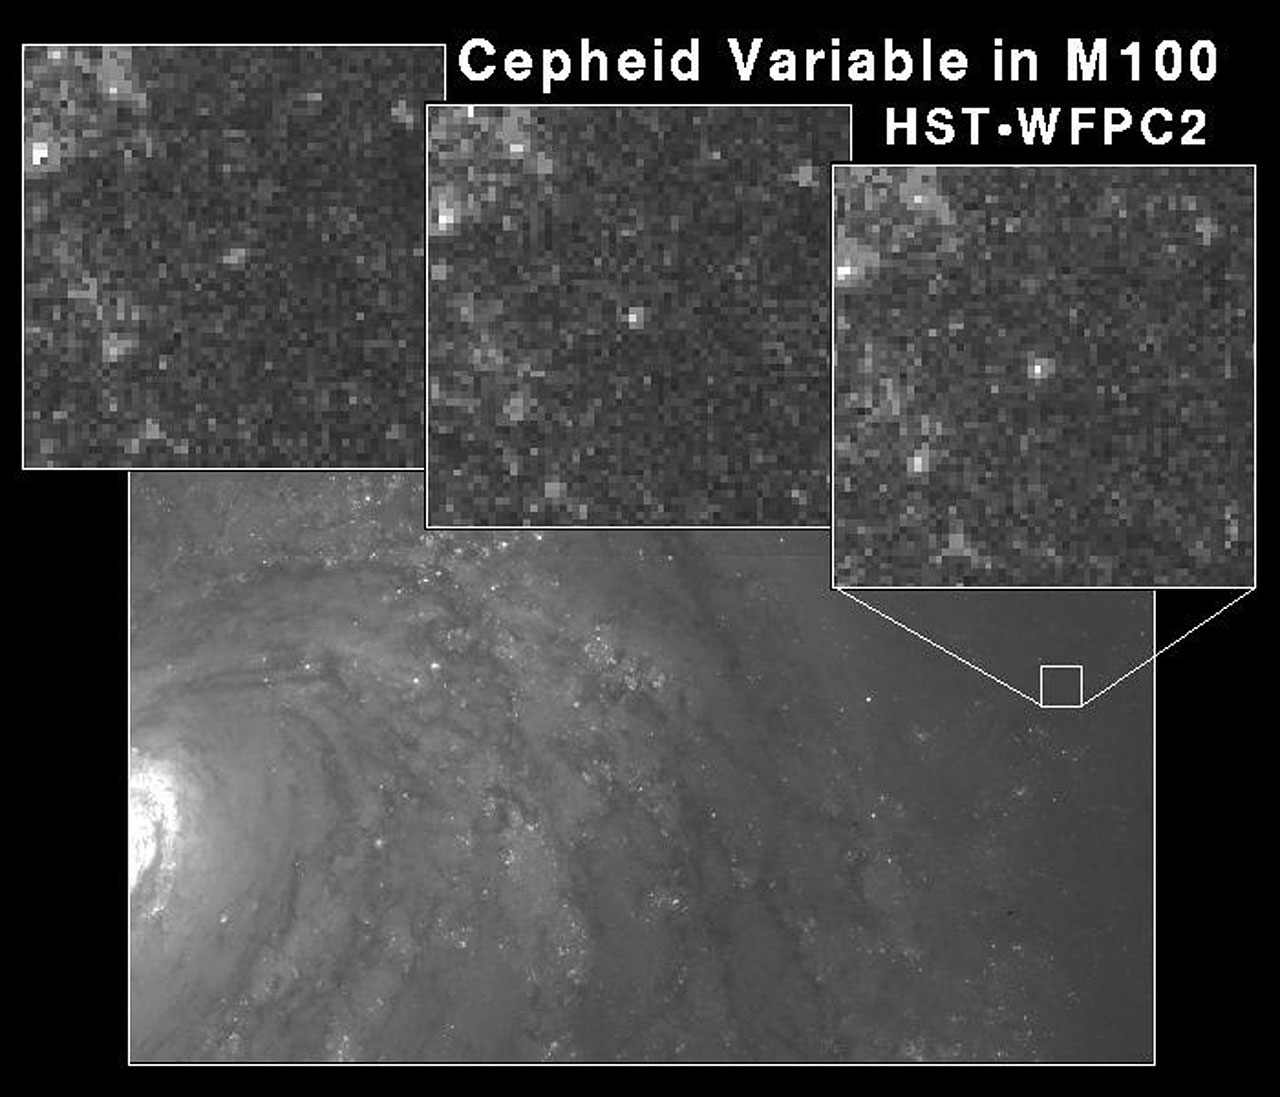
Ethan Siegel (ES): Back in the late 1990s and the early 2000s, two important advances occurred in observational cosmology. One of them was that, primarily using Cepheid variable stars, we were able to precisely determine the expansion rate of the Universe: 72 km/s/Mpc, with an uncertainty of just 8 km/s/Mpc on that number, which stood in stark contrast to two dominant narratives that the Hubble parameter was either 50-55 km/s/Mpc or ~100 km/s/Mpc. Can you talk about how monumental that discovery was, including what it meant for our understanding of how the Universe was expanding and what it taught us about our cosmic past?
Adam Riess (AR): The 1990’s really started the era of “Precision Cosmology.” The Hubble Space Telescope gave us a new superpower, the ability to resolve individual Cepheid variable stars in galaxies tens of megaparsecs (30-60 million light years) away. Cepheids were then, and still are, the gold standard of distance measuring tools. Two teams led efforts to measure the Hubble constant (the expansion rate of the Universe), using Cepheids to construct distance ladders between our local neighborhood and deep, expanding space.
By the end of the early 2000s, the uncertainty in the rate at which the Universe expands, the Hubble constant, had been cut by two-thirds: to a respectable 10%. The new result was toward the middle of the prior range and was a good fit to our developing new picture of the Universe. It taught us that we lived in a Universe that was indeed older than the oldest stars in it, which might seem obvious in hindsight, but was not clear at the time.
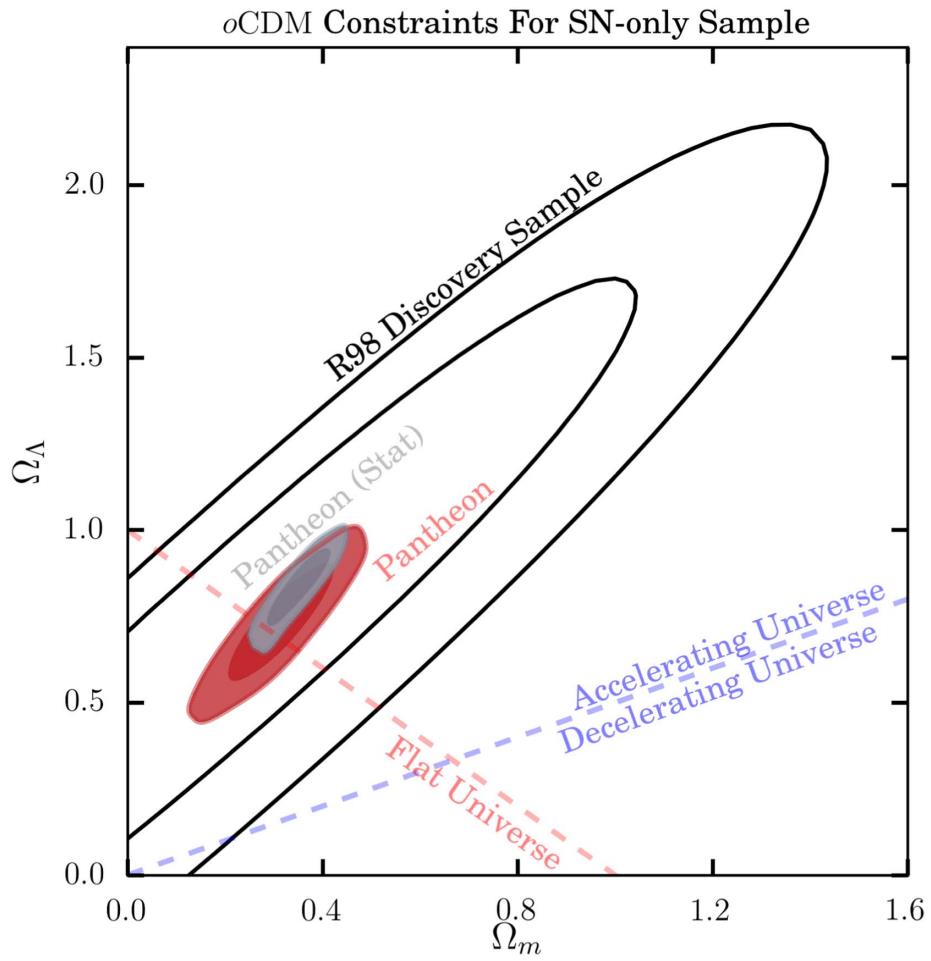
ES: The other was that, using distant type Ia supernovae, we were able to determine that the rate of expansion wasn’t continuing to slow down as though the Universe were made exclusively of matter and radiation, but that the expansion itself was accelerating, indicating the presence of a new species of energy in the cosmos: dark energy. I know that it took many years of accumulating data points before your team drew the conclusion that there was a new species of energy present. What was it like behind-the-scenes when you realized that this data couldn’t be reconciled with a matter-and-radiation-only Universe?
AR: Frankly it was scary. Scientists by nature are cautious — there are a million ways to get the wrong answer. On the other hand, there are very few ways to get it right. Then you are doing something no one has done before, so there’s no answer key in the back of the book to check whether your answer is right or wrong. So, when you get a surprising result like we did, that usually means you did something wrong.
However, if you are too cynical and decide everything surprising is wrong, you literally cannot discover anything new. So we spent a lot of time double checking our work until we knew we were either right or wrong for an interesting enough reason to publish our findings. Following the data rather than your beliefs is how surprising discoveries are made, and it’s amazing that it has held up for 25 years.

ES: In the time since, many “alternative” explanations to dark energy — including photon oscillations, novel types of dust, and evolving environments for type Ia supernovae — have been offered up, but have conflicted with the improved, more comprehensive data. Today, we have over 1000 type Ia supernovae discovered at a wide variety of distances. Coupled with measurements of the acoustic scale at a variety of distance scales, these data sets make an overwhelming case for dark energy’s presence and abundance: a discovery that you were awarded the Nobel Prize in Physics for in 2011. In just one generation, we’ve gone from not knowing that dark energy existed to it being broadly accepted as the dominant form of energy in our Universe. What was it like to be a part of that revolution?
AR: Cosmology has always addressed big questions, literally the biggest. What is the Universe made of? How did it start? How long has it been around? How will it end? These questions had been around a long time when I started, so I didn’t think that would change. So I was fortunate to witness a truly revolutionary period in cosmology. Take the discovery of dark energy, which appears to make up 70% of our Universe. Only once in the history of humankind can we literally discover most of the Universe! This was also the period when our ability to see the Universe was most improved, from space telescopes to gravitational wave detectors, it’s been exhilarating to see and be part of! As a scientist who entered the field with enormous curiosity, it has been and continues to be my passion to pursue the answers to these larger than life questions.
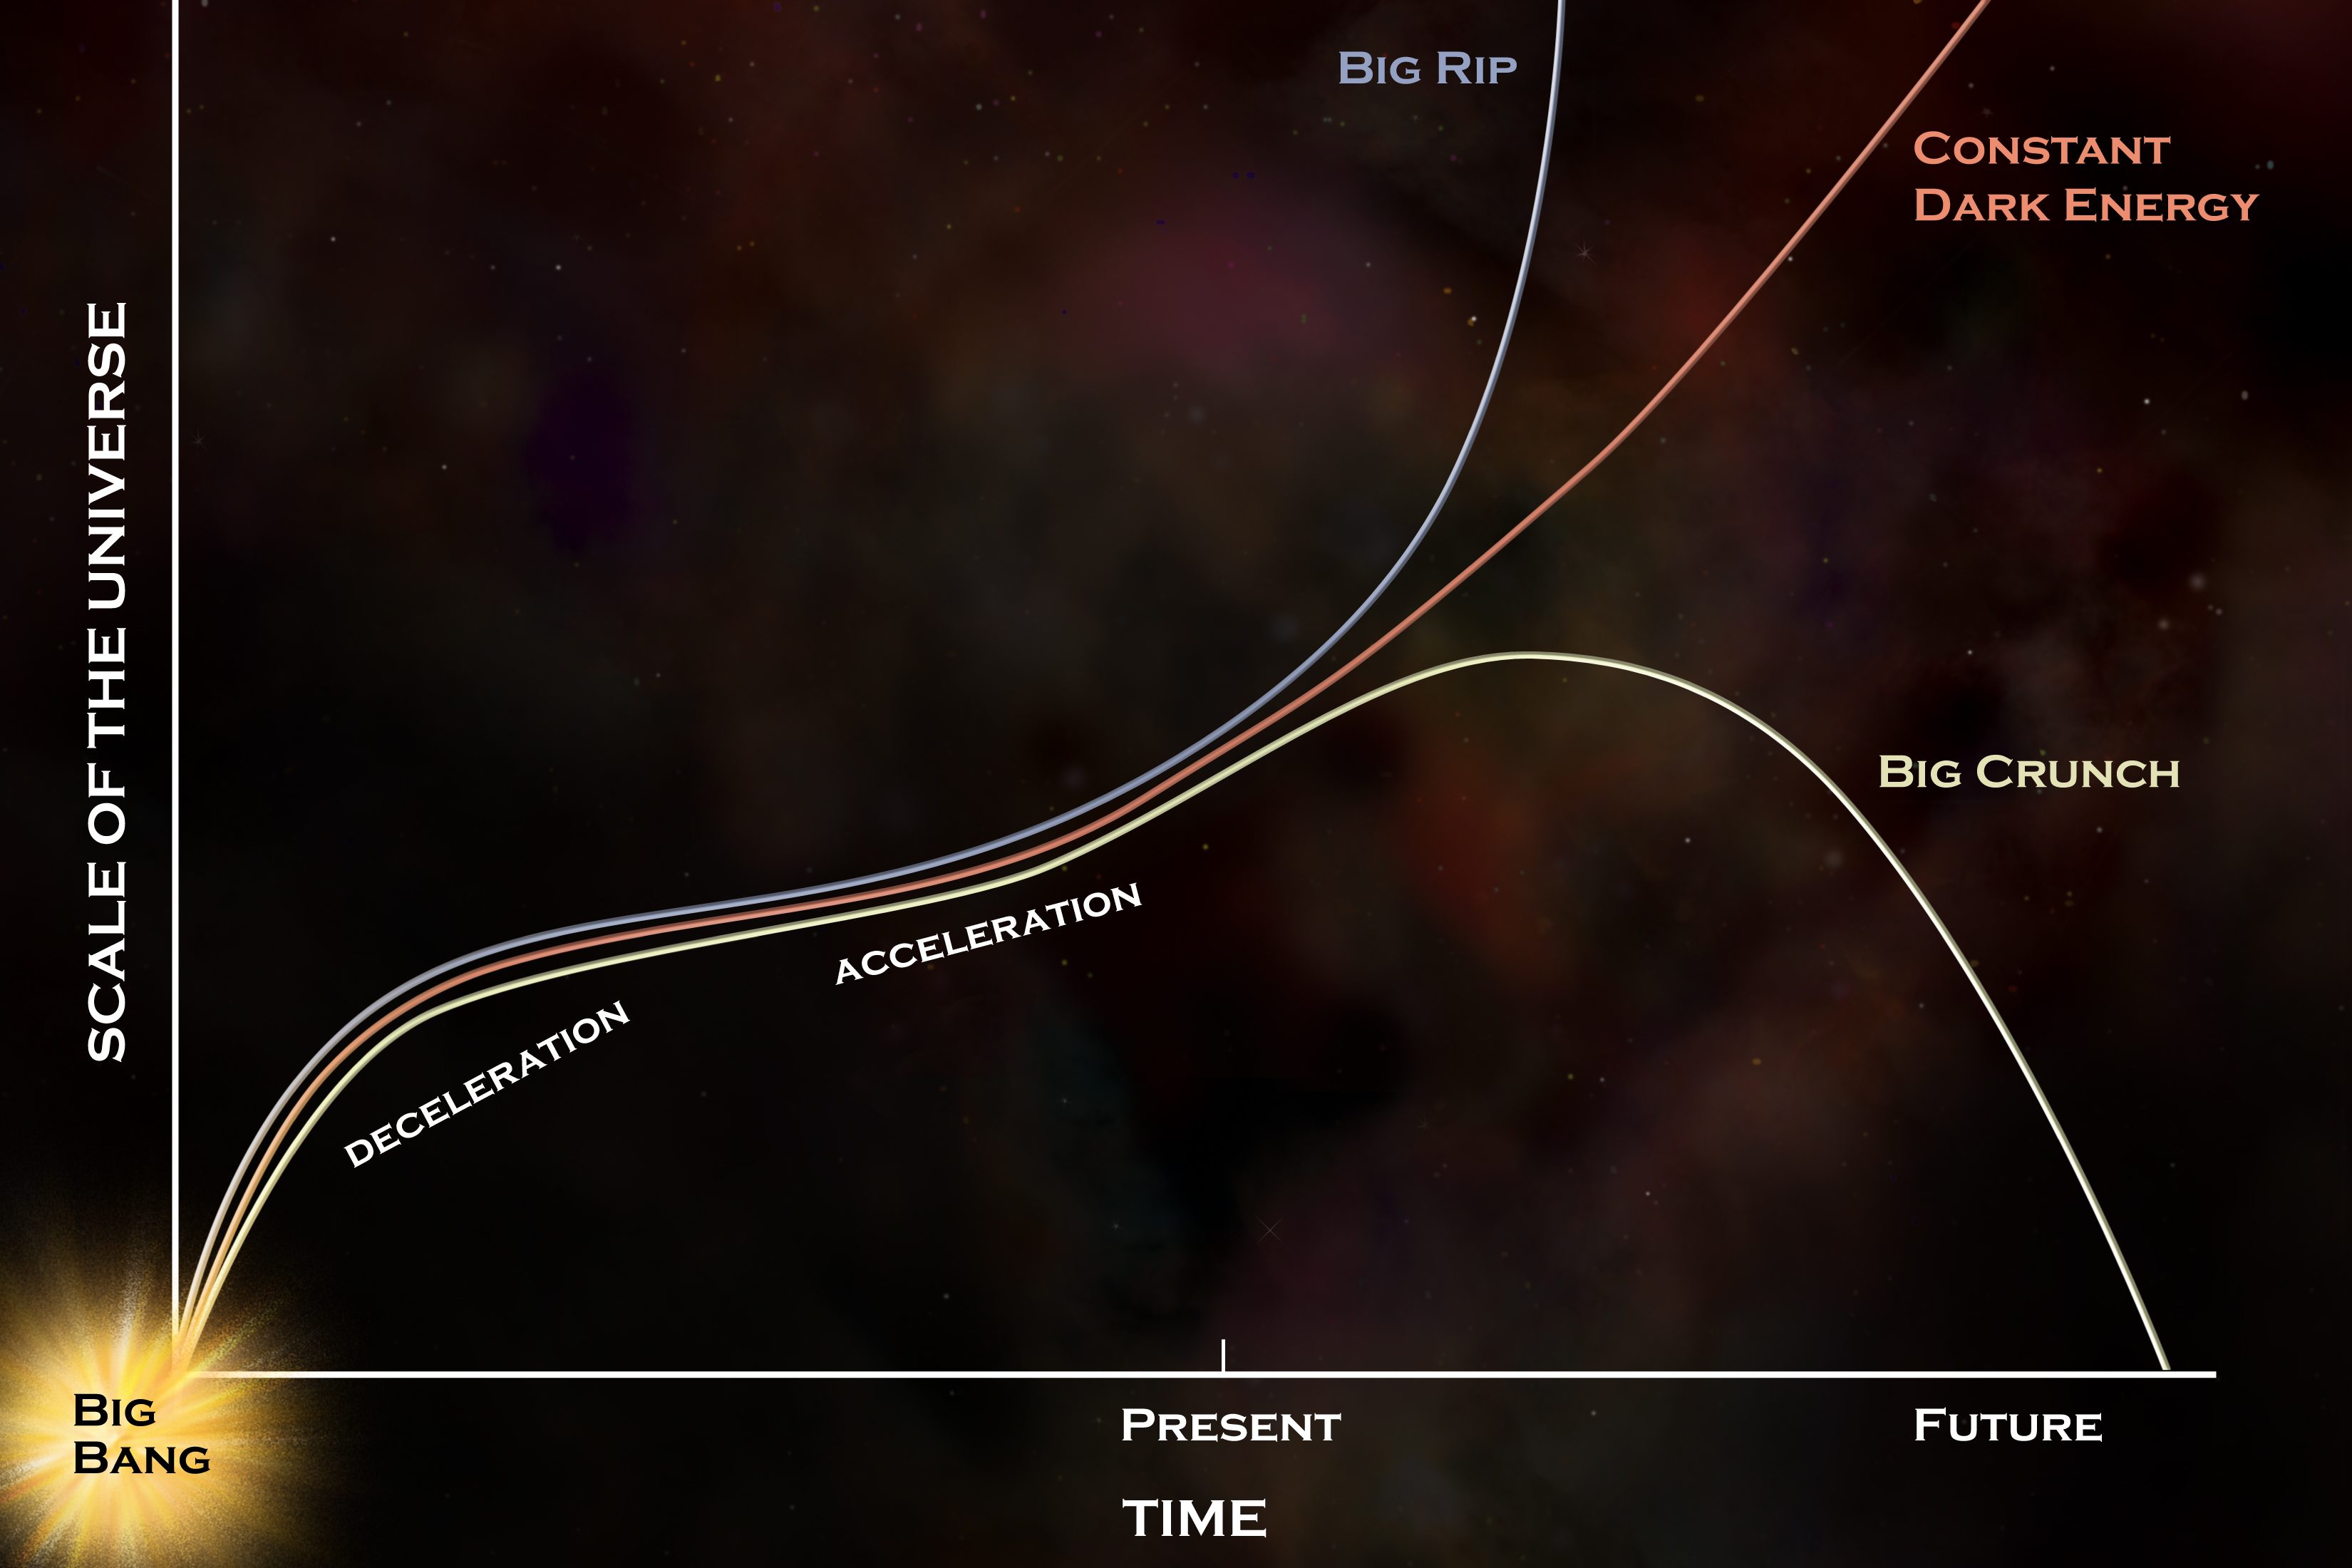
ES: As is so often the case, new discoveries and improved measurements may have provided answers to older questions, but have paved the way for us to ask new, deeper ones. One tantalizing possibility that the data now indicates is that dark energy may not be a cosmological constant, but in fact may be evolving. As the co-discoverer of dark energy, what are your thoughts on the evidence for evolving dark energy, and what would it take for you to convince yourself that dark energy doesn’t possess a constant energy density?
AR: Combining all measurements we have of the cosmic microwave background, supernovae and large-scale structures hints that dark energy may be fading in strength. It seems a little like déjà vu because we think a similar thing may have happened after the Big Bang when a type of dark energy inflated the Universe then faded away.
However, the confidence threshold for this conclusion has not yet been reached. The good news is that we do not need to engage in too much speculation since the data which hints this way is about to dramatically improve in the next couple of years. I can wait for that. Also, new space telescopes are coming online — like NASA’s Roman Space Telescope — which will greatly improve our picture of dark energy.
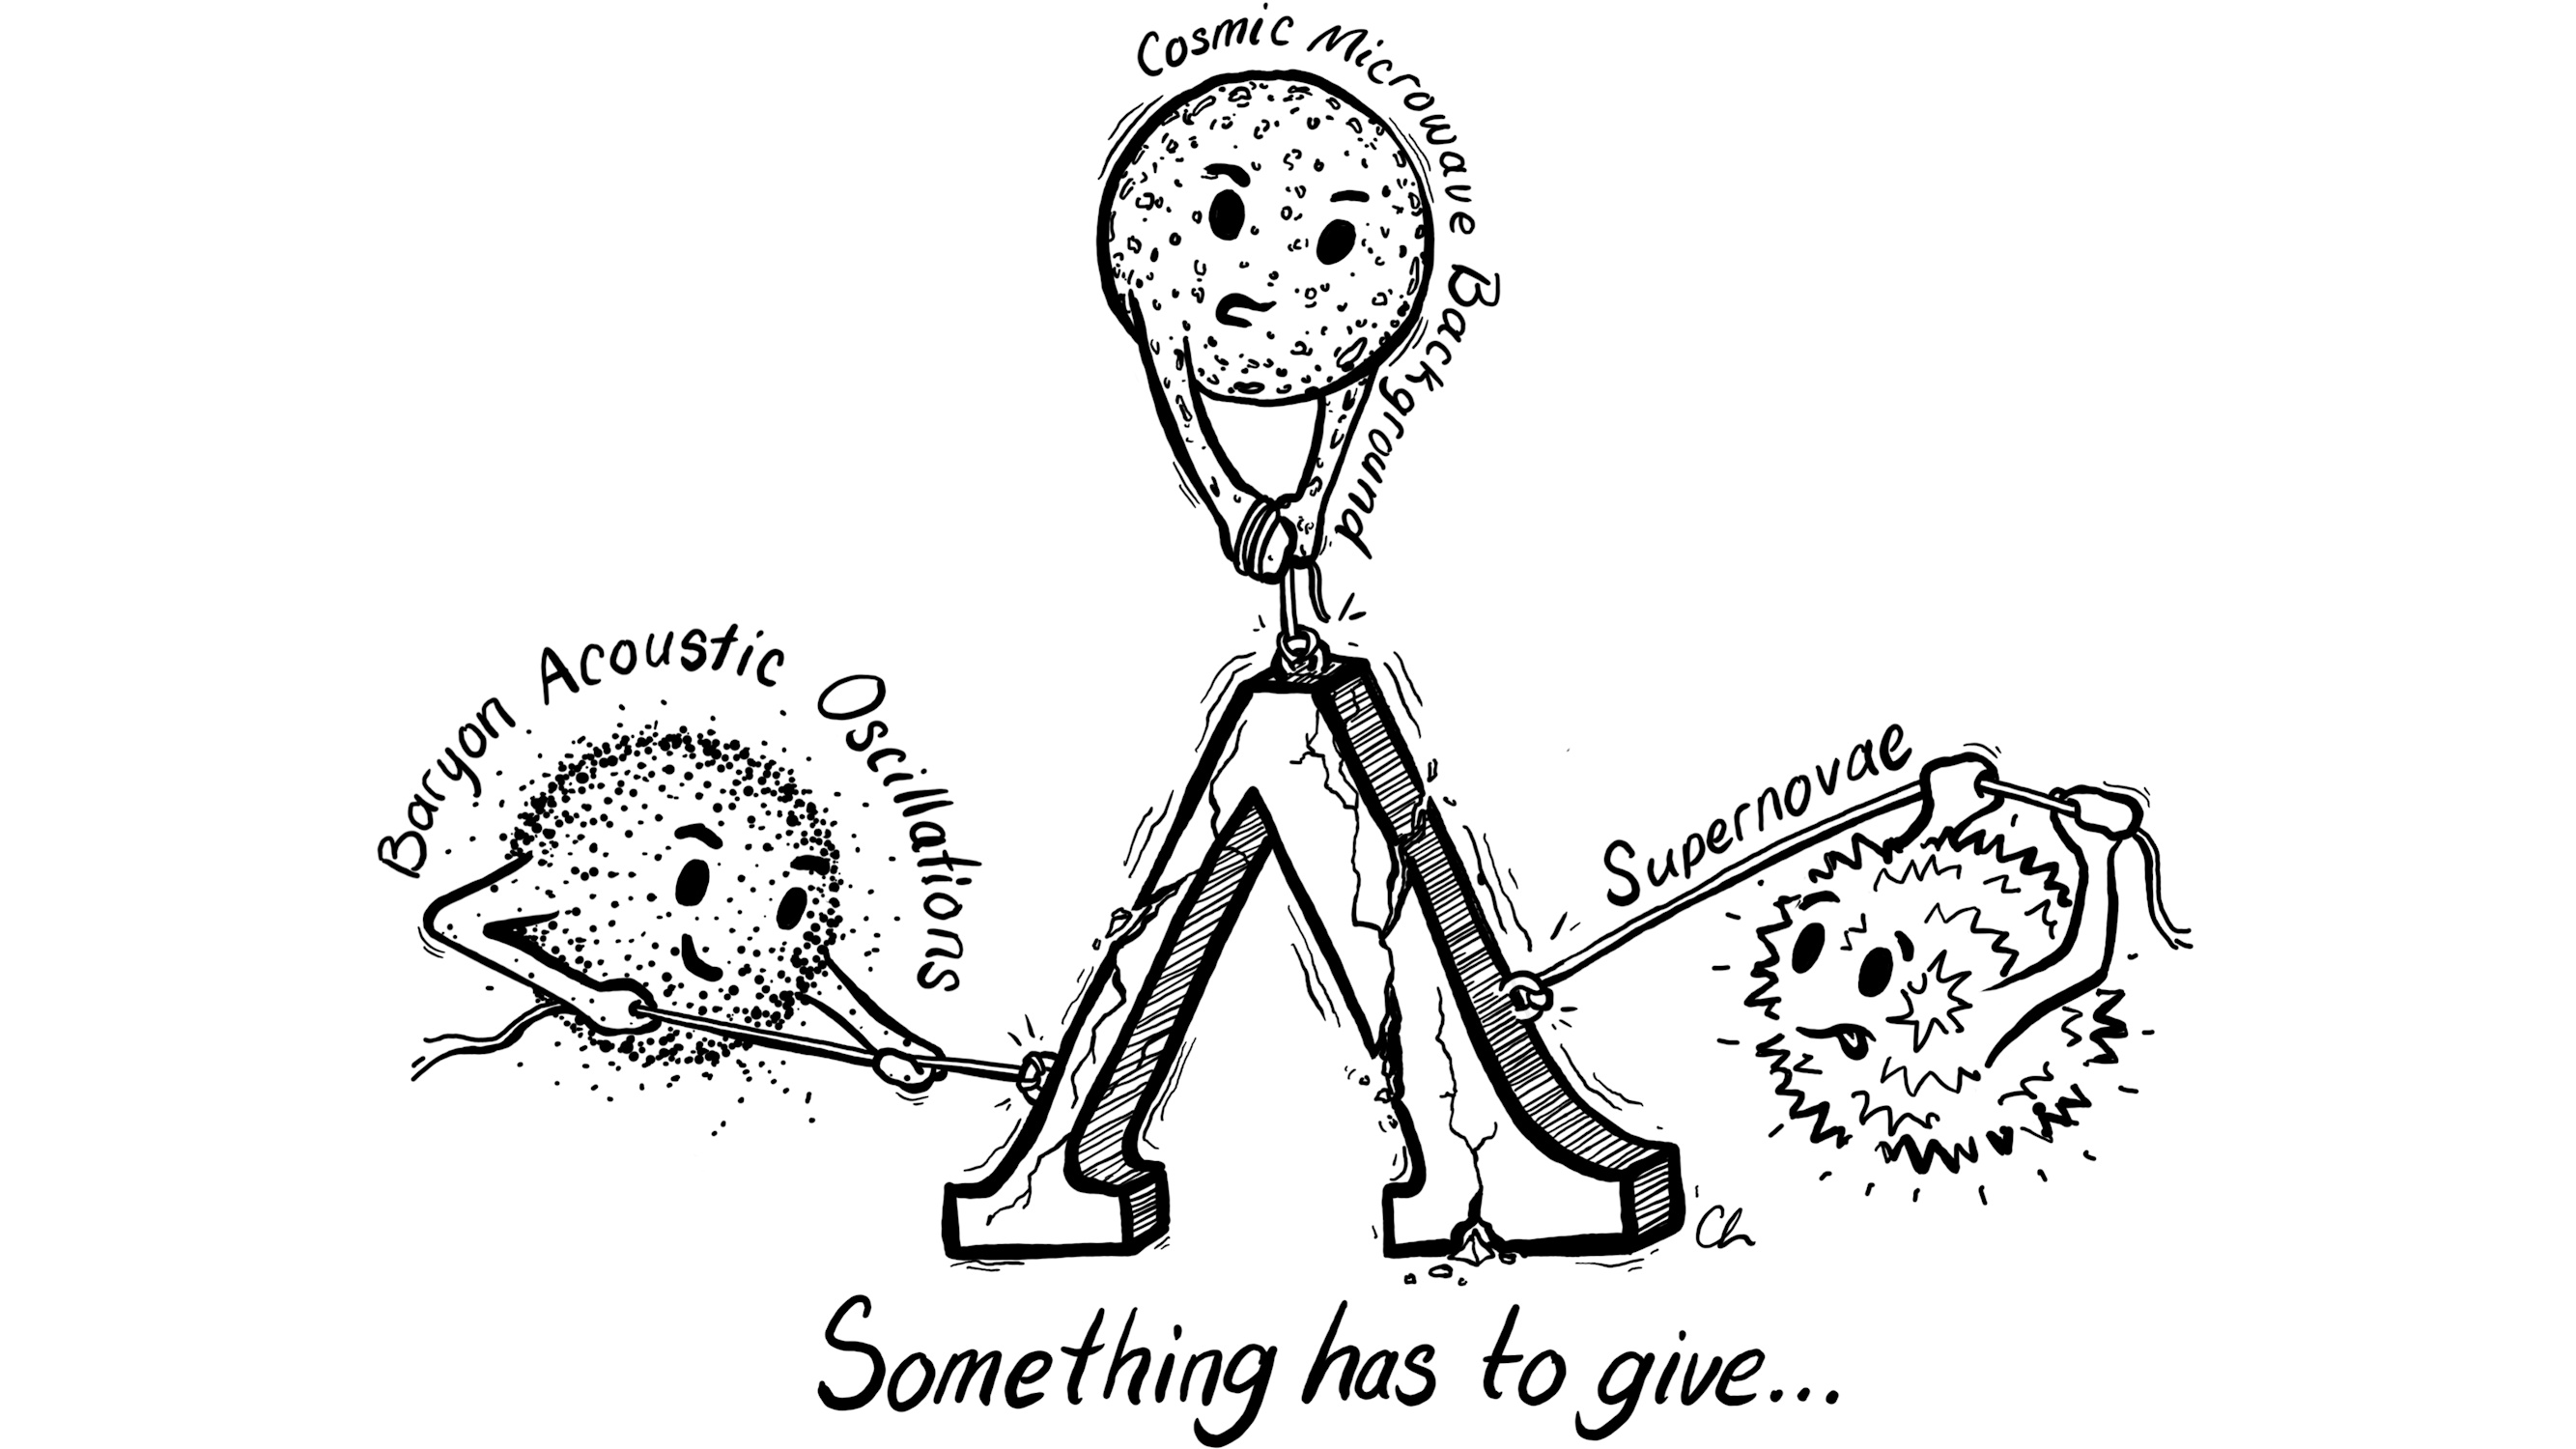
ES: Another puzzle that has arisen recently is that two different classes of measurements — with one class using the cosmic distance ladder to start nearby and then progressively jump to greater and greater distances, and the other class using baryon-photon oscillations imprinted in the early Universe and following their evolution forward in time — give very precise, but very different, results for the expansion rate of the Universe today. For the “distance ladder” method, that value appears to be around 73 km/s/Mpc, but for the “early relic” method, we get only 67 km/s/Mpc. Both sets of measurements report only about a ~1% uncertainty on their values, but they differ from each other by about ~9%. What do you think this mismatch is telling us about the Universe?
AR: It is telling us that there is something we do not understand. We often say when you know something well, you know it “forward and backward.” But in this case, when we use our understanding of the Universe to go forward or backward in time, we cannot make the ends meet. This problem has lasted a decade and goes by the name of the “Hubble tension.”
Whatever is causing it, it is not obvious to either scientists like me who make the measurements or to theorists who speculate and then calculate new ways to connect the beginning and present state of the Universe. Some see this as a problem. I think if we follow the data, it’s a learning opportunity. These are the kinds of puzzles scientists hope for.
ES: Many people over the years — including me, which I’ll admit — have questioned whether this discrepancy couldn’t just be the result of having unidentified errors in making these distance ladder measurements, including:
- in making parallax measurements of specific types of stars,
- in measuring those same types of stars in nearby galaxies,
- in the (admittedly small) sample of galaxies that contain both those critical types of stars and also that contain type Ia supernovae,
- and in inferring the distances to those nearby galaxies.
However, an enormous number of sources of error and uncertainty have been improved in recent years. Can you tell us about the journey to reach a point where we can finally declare that this mismatch between different methods of measuring the expanding Universe (distance ladder vs. early relic) has reached the “gold standard” for statistical significance?
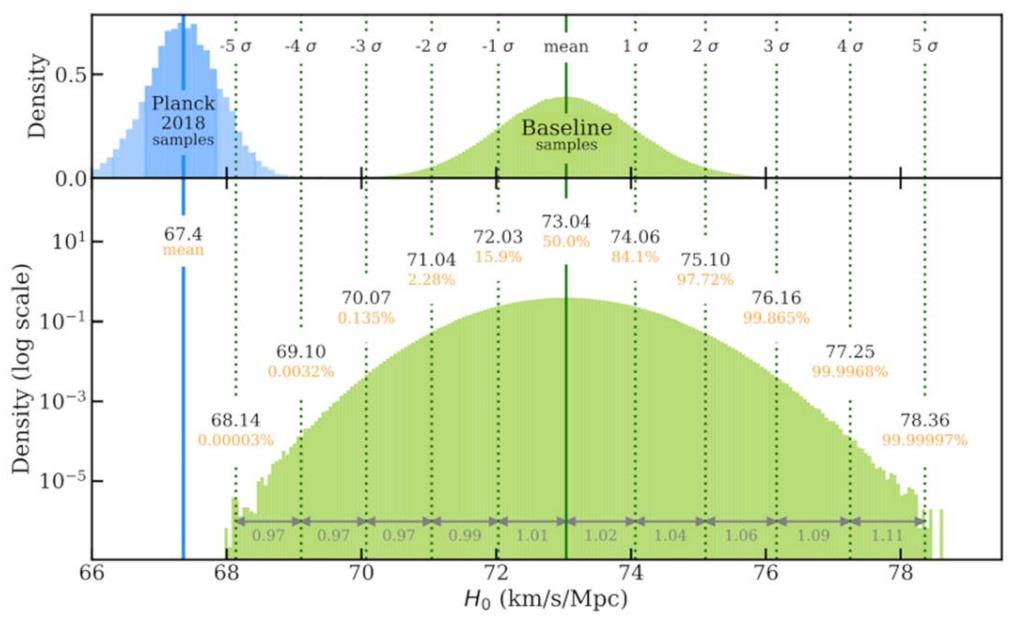
AR: Over the last decade, the significance of the discrepancy has grown. It was twice the margin of error 10 years ago when the new Planck CMB data first came out, a threshold we call a “curiosity.” After several more years of increasing the sample of supernova hosts observed with Hubble, it became three times the margin, what we call a “tension,” hence the name. In the last 5 years the local measurements improved, supported by the ESA Gaia mission parallaxes (a leap in parallax measurements), another doubling of the Hubble sample, more surveys of distant SNe, new observing techniques, etc., so that as of a couple of years ago, the difference is more than 5 times the margin of error.
This is the threshold when scientists say, “This is not a fluke, something has been found!” In parallel, there has been an enormous effort by the community to scrutinize the results (as they should), replicate them, and see if there is any consensus of a specific problem with the measurements. At this point, the Hubble tension is very clear and strong unless you are willing to discard a lot of data, cherry-pick studies or samples while excluding others, posit an unknown problem (without a testable hypothesis), or invoke an even weirder scenario, that the Universe is different near us than elsewhere. I think these are all scientifically bad choices. I think the Universe is smarter than we are, so we are probably better off believing it.
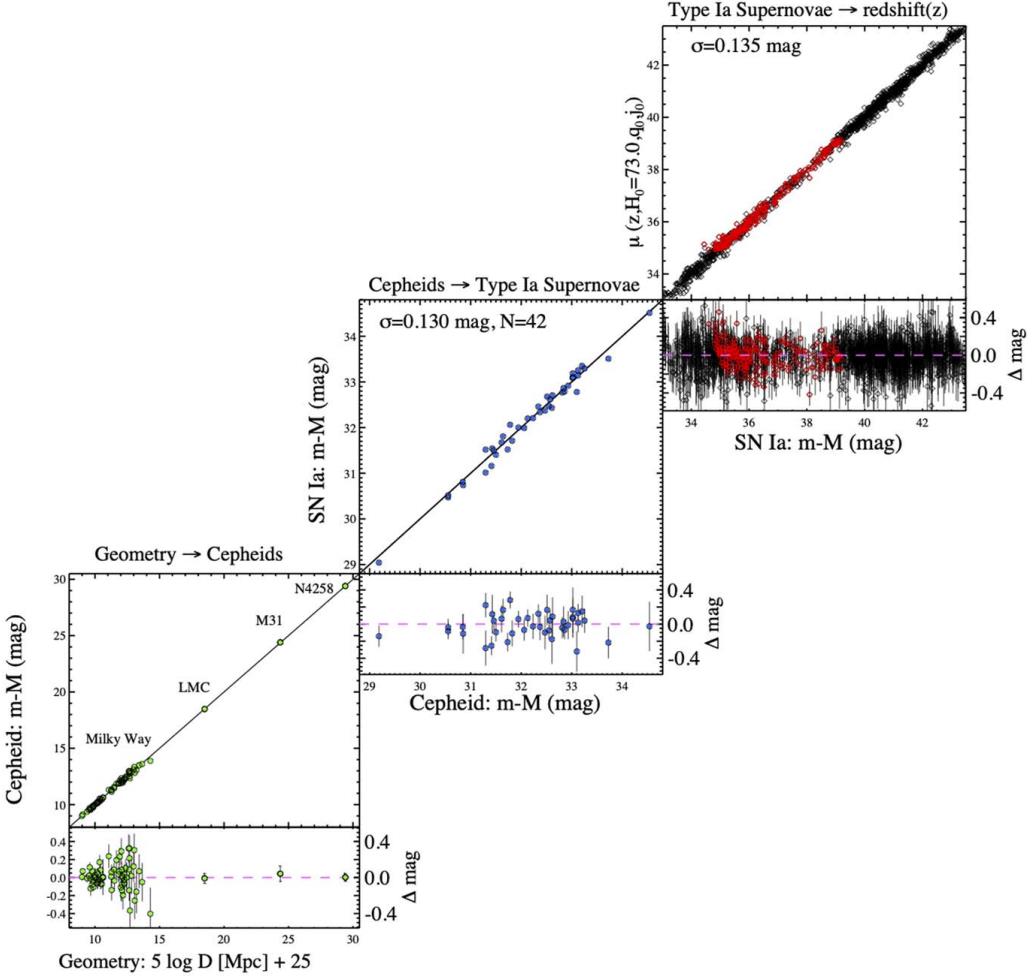
ES: One common theme that reappears throughout cosmology debates over time is the importance of having multiple independent ways of making a critical measurement or determining a parameter of our Universe. For the distance ladder method, there are many possible ways to leap from stars within our galaxy (best measured via parallax) to stars in nearby galaxies, including RR Lyrae stars, Cepheid variable stars, or stars in various stages of stellar evolution, such as red giant stars or asymptotic giant branch stars.
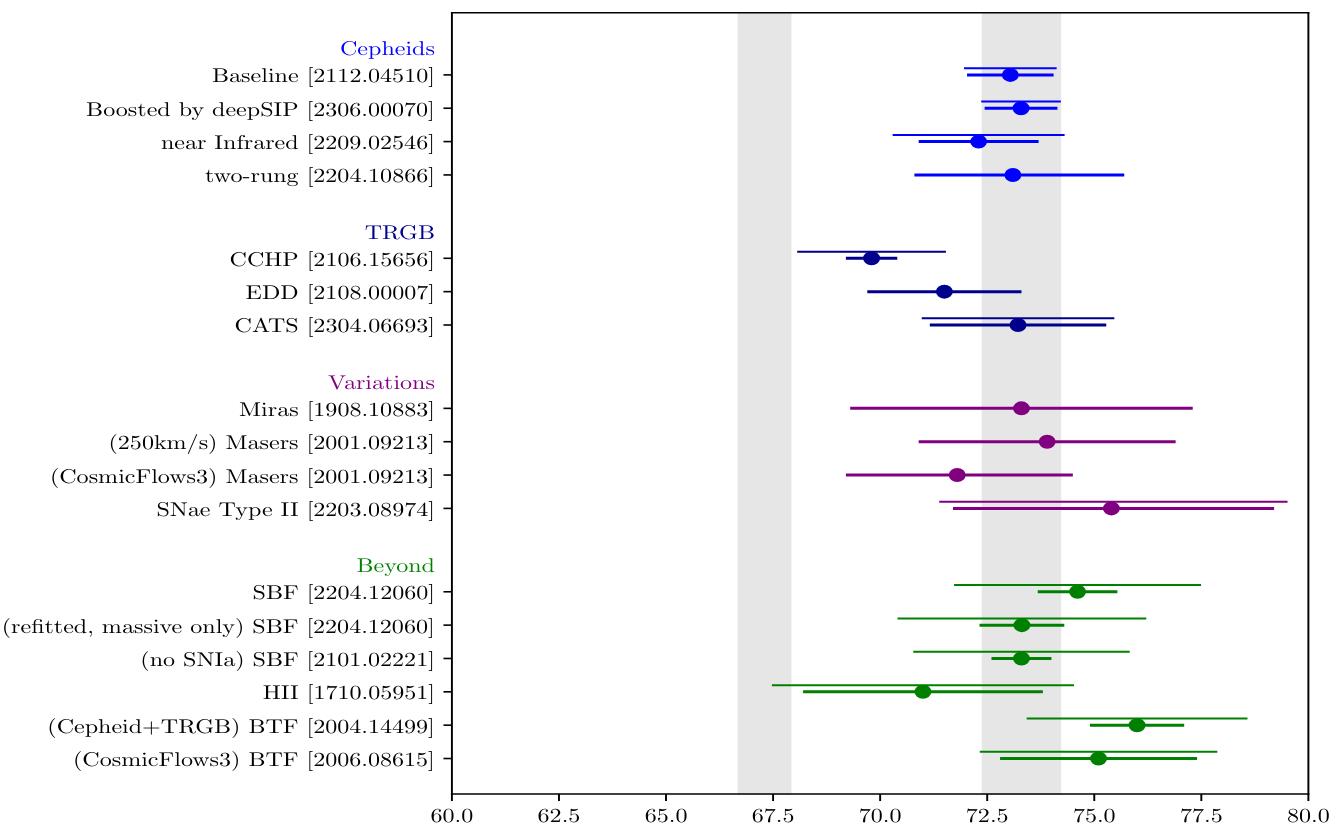
Similarly, whether you use type Ia supernovae (including whether you use the Pantheon+ or Carnegie samples), surface-brightness fluctuations, or other properties of a galaxy should all lead to the same results. Many, including you, have repeatedly shown, including in your most recent paper, that all of these methods lead to the same puzzle: an expansion rate of 73 km/s/Mpc, which remains inconsistent with the early relic method that yields 67 km/s/Mpc. What does the fact that all of these lines of evidence point to the same conclusion suggest, in your mind?
AR: It is very helpful to have multiple ways to make an important measurement. However, I would rather have a couple of very good ones than many bad ones. Fifty years ago the problem was that we had many poor ones so that one could see anything they wanted in the data, a situation we call “confirming your priors.” The situation is better today as the data has sharpened and we can test it piece by piece, rather than taking it all or nothing.
Richard Feynman used to advise — make better measurements of the hints and they will either go away (a fluke) or become stronger to reveal something interesting. The fact that the evidence has steadily grown suggests we are seeing something interesting that is on the sky rather than any obvious error or bad measurement. It’s a good time to be curious.
ES: A recent group, known as CCHP (for Carnegie-Chicago Hubble Program), has been an outlier in this regard for several years, claiming lower results for the expansion rate (of between 68 and 70 km/s/Mpc) using giant stars and smaller numbers of galaxies than the larger Cepheid studies. However, this group has also been accused of underestimating (or not estimating at all) their sources of uncertainty, and their method also suffers from a small sample size, where their results are using less than one-fourth of the data that is available from Cepheid studies. Can you explain why the CCHP’s results differ from all other studies, and why you are skeptical of their claims for a low expansion rate?
AR: If you look at recent reviews of the Hubble constant you will see dozens of studies ranging from 70 to 75 km/s/Mpc. We expect fluctuations so we normally take the mean or median as a best estimate. If you do a standard analysis with standard error propagation of the full set of data, you get a very strong case for tension. That conclusion has been widely replicated and tested. Alternatively, you can limit your analysis to subsets of the full data you select which may reduce the value of the Hubble constant, increase its uncertainty, or both, and relax the tension.
However, I have not seen empirical justification or wide support for excluding data — generally in statistical science excluding data leads to bias and I do not think that is a legitimate route to go. I have also seen the, uh, rather unconventional error analysis you refer to. In the long run, that stuff will get sorted, but I think we need to be careful to avoid confirmation bias — like giving greater attention to the lowest measurement because it’s closer to what’s expected from the early relic route. That won’t teach us much. At this point we need to search for a satisfying explanation why all of the precise local measurements are higher than the early relic route. There must be a reason and we should be looking for it.
ES: One of the key features of both Cepheids and type Ia supernovae is that they have been what we call “standardized,” where we can measure easily observable properties (like brightening-faintening times or the fall-off time from peak brightness) and then use that information to infer how intrinsically bright that object is. If you know how intrinsically bright a light bulb is and then measure how bright it appears to your eyes, you can know its distance. However, if you didn’t know the intrinsic brightness, you’d have to reckon with errors and uncertainties from your ignorance of the objects you’re observing. Are techniques that rely on either stars at the tip of the red giant branch or stars on the asymptotic giant branch less standardized than Cepheids, and if so, what questions need to be answered before we can trust the distances we infer from using those methods?
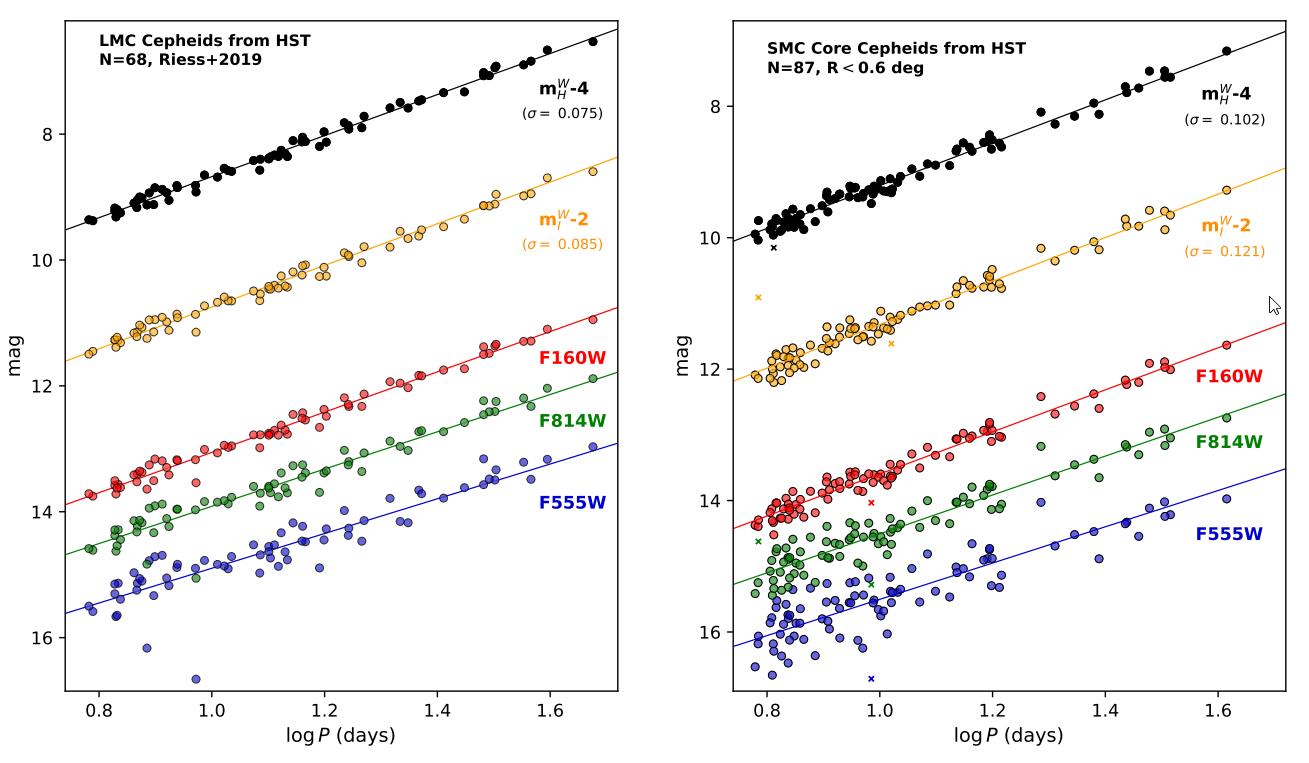
AR: The great breakthrough by Henrietta Leavitt a century ago was to recognize that the period of variation of Cepheid brightnesses tightly correlated with their luminosities. So when we see a bright, yellow star change brightness regularly over weeks or months, we automatically know it’s a Cepheid star and we know its luminosity to about 3% per star (as demonstrated in the Milky Way or Magellanic Clouds). This takes many observations over time, but the reward is to know the precise type of star and it’s luminosity you are looking at which makes them great standardized candles.
Cepheids are also among the most luminous stars, so we can see them farthest to reach the most type Ia supernova hosts. Some alternatives are “standard populations” — stars in a unique region of color and brightness space which tells you they are at a similar evolutionary state and thus have a similar luminosity. In practice, standard populations may be a mix of the target population and contaminants.
For the tip of the red giant branch population, the main contaminant is asymptotic giant branch stars which can be fainter or brighter than the tip, resulting in a fuzzy tip. Clever algorithms can still extract the tip. Carbon-rich asymptotic giant branch stars are another promising standard population, but the luminosity of the population varies with the radial properties of a galaxy (likely metallicity and age) so that it is challenging to compare them, apples to apples, between galaxies. Even at fixed radius, the population has a breadth [ES note: which indicates a larger uncertainty] many times that of Cepheids.
I think future work will focus on separating the “wheat from the chaff” in these populations through variability studies to make them sharper and more consistent between galaxies. Ironically, that may make them more expensive to observe like Cepheid variables, but it would be worth it.
ES: One fascinating point from your most recent paper is that if a team (e.g. the SH0ES team) restricted themselves to the small sample of galaxies used in the CCHP study, they would also arrive at a low value for the expansion rate of the Universe: somewhere around 69 km/s/Mpc. Does this tell us anything about the reliability of asymptotic giant branch stars, and does this tell us anything about the importance of not only having more galaxies to include in your sample, but galaxies that appear at a variety of distances (including greater distances) in any sort of distance ladder analysis?
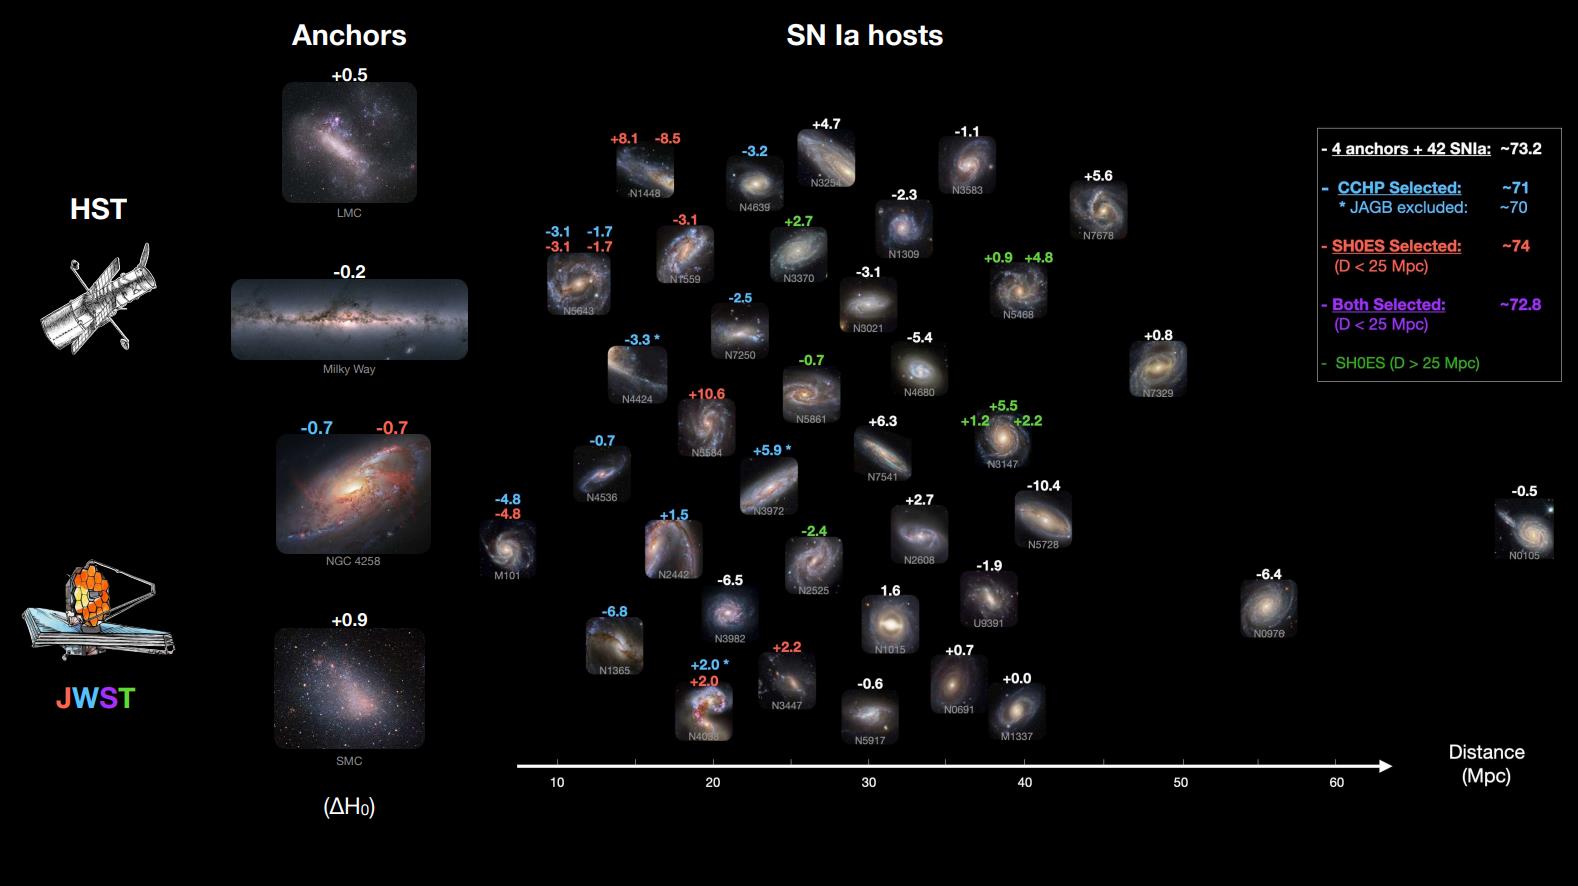
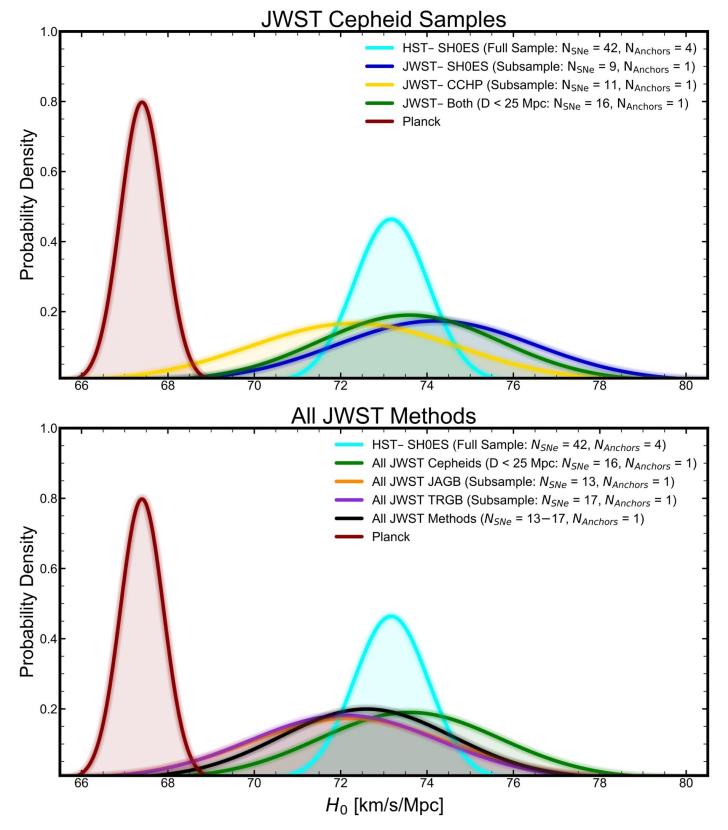
AR: The issue is that type Ia supernovae are not perfectly standard, so even after we calibrate one, we expect it to over or under estimate the average by typically 15%. This directly translates into a misestimate of the Hubble constant. So we need to calibrate a lot of them to “beat down” the uncertainty through averaging. By 2022, Hubble had calibrated 42 galaxies containing both Cepheids and type Ia supernovae, which took almost 20 years to collect. Because JWST is new, the samples of supernovae it has calibrated are still small, just 7-10, which will produce large fluctuations in estimating the Hubble constant.
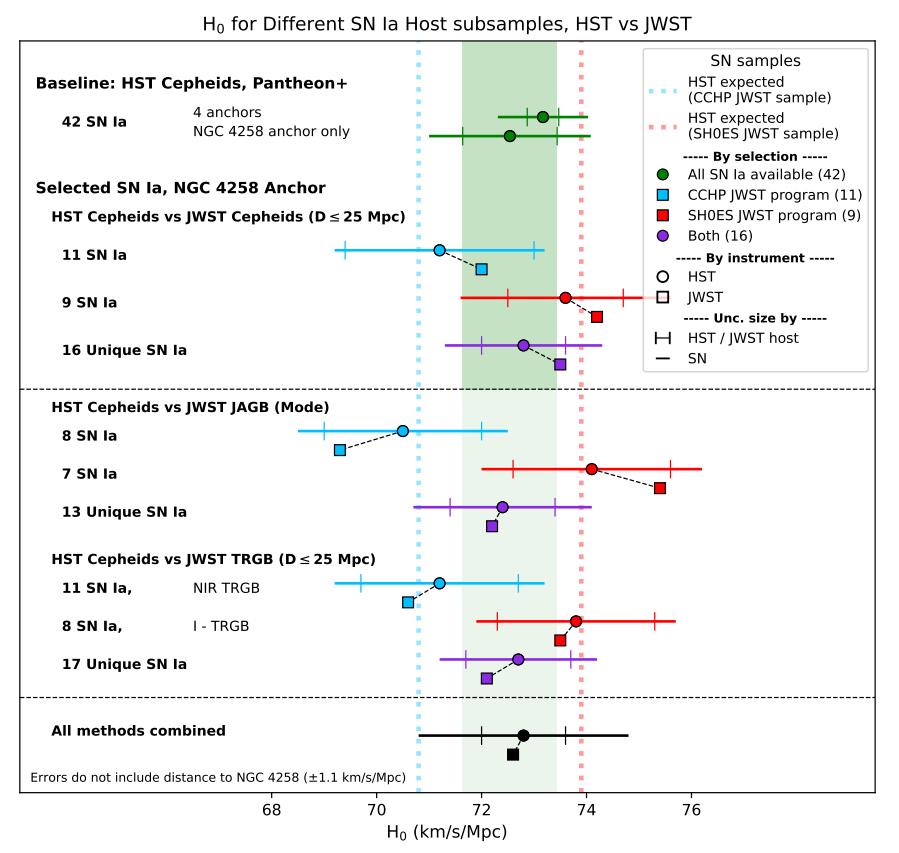
The good news is that Hubble has already calibrated all these same supernovae, so we can predict the size and direction of each small sample difference. In the case of the CCHP JWST sample, Hubble expected a value of about 70 km/s/Mpc, which is very similar to what they found with JWST. However, as we showed in a new paper, a larger JWST sample is produced by combining JWST programs (ours, CCHP, others) which reduces the fluctuations, the so-called “reversion to the mean.”
The combined sample is nearly every SN Ia measured by Hubble, 16 of 17, within 25 Mpc, and the result is 72.6 km/s/Mpc (where Hubble gets 72.8 km/s/Mpc for the same set). So, so far, Hubble and JWST and the various distance methods are in good accord. While I am as keen as anyone to find a solution to the tension, I don’t feel we should point to a downward fluctuation due to a small sample, especially a seemingly predictable fluctuation, as evidence of any change in the status of the Hubble tension. It’s important to always compare apples to apples, even when the apples are stars.
ES: Finally, as a “bonus question” for you, I think it’s important to highlight the role of the junior researchers who are making incredibly important contributions to this burgeoning sub-field of observational cosmology, within several different collaborations. Are there any people whose contributions you’d like to highlight, in order to make the broader community aware of how this is a collection of a great many researchers from around the world coming together to attempt to solve one of the greatest cosmic mysteries of modern times?
AR: I would like to acknowledge the work of so many who accelerated progress on these studies. First and foremost are those who spent years and even decades to bring JWST to fruition. Also my collaborators on the SH0ES Team, and to highlight the most junior members, Siyang Li, Gagandeep Anand, Louise Breuval, and Yukei Murakami, as well as my colleagues on the CCHP Team, the Hubble Space Telescope team, and within the cosmology community. The journey continues…
Ethan Siegel acknowledges Adam Riess for his valuable time and insight in participating in this interview.