2020 ties for hottest year on record, says NASA and NOAA
(Photo: Adobe Stock)
You may have noticed a trend in the last few years. At the beginning of every year, NASA and NOAA share their analyses of the previous year’s climate data. And every year, their data reveal the previous year to be one of the hottest on record—with 2016 at the torrid top of 139 years of documentation. That’s no coincidence. Climate change is happening, it’s happening now, and it’s human-caused.
That’s the consensus of 97 percent of climate scientists, according to a 2014 report from the American Association for the Advancement of Science. That’s the same percentage of physicians and cardiovascular scientists who agree that smoking causes lung cancer, and it’s a consensus reached through decades worth of surveys and studies into the realities and causes of climate change.
Now, climate scientists have two more analyses to add to their overwhelming evidence. In a briefing at this year’s 101st American Meteorological Society Annual Meeting, representatives for NASA and NOAA revealed their independent analyses of 2020’s climate data. And the trend continues.

A graph showing the global mean temperatures from 1880–2020 (with the years 1951–1980 serving as the mean baseline).Credit: NASA and NOAA
For its 2020 analysis, NASA gathered surface temperature measurements from more than 26,000 weather stations. This data was incorporated with data from satellites as well as sea-surface temperatures taken from ship and buoy instruments. Once tallied, NASA’s data showed 2020 barely edged out 2016 as the warmest year on record, with average global temperatures 1.02°C (1.84°F) above the baseline mean (1951-1980).
In a separate analysis of the raw data, NOAA found 2020 to be slightly cooler than 2016. This distinction is the result of the different methodologies used in each—for example, NOAA uses a different baseline period (1901–2000) and does not infer temperatures in polar regions lacking observations. Together, these analyses put 2020 in a statistical dead heat with the sweltering 2016 and demonstrate the global-warming trend of the past four decades.
“The last seven years have been the warmest seven years on record, typifying the ongoing and dramatic warming trend,” Gavin Schmidt, director of the NASA Goddard Institute for Space Studies, said in a release. “Whether one year is a record or not is not really that important—the important things are long-term trends. With these trends, and as the human impact on the climate increases, we have to expect that records will continue to be broken.”
And they are. According to the analyses, 2020 was the warmest year on record for Asia and Europe, the second warmest for South America, the fourth warmest for Africa and Australia, and the tenth warmest for North America.
All told, 2020 was 1.19°C (2.14°F) above averages from the late-19th century, a period that provides a rough approximate for pre-industrial conditions. This temperature is closing in on the Paris Climate Agreement’s preferred goal of limiting global warming to 1.5°C of those pre-industrial conditions.

A map of global mean temperatures in 2020 shows an scorching year for the Arctic.(Photo: NASA and NOAA)
Heatwaves have become more common all over the world, but a region that really endured the heat in 2020 was the Arctic.
“The big story this year is Siberia; it was a hotspot,” Russell Vose, chief of the analysis and synthesis branch of NOAA’s National Centers for Environmental Information, said during the briefing. “In May, some places were 18°F above the average. There was a town in Siberia […] that reported a high temperature of 104°F. If that gets verified by the World Metrological Organization, it will the first there’s been a weather station in the Arctic with a temperature above 100°F.”
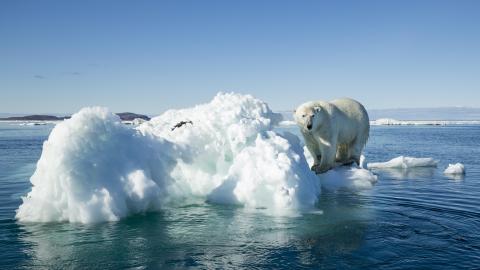
The Arctic is warming at three times the global mean, thanks to a phenomenon known as Arctic Amplification. As the Arctic warms, it loses its sea ice, and this creates a feedback loop. The more Arctic sea ice loss, the more heat introduced into the oceans; the more heat introduced, the more sea ice loss. And the longer this trend continues, the more devastating the effects.
For example, since the 1980s, there’s been a 50 percent decline in sea ice, and this loss has exposed more of the ocean to the sun’s rays. That energy then gets trapped in the ocean as heat. As the ocean heat content rises, it threatens rising sea levels and the sustainability of natural ecosystems. In 2020 alone, 255 zeta joules of heat above the baseline were introduced into Earth’s oceans. In (admittedly) dramatic terms, that’s the equivalent of introducing 5 to 6 Hiroshima atom bombs worth of energy every second of every day.
Looking beyond the Arctic, the average snow cover for the Northern Hemisphere was also the lowest on record. Like the Arctic sea ices, such snow cover helps regulate Earth’s surface temperatures. Its melt off in the spring and summer also provides the freshwater ecosystems rely on to survive and farmers need to grow crops, especially in the Western United States.

A map of 2020’s billion-dollar weather and climate disasters, which totaled approximately $95 billion in losses.Credit: NASA and NOAA
2020 was also a record-breaking year for natural disasters. In the U.S. alone, there were 22 billion-dollar disasters, the most ever recorded. Combined, they resulted in a total of $95 billion in losses. The western wildfires alone consumed more than 10 million acres and destroyed large portions of Oregon, Colorado, and California.
The year also witnessed a record-setting Atlantic Hurricane season with more than 30 named storms, 13 of which were hurricanes. Typically, the World Meteorological Organization names storms from an annual list of 21 selected names—one for each letter of the alphabet, minus Q, U, X, Y, and Z. For only the second time in history, the Organization had to resort to naming storms after Greek letters because they ran out of alphabet.
‘A world with no ice’: Confronting the horrors of climate change | Big Thinkwww.youtube.com
Such records are a dramatic reminder of climate change’s ongoing effect on our planet. They make for an eye-catching headline, sure. But those headlines can sometimes mask the fact that these years are part of decade-long trends, trends providing a preview of what a climate-changed world will be like.
And in case there was any question as to whether these trends were the result of natural processes or man-made conditions, Schmidt and Vose did not mince words.
As Schmidt said in the briefing: “Many, many things have caused the climate to change in the past: asteroids, wobbles in the Earth’s orbit, moving continents. But when we look at the 20th century, we can see very clearly what has been happening. We know the continents have not moved very much, we know the orbit has not changed very much, we know when there were volcanoes, we know what the sun is doing, and we know what we’ve been doing.”
He continued, “When we do an attribution by driver of climate change over the 20th century, what we find is that the overwhelming cause of the warming is the increase of greenhouse gases. When you add in all of the things humans have done, all of the trends over this period are attributable to human activity.”
The data are in; the consensus is in. The only thing left is to figure out how to prevent the worst of climate change before it’s too late. As bad as 2020 was, it was only a preview of what could come.
