Finally, a world map that’s all about oceans

- Athelstan Spilhaus designed an oceanic thermometer to fight the Nazis, and the weather balloon that got mistaken for a UFO in Roswell.
- In 1942, he produced a world map with a unique perspective, presenting the world’s oceans as one body of water.
- The Spilhaus Projection could be just what the oceans need to get the attention their problems deserve.
This is a world map unlike any other. Uniquely, it centres on Antarctica. Disturbingly, it rips Asia and the Americas to shreds. And compellingly, it presents the seas and oceans – 71% of the Earth’s surface – as a unified body of water.The map was designed by a renaissance man who also invented the skyways of Minneapolis and the secret weather balloon that caused the Roswell Incident. And yet you’ve never heard of him.
Dr Spilhaus was not just a distinguished meteorologist and oceanographer, but also a prolific inventor. During the Second World War, he developed the bathythermograph, a device for measuring sea temperature at great depth – making it easier to detect German submarines.
In 1948, he moved to the Minnesota Institute of Technology in Minneapolis. Perhaps because of the huge contrast between the harsh local winters and Cape Town’s Mediterranean climate, he conceived of a network of elevated covered walkways between buildings, sheltering people from severe weather. The Minneapolis Skyway System is currently 11 miles long, connecting buildings across 80 city blocks.
Following his work on the undersea thermometer, Dr Spilhaus helped develop a similar system of weather balloons for the Air Force, to spy on Soviet nuclear testing. When one such balloon crashed in New Mexico in 1947, the wreckage was whisked away with such speed and secrecy that the rumour mill went into overdrive. Some today still claim the crashed device was an extra-terrestrial space ship – the infamous ‘Roswell UFO’.
A man of many talents, Dr Spilhaus built some 3,000 varieties of children’s toys and for 15 years authored a science-focused, globally syndicated weekly comic strip called Our New Age. In 1954, Dr Spilhaus became America’s first representative on the executive board of Unesco, the UN’s educational and cultural department. A few years later, president Kennedy appointed him to direct the U.S. exhibit at the 1962 Seattle World’s Fair. “The only science I ever learned was from your comic strip”, JFK told him.

Image: Picturing Meteorology
Dr Spilhaus also proposed the establishment of Sea Grant Colleges – a network of institutes of higher learning focusing on the exploitation and conservation of marine areas. Which brings us back to the sea, and to this map.

Designed in 1942 while Dr Spilhaus was working on his bathythermograph, it reverses the land-based bias of traditional cartographic projections. The Spilhaus projection – a combination of the Hammer and Spielmann projections – places the poles of the map in South America and China, ripping up continents to show the high seas as one interrupted whole.
The earth-sea is perforated by Antarctica and Australia, and fringed by the other land masses. Two small triangles, one at the top of the map and the other on the lower right hand side, mark the same spot: the Bering Strait – as a reminder that what we’re looking at is not in fact a vast inland sea, but a body of water that circles the entire globe.
On most maps, the oceans are so vast that they become easy to ignore. Rather than just use them as background noise, this map focuses on the watery bits of our planet. That’s not just a refreshingly different viewpoint but, it could be argued, also a desperately needed one.
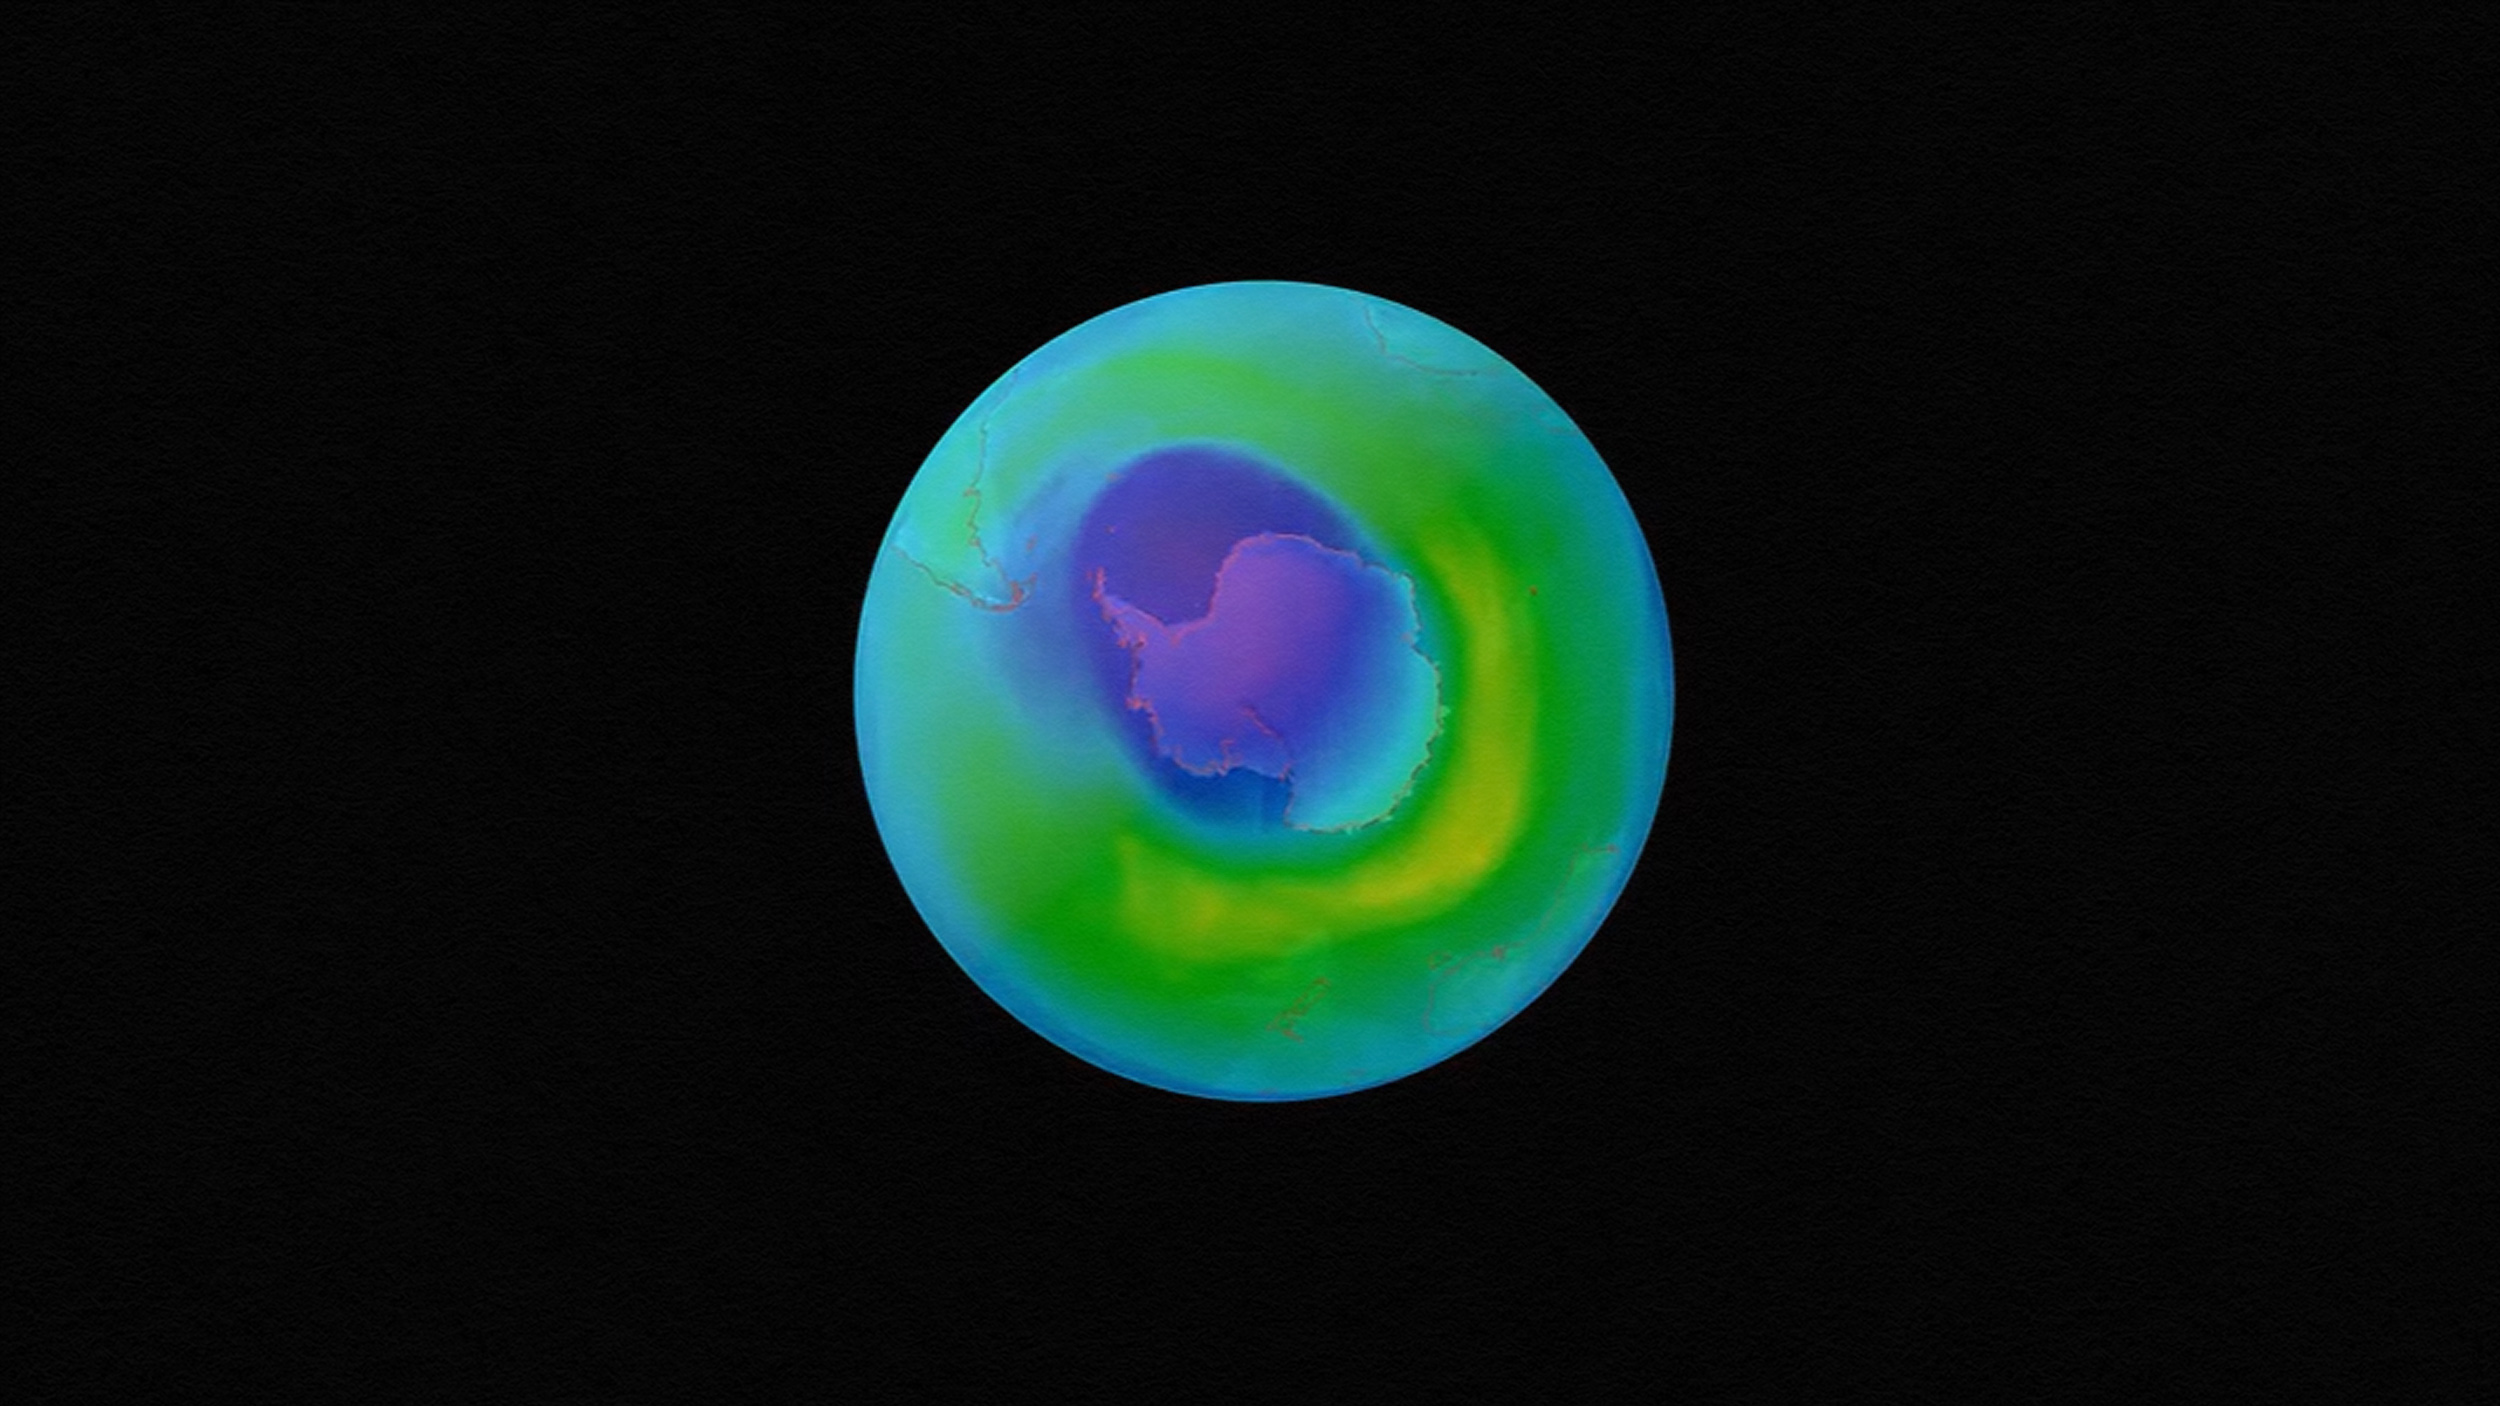
Our oceans produce between 50% and 85% of the world’s oxygen and are a major source of food for humanity. But they are in mortal danger, from overfishing, acidification, plastic pollution and climate change. Maritime ‘dead zones’ – with zero oxygen and zero marine life – have quadrupled since the 1950s. Low-oxygen zones have increased tenfold. The trend is fuelled by climate change (warmer waters hold less oxygen) and, in coastal zones, fertiliser and sewage runoff from the land.
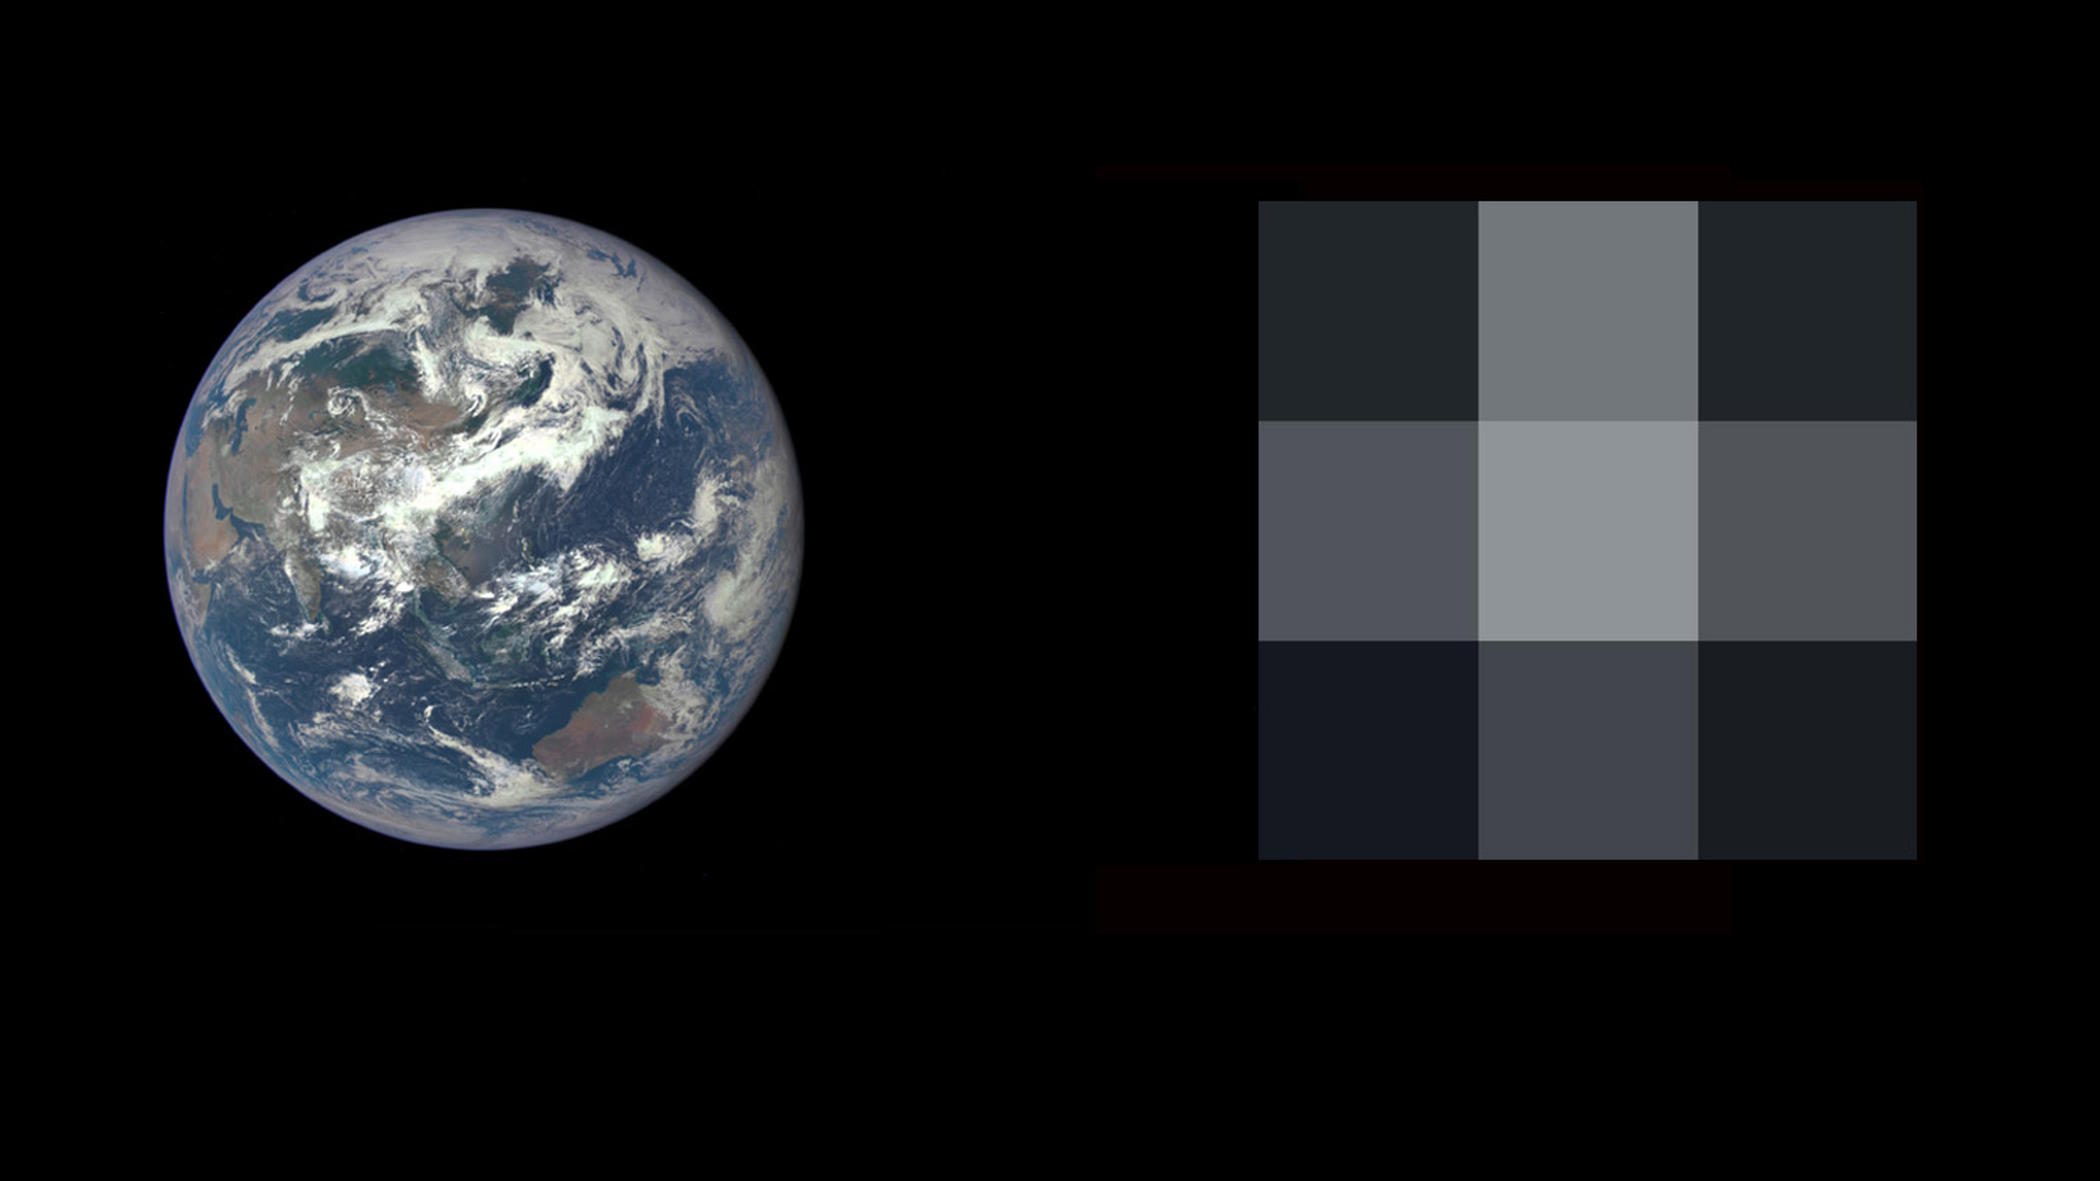
Perhaps this map can do what Earthrise did for the planet as a whole. Taken in 1966 by astronaut Bill Anders of Apollo 8 – the first manned mission to circle the moon – that picture shows our planet rising above the lunar surface, an inversion of the moonrises so familiar to humankind. It’s been called “the most influential environmental photograph ever” because it so clearly visualises the earth as a single, fragile ecosystem.

The oceans need a similarly powerful unifying visual. Even though it’s over 80 years old, this projection reminds us that saving the planet is pointless if we don’t also save the seas.
This map was designed for Libérationby Clara Dealberto, a French graphic designer who has a side project producing strange new countries. Titled Nouvelle Américopasie – atlas aléatoire d’un continent imaginaire (‘Random atlas of an imaginary continent’), it generates new fantasy countries out of two existing ones, adding up their inhabitants and areas, and mashing up their flags and names. Here are a few examples:


Strange Maps #939
Got a strange map? Let me know atstrangemaps@gmail.com.