How maps confirm anti-migrant bias
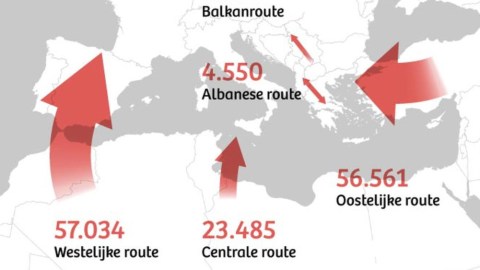
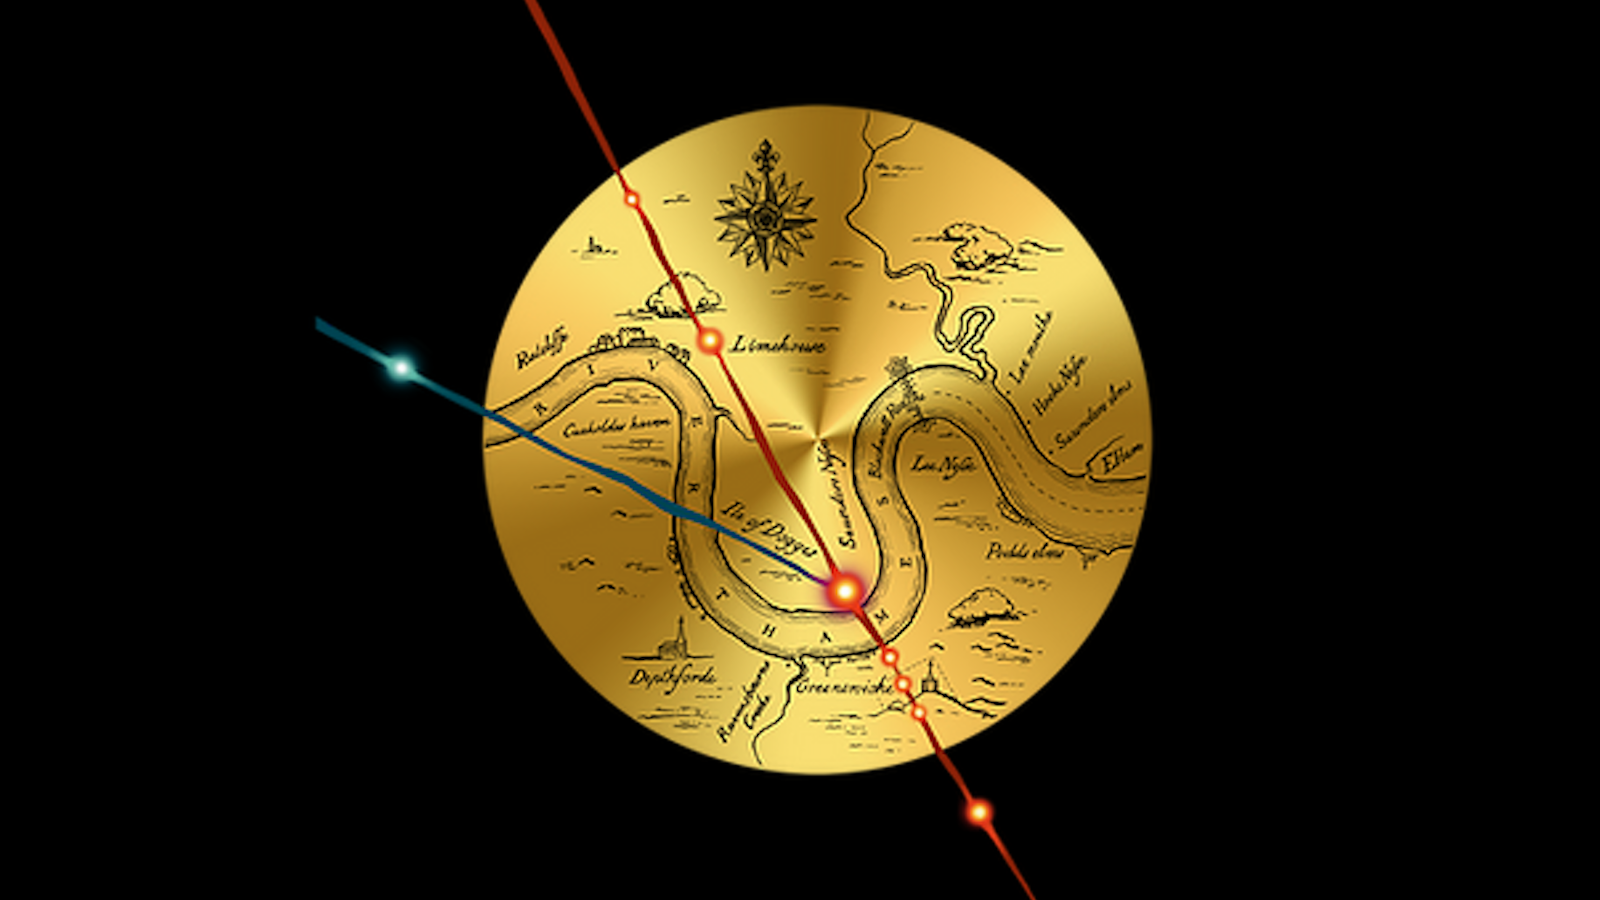
Image: De Correspondent, reproduced with kind permission.
- Maps aren’t objective. And migration maps aren’t innocent.
- Consciously or not, their content and form can confirm anti-migrant prejudices.
- Alternative mapping options are available – but perhaps the answer isn’t a map at all.

Satellite picture showing a scirocco blowing desert dust across the sea from Libya to southern Europe. Most of the irregular migration into Europe takes place across this part of the Mediterranean, either from North Africa to Italy or from Turkey to Greece.Image: NASA, public domain
One map can say more than a thousand words. That’s why we shouldn’t believe all they’re telling us. See, maps have a problem. They appear neutral, objective, authoritative. But that’s exactly all that they’re not. Each map reflects the many choices the cartographer has made, consciously or not, both in terms of content and form.
And so, without us even noticing it, maps can confirm bias, entrench prejudice and perpetuate injustice. Take for instance the topic of migration, guaranteed to raise the volume of the after-dinner conversation at any party. In a recent article, Dutch news website De Correspondent argues that the cartographic depiction of migrant flows into Europe reinforces the negative attitudes many Europeans have towards migrants.

Illegal border crossings at the EU’s external borders in 2019: just under 142,000 (down from around 150,000 in 2018 and almost 205,000 in 2017). Most came in via the Eastern Mediterranean route (83K, up from 57K in 2019), followed by the Western Mediterranean route (24K, down from 56K), the Western Balkan route (15K, up from 6K) and the Central Mediterranean route (14K, down from 23K). Relatively minor routes: the Western African route (3K, up from 1K), the Circular Route from Albania to Greece (2K, down from 5K), the Eastern Borders route (700, down from 1K) and the Black Sea route (2, up from zero).Image: Frontex – Risk Analysis for 2020
Here’s a map taken from the 2020 annual report by Frontex, the European Border and Coast Guard Agency, showing the illegal border crossings into the EU for 2019. As part of the official report on illegal immigration, this map is the source of many others in the European media.
While it may seem nothing more or less than a factually correct cartographic representation of objective data contained in the report, De Correspondent argues that there are several things wrong with this image.
- The arrows are reminiscent of battlefield maps, suggesting that Europe is under attack. This is aggravated by the use of the color red, which signals danger.
- The arrows are huge – larger than some countries. This homogenises a diverse group of people, and inflates the perceived size of the issue.
- The ‘straightness’ of the arrows indicates a clear purpose; but most migrants experience a much more circuitous and dangerous path, not always concluded successfully (or alive).
- The title refers to ‘illegal border crossings’, not mentioning that migrants hardly have legal means of entering the EU.
This all serves to affirm certain preconceptions about migration into Europe: the continent is being flooded by a huge influx of hostile aliens. “It’s no coincidence that political parties opposed to migration use maps like these in their communication,” the article states.

The blue map tries to confer the same information as the red one, without confirming the underlying biases.Image: De Correspondent, reproduced with kind permission.
Can maps confer the same information without confirming those biases? De Correspondent took the Frontex map and translated it into its own house style; and then produced a kinder, gentler alternative:
- The colour is a more soothing blue rather than the aggressive red.
- The map’s new title (“These are the routes via which irregular migrants reach the EU”) no longer focuses on the illegal aspect of the entries.
- The military-style arrows are replaced by circles.
While the ‘blue’ map at least makes an active effort not to walk into the same bias-confirming trap that the ‘red’ one does, it still tells only part of the story. No mention is made of the conflicts that motivate migrants to risk their lives in journeying to Europe – nor indeed of the many lives lost along those routes.

Number of migrants reaching Europe via the Mediterranean. The numbers have been declining since 2015. Image: De Correspondent, reproduced with kind permission.
Perhaps a map is not the right way at all to present information on migration, De Correspondent argues. Here’s another illustration: a simple bar chart, showing the number of irregular border crossings for each of the preceding six years. Following the dramatic refugee influx of 2015, that number has gone down significantly and consistently for each of the following years.
This offers a radically different perspective on the same reality – and one less likely to be reproduced by anti-immigration parties.
For more background (and more maps), see the original article at De Correspondent (in Dutch), which was based on an article in the journal Mobilities: The migration map trap. On the invasion arrows in the cartography of migration (in English).
Strange Maps #1045
Got a strange map? Let me know at [email protected].