Hey, methane leakers: Now we know where you live

Image: Kayrros
- Just 100 sources of methane emit 20 megatons each year.
- Thanks to satellite data, individual culprits can now be found.
- The new tech could be used to police ‘abnormal’ methane emissions.

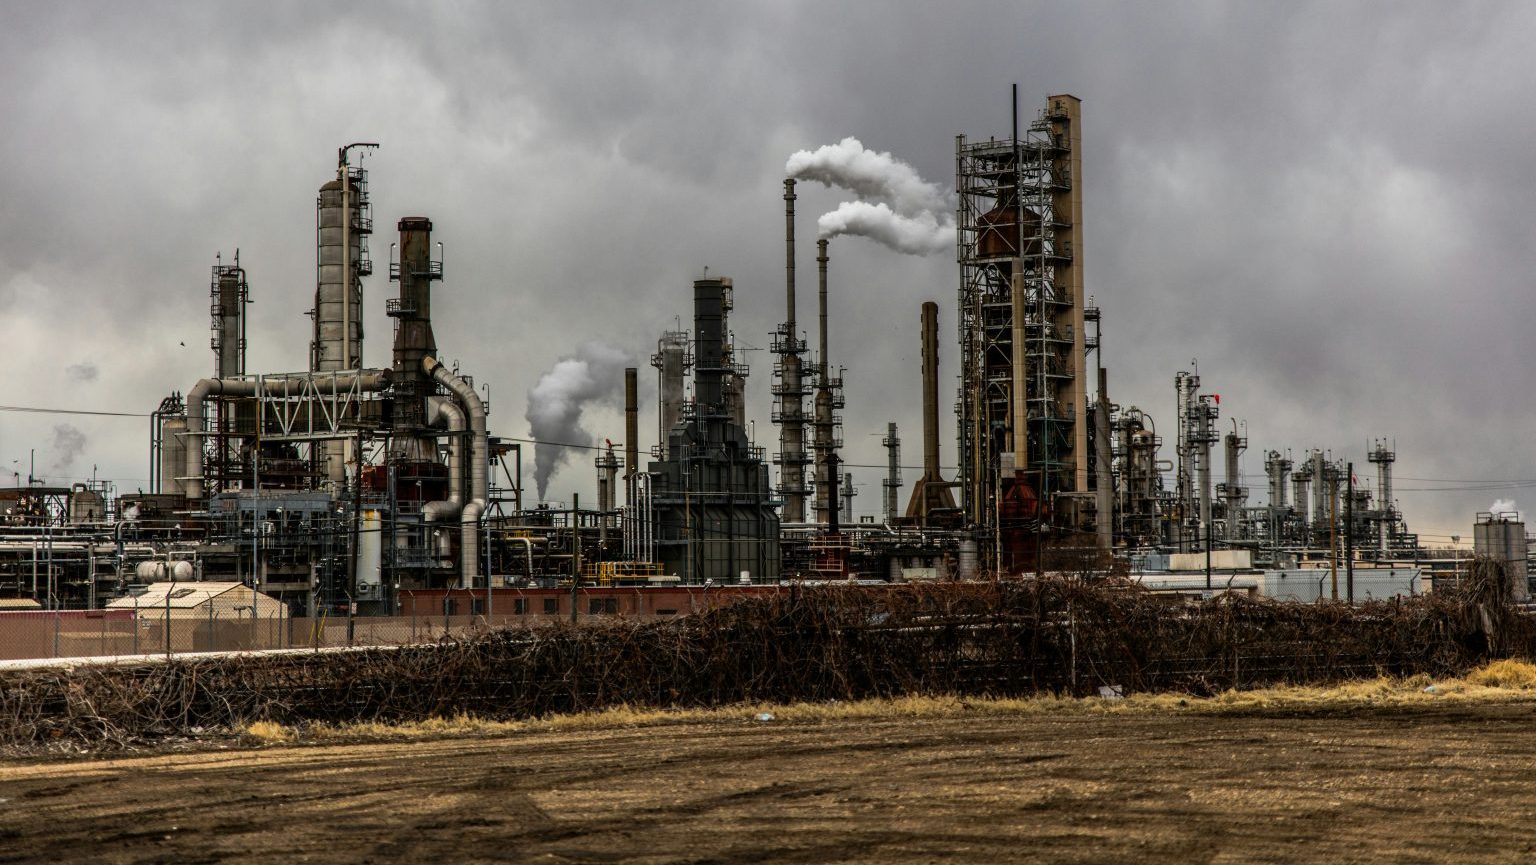
Nodding donkey in Midland, Texas. The oil and gas industry is a major emitter of methane.
Image: Eric Kounce TexasRaiser, public domain
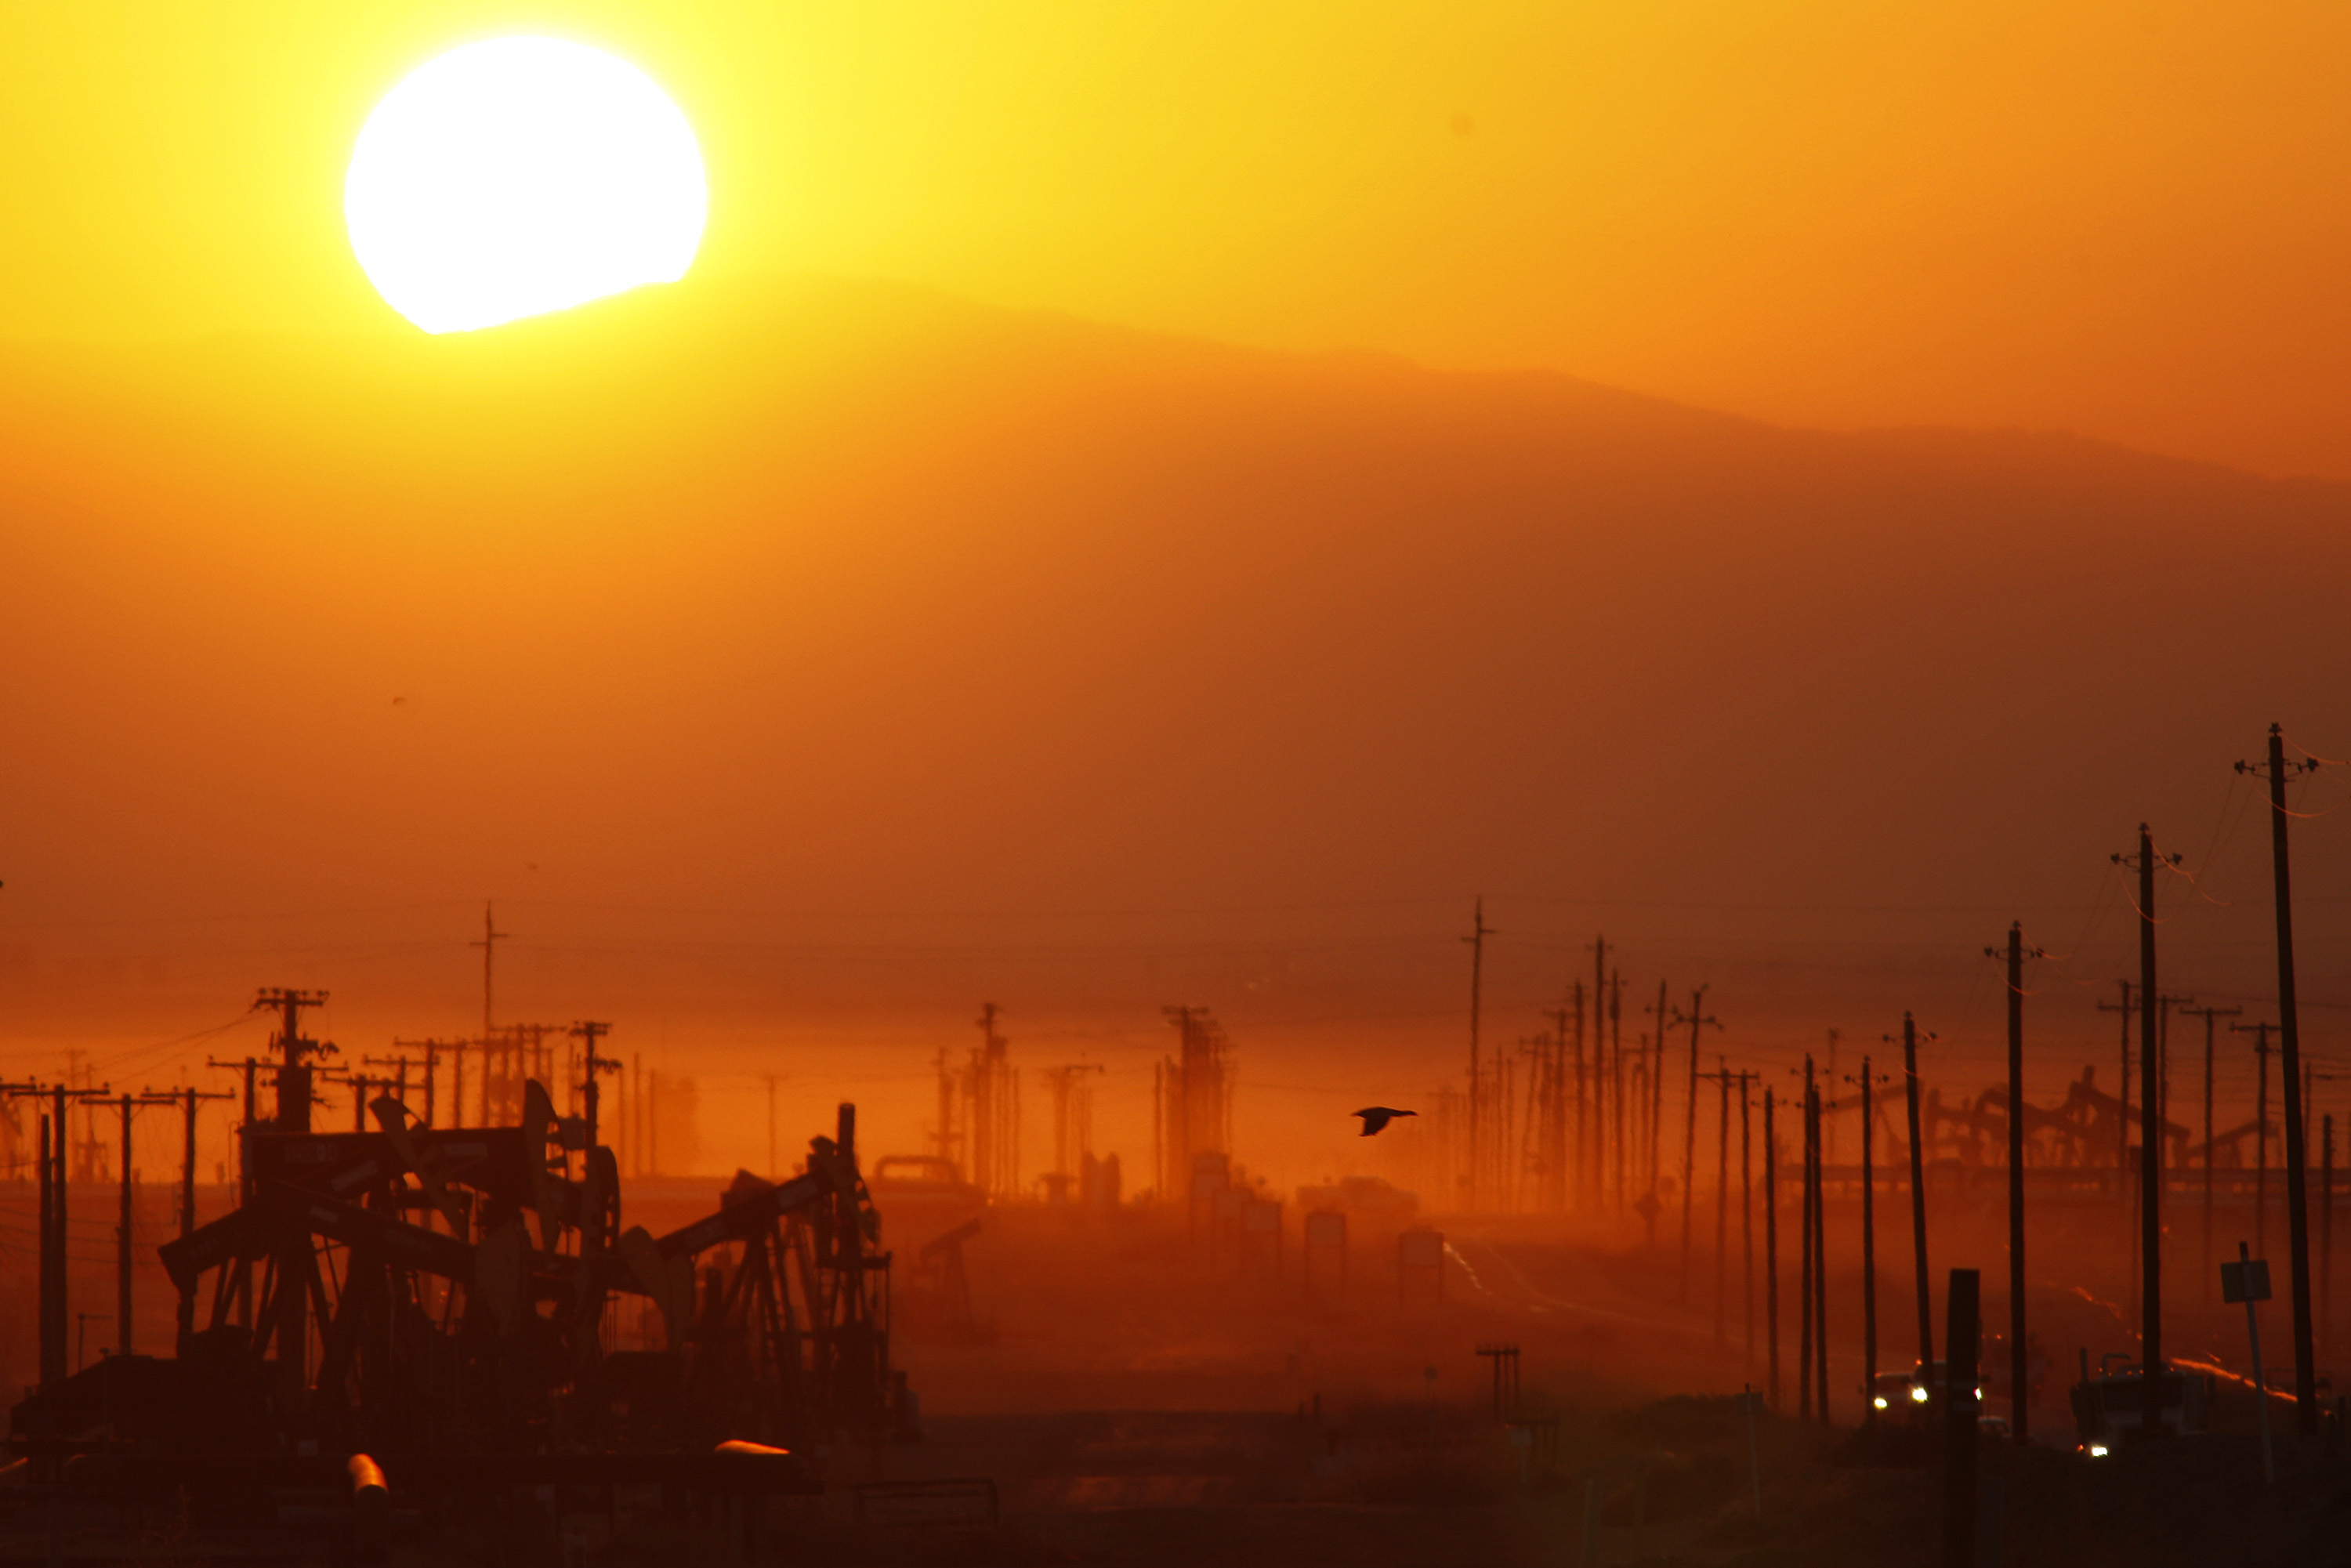
Significant contributor to global warming
Methane is the second most important greenhouse gas (after CO2), and its concentration in the atmosphere is increasing at around 1% each year. Because it absorbs the sun’s heat even more efficiently than CO2, it’s a significant contributor to global warming.
The first step to fight the rise in methane emissions is to track who’s doing it. That’s just become a lot easier. Paris-based tech start-up Kayrros can now find individual sources of abnormal methane emissions, all across the world. That’s a first, and it’s made possible by data from the Copernicus Sentinel-5P satellite.
Developed by the European Space Agency (ESA) and launched in 2017, the British-built Sentinel-5 Precursor (Sentinel-5P) is the first satellite of the Copernicus program dedicated to monitoring air pollution, thanks to a spectrometer called Tropomi (short for Tropospheric Monitoring Instrument).
With a resolution of about 50 km2, this Dutch-built instrument can monitor atmospheric levels of aerosols, sulphur dioxide (SO2), nitrogen dioxide (NO2), carbon monoxide (CO), formaldehyde (CH2O), ozone (O3) and methane (CH4).

Abnormal methane concentrations in 2019 – often found in regions of the world producing or processing oil and gas. Data provided by the Copernicus program, processed by Kayrros.
Image: Kayrros
High-volume methane leaks
You may not have heard of Tropomi yet, but it’s likely you’ve already seen its work. Earlier this year, Copernicus Sentinel-5P produced the images that showed substantially reduced NO2 levels across China, due to the coronavirus lockdown.
Tropomi also offers the most detailed monitoring of methane emissions presently available. Combining that data with other input from older-model Copernicus satellites Sentinel-1 and Sentinel-2, and from other sources (including ground sensors, position tracking and even social media), Kayrros scientists can identify the size, potency, and location of abnormal methane leaks around the world.
According to Kayrros, there are around 100 high-volume methane leaks active around the world at any given time. Together, they release about 20 megatons of methane per year. About half of that volume is associated with mining for oil, gas or coal, or other heavy industries. Together, that amount of methane per annum is equivalent to CO2 emissions of France and Germany combined.
So, how precise is the Kayrros method? Here’s a recent case study.

Image: Kayrros
Plume over the Permian Basin
In December last year, Kayrros used data from Copernicus-5P to identify the source of a methane plume over the Permian Basin, which covers western Texas and southeastern New Mexico. Sitting on top of a part of the Mid-Continent Oil Field, the Basin’s surface is dotted with hundreds of oil wells. Yet with a little help from Sentinel-1 and Sentinel-2, Copernicus-5P managed to find the exact location, and the individual culprit.
For the first time, Kayrros tech and Copernicus-5P data make it possible to detect abnormal methane emissions in real time. Not only will this increase the precision of methane emission estimates, it will also allow regulators to find and fine the exact culprits, and if necessary, shut down their operations.

Image: Kayrros
Found: the culprit
Images found here at Phys.org. Many thanks to Jana R. for sending this in.
Strange Maps #1027
Got a strange map? Let me know at [email protected].