Map shows homicide hotspots in medieval London
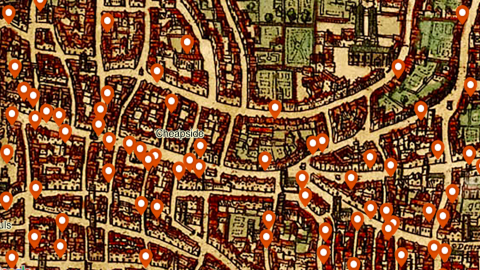
- This map shows the 142 murders that were committed in London from 1300 to 1340.
- Each clickable pin reveals the grisly details as recorded in contemporary coroner’s reports.
- Then as now, stabbing was the main method of killing in London — but the murder rate was three times higher.
It’s January 1322 and William, the son of Henry the Goldsmith at Rowe, is peeing in the public urinal in Cheapside. The man next to him complains that William is spraying on his shoes. William doesn’t like the sound of that: he punches the fellow, knocking his poleaxe to the ground. At this point, a bystander named Philip intervenes — further inflaming William’s temper. William picks up the poleaxe and delivers a fatal blow to Philip’s head. The other man gets away with just his footwear soiled.
Manuel Eisner, a professor of comparative and developmental criminology at the University of Cambridge, studies the history of interpersonal violence. The aforementioned darkly comic tale is his favorite among the 142 medieval murders his team at the Violence Research Centre have pinned on a map of London.
The Violence Research Centre, part of Cambridge’s Institute of Criminology, mapped all homicides from London coroner’s records covering the period from 1300 to 1340. They extracted information on victims and perpetrators, weapons used, and — as exactly as possible — the scenes of the crime.
Each of the homicides is plotted on a map of medieval London, marked by a clickable pin that reveals all the information on each case.

Early 14th-century London had a similar homicide rate to the U.S. today. Image source: Violence Research Centre
London, Stab City
The result is a theatre of horror, seen through the prism of a primitive police procedural: two boatmen beating a saddler to death with their oars, an innkeeper murdered after winning at backgammon, and an angry shopkeeper who smashes the head of a night-time troublemaker — among many other grisly tales.
The distribution of the pins reveals a few homicide hot spots in medieval London: if you valued your life, you stayed away from Westcheap (modern-day Cheapside) and Leadenhall Market, for instance. Here’s what else the map teaches us about violent deaths in early 14th-century London:
- More than half of all homicides occurred on just two days of the week: Sunday (31 percent) and Monday (21 percent). “Sunday was when people had time to engage in social activities that would occasionally trigger frictions leading to assault,” says Eisner. Monday’s high score is a bit of a mystery. Possibly, Sunday drama spilled over into Monday; or attack victims often took a day to die.
- Most homicides occurred in crowded streets and markets and other public spaces rather than in private residences. Churches and other religious buildings were three times as dangerous as brothels.
- Daggers and swords were the most popular weapons, used in 68 percent of cases. A further 19 percent involved quarter-staff poles.
- Chance of violent death increased as night fell. Seventy-seven percent of all murders took place between the early evening and the first hours after curfew.
- Ninety-two percent of the murders were committed by men, of all walks of life: commoners, upper-class types, even members of the clergy.
- Of the 142 crimes, only four were perpetrated by women: One ‘cuffed’ (and killed) a five-year-old boy who was stealing a bit of wool; Agnes, a prostitute, fell into an argument with Lucy, a pregnant woman, and in the process struck her “on the belly with fist and knees… leaving her half-dead in the street”; Nicola from Cardiff, a beggar-woman, is the likely perpetrator of the infanticide of ‘baby Alice’; and Isabella Heron stabbed her lover, a fishmonger, to death in the middle of a heated argument.
Each of the 142 Coroner’s inquests upon which this map was based, was drawn up in the presence of a jury composed of free men from the ward where the body was found, plus three neighboring wards — medieval London counted 24 in all. A jury could number anywhere between 12 and 50 members.
When you explore the London Medieval Murder Map yourself, you’ll find that you can choose between two maps. Why? Because it’s not easy to find a map that corresponds exactly to the time frame of these murders.
- The Braun-Hogenberg map (1572): produced more than two centuries after the homicides described in the coroner’s reports, yet it predates London’s late-16th-century spurt of growth; Londoners from either era would have little trouble navigating their counterpart city.
- The Historic Towns Trust map (1989): provides a detailed view of the topography of 1270s London, much of which would still be recognizable at the time of the killings.
You can also zoom in and out and apply a number of filters to the map, selecting pins based on gender of the victim, nature of the crime scene (public or private), year, type of weapon and ward, i.e. location.
Almost 700 years old, these medieval murders read as very remote tragedies. But there are some similarities with our own age, Eisner remarks: both then and now, homicides often start with trivial altercations, usually occur on non-working days, and mostly take place in the evening.
Assuming that the coroner’s reports offer a fairly complete overview of violent death in the period described, and factoring in London’s population at the time (around 80,000), the approximate homicide rate for the period described is about 4.5 per 100,000. That’s triple the rate of the homicide rate in today’s London (1.5 per 100,000), but only slightly lower than the U.S. national average (5 per 100,000).
The Interactive London Medieval Murder Map can be found here at the Cambridge Institute of Criminology’s Violence Research Centre. Many thanks to Catherine Stokes for sending this in.
Strange Maps #951
Got a strange map? Let me know at [email protected].