Pop by Lat and Pop by Long

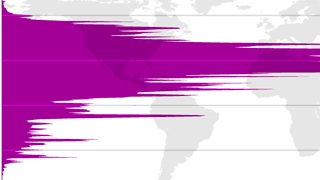
Did you know that almost 90% of the world’s population lives in the northern hemisphere? And that half of all Earthlings [1] reside north of 27°N? Or that the average human lives at 24 degrees from the equator – either to its north or south? Bill Rankin did. Or at least he found out, while producing this fascinating diptych of world maps, plotting population distribution on axes of longitude and latitude.
These maps have been floating around the internet for a few years now [2]. Like barnacled ships and whales at sea, they show their age by the virtual symbionts with which they are encrusted.
Or in this case, some rather opinionated comments.
Some commenters find fault with these maps: Exactly what information do they display? It is not population density, so much as population distribution that is shown. From either of these infographics alone, the precise locations of the densely inhabited centres of the world are not readily deducable.
But I side with those who fall for the abstract beauty of these graphs. Divorced from direct geographical (let alone historical and sociological) context, and further divided by longitude and latitude [3], they have an intriguing quality, inviting us to decode them all over again.
Let’s take the Pop by Lat graph, which shows us the distribution of the world’s population per degree of latitude (i.e. north to south).
In spite of its huge imbalance, the Pop by Lat map still presents a unified image: a giant, if unevenly sloping mountain. The Pop by Long map shows a much less more diverse set of data. Perhaps not surprising, as the constant of climate is no longer a factor, rather than the accident of continentality (if that’s a word).
Many thanks to all who sent in these maps, found here on Bill Rankin’s excellent website, Radical Cartography. Do check out his other work, which is fantastic.
Strange Maps #563
Got a strange map? Let me know at[email protected].
[1] Human Earthlings. Sorry, fellow primates (or mammals, vertebrates, animals, or carbon-based life-forms, depending on your willingness to include).
[2] Produced in 2008, based on data from 2000. That is quite a long time ago by now – come June 30th, the first eighth of this new century will have past. That is, if you count the start of the 21st century from 1 January 2000 instead of 2001 (oh, let’s not get into that again). Anyways, with a growth rate of about 80 million a year, we passed the 7-billion mark late last year (the title was granted to Danica May Camacho, born in the Philippines on 31 October 2011). Despite official UN ‘approval’ of Danica’s title, other claimants were born in Kaliningrad, the US, and India.
[3] Previous commenters have rightly remarked that on my trouble keeping east and west (and left and right) apart. This particular form of orientational dyslexia extends to longitude and latitude. I try to avoid the confusion by remembering that a person can be so-or-so many feet or metres long, and that this height is usually measured when the person is standing up. Longitude thus applies to the lines that are vertical on a standard map.
[4] or is that megalopoles? Or does that word describe megalomaniacs from Poland?


