A geography column on history and society.
“The best statistical graphic ever drawn“, is how statistician Edward Tufte described this chart in his authoritative work ‘The Visual Display of Quantitative Information’.
The chart, or statistical graphic, is also a map. And a strange one at that. It depicts the advance into (1812) and retreat from (1813) Russia by Napoleon’s Grande Armée, which was decimated by a combination of the Russian winter, the Russian army and its scorched-earth tactics. To my knowledge, this is the origin of the term ‘scorched earth’ – the retreating Russians burnt anything that might feed or shelter the French, thereby severely weakening Napoleon’s army.
As a statistical chart, the map unites six different sets of data. • Geography: rivers, cities and battles are named and placed according to their occurrence on a regular map. • The army’s course: the path’s flow follows the way in and out that Napoleon followed. • The army’s direction: indicated by the colour of the path, gold leading into Russia, black leading out of it. • The number of soldiers remaining: the path gets successively narrower, a plain reminder of the campaigns human toll, as each millimetre represents 10.000 men. • Temperature: the freezing cold of the Russian winter on the return trip is indicated at the bottom, in the republican measurement of degrees of réaumur (water freezes at 0° réaumur, boils at 80° réaumur). • Time: in relation to the temperature indicated at the bottom, from right to left, starting 24 October (pluie, i.e. ‘rain’) to 7 December (-27°).

Pause a moment to ponder the horrific human cost represented by this map: Napoleon entered Russia with 442.000 men, took Moscow with only 100.000 men left, wandered around its abandoned ruins for some time and escaped the East’s wintry clutches with barely 10.000 shivering soldiers. Those include 6.000 rejoining the ‘bulk’ of the army from up north. Napoleon never recovered from this blow, and would be decisively beaten at Waterloo under two years later.
Almost exactly a century and three decades later, Hitler would repeat Napoleon’s mistake by again underestimating the vastness of Russia, the inhospitability of its winters and the determination of the Russians.

The Economist, which in its last issue of 2007 published a story on the way in which some charts succesfully visualise statistical data (yes, those editorial meetings must be a riot), pointed out that “As men tried, and mostly failed to cross the Berezina river under heavy attack, the width of the black line halves: another 20,000 or so gone. The French now use the expression C’est la Bérézina to describe a total disaster.”
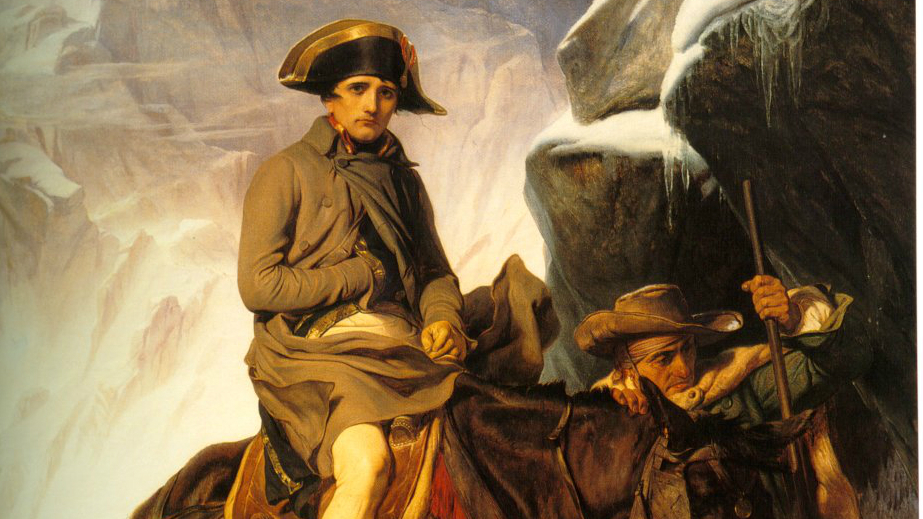
The map was the work of Charles Joseph Minard (1781-1870), a French civil engineer who was an inspector-general of bridges and roads, but whose most remembered legacy is in the field of statistical graphics, producing this and other maps in his retirement. This is a translation of the legend at the top of the map:
Figurative chart of the successive losses in men by the French army in the Russian campaign 1812-1813. Drawn up by Mr Minard, inspector-general of bridges and roads (retired). Paris, 20 November 1869.The number of men present is symbolised by the broadness of the coloured zones at a rate of one millimetre for ten thousand men; furthermore, those numbers are written across the zones. The red signifies the men who entered Russia, the black those who got out of it.The data used to draw up this chart were found in the works of Messrs. Thiers, de Ségur, de Fezensac, de Chambray and the unpublished journal of Jacob, pharmacist of the French army since 28 October. To better represent the diminution of the army, I’ve pretended that the army corps of Prince Jerôme and of Marshall Davousz which were detached at Minsk and Mobilow and rejoined the main force at Orscha and Witebsk, had always marched together with the army.
Jas Ellis sent me this link to the aforementioned Economist article, which enumerates and shows several other interesting infographics. It also has the clearest, most detailed reproduction of the Minard map I’ve ever seen; the map had been suggested to me previously by several readers, among whom Brian Westley, M. Kranz and Stephen Eckett.
Strange Maps #229
Got a strange map? Let me know at[email protected].

The Power of Play