Could the Nobel Prize of 2011 have been awarded without cause?
“Even if I stumble on to the absolute truth of any aspect of the universe, I will not realise my luck and instead will spend my life trying to find flaws in this understanding — such is the role of a scientist.” – Brian Schmidt
In 1998, the two leading independent collaborations working to measure distant supernovae in the Universe reported the same bizarre findings: they seemed to indicate that the Universe was accelerating. The only way to explain how distant these lights appeared was if the fabric of space was expanding at a rate that wasn’t decreasing like we’d expect, and if the most distant galaxies were receding faster and faster, despite the pull of gravity. Over the next 13 years, the evidence grew stronger and stronger for this picture, and in 2011 three pioneers in the field were awarded the Nobel Prize. And then, just last week, a new study came out alleging that the supernova evidence for this picture was marginal at best. The study concludes that perhaps the Universe hasn’t been accelerating, after all.
But is that fair and correct? Certainly the news reports are claiming it is, but what does the science say? Let’s start with what the supernova data is, and what it’s told us so far.
When you observe another galaxy, what you’re seeing is a whole lot of light spread out over a certain area: an extended object. This is because, even at the greatest of cosmic distances, all the stars spread out across the thousands upon thousands of light years don’t appear as a single point of light to our telescopes, but rather as a structure of a particular, resolvable size. But when a supernova goes off in a galaxy, that does appear as a single point, and it can shine nearly as bright as the rest of the galaxy for the few weeks it’s at its brightest.
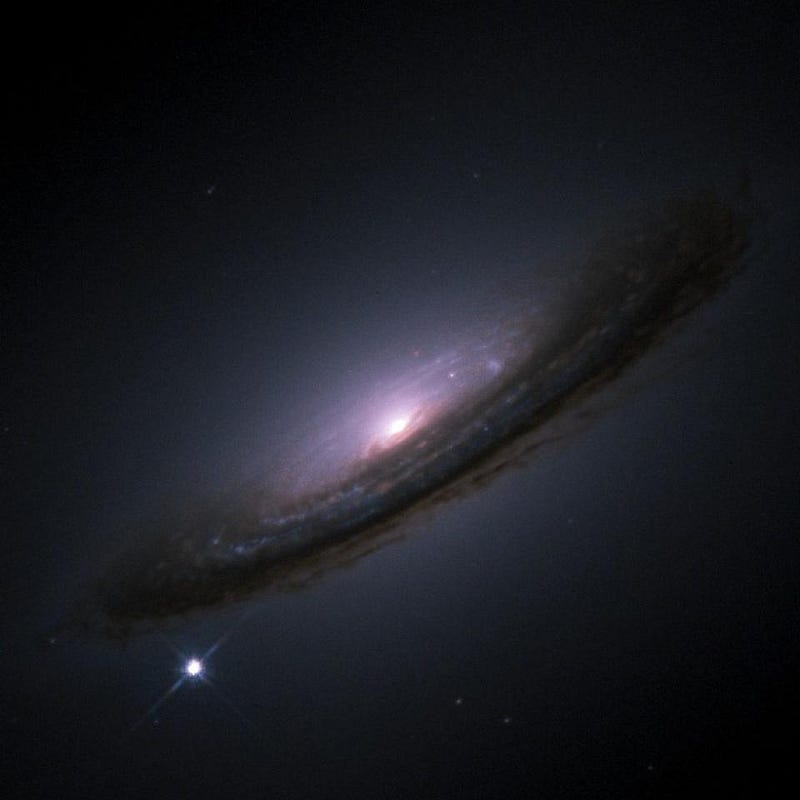
One class of supernova is a Type Ia, which originates from a pre-existing white dwarf star. This species of supernova has a few universal properties, meaning that when we observe one, we can use what we measure to figure out how far away it has to be. If we can also measure its redshift — or how fast it appears to be receding from us — those two pieces of information together allow us to constrain how the Universe is expanding.
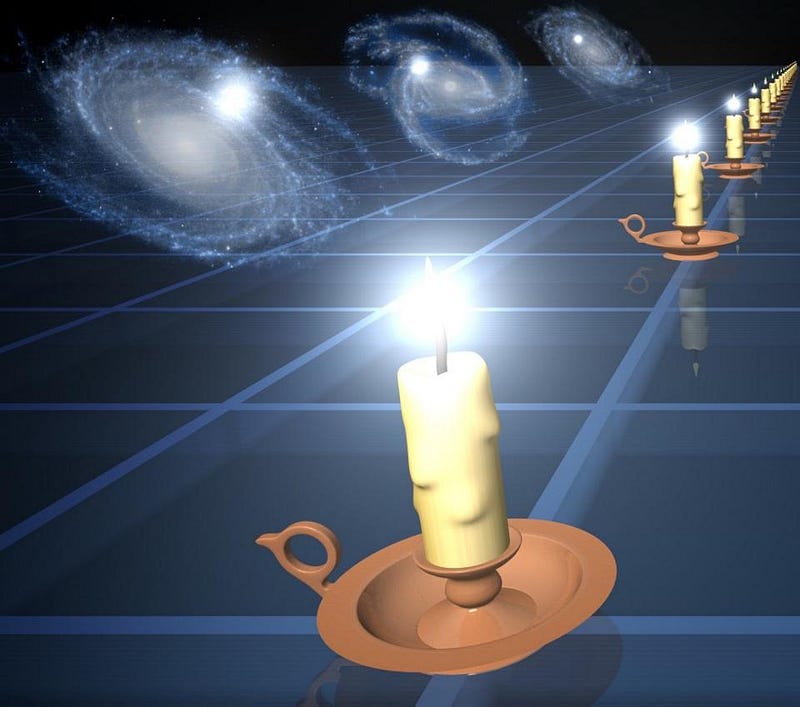
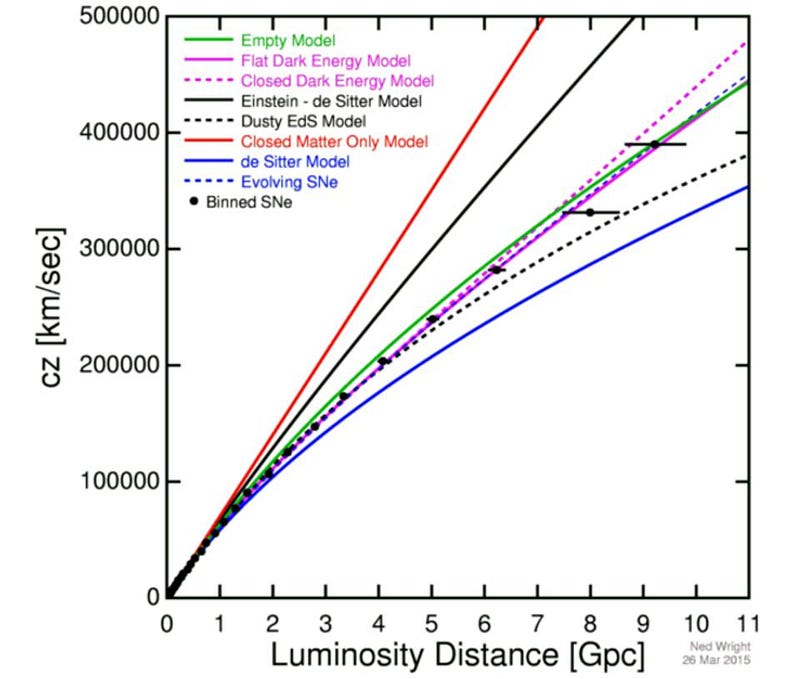
There’s a unique set of combinations for how distances and redshifts behave over time that’s determined by what’s in your Universe. And if you know what’s in your Universe and how it’s expanded over time, you can predict how it’s going to expand for the rest of eternity, far into the future.
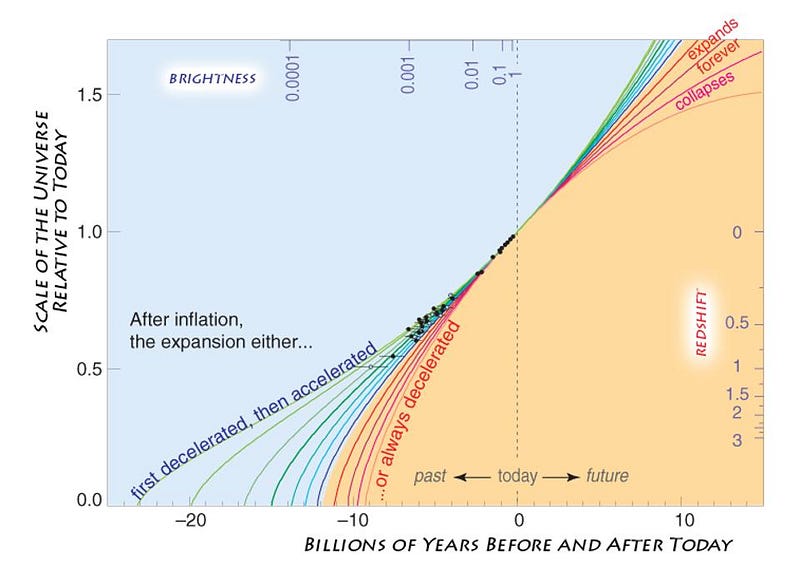
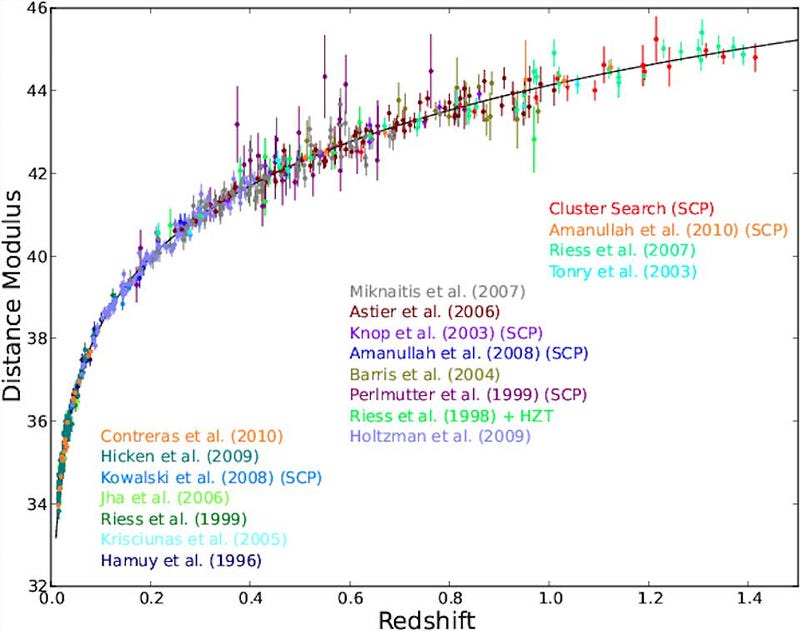
As with any set of measurements, there are going to be some uncertainties. It’s true that the more supernovae you have, the smaller those uncertainties get. But it’s also true that there are other uncertainties that don’t get smaller with better statistics: how truly universal those light-curves are and how well you fit them; the “stretch” of the data; the color-correction of the data; how extinction (or light-blocking) from dust plays a role; and so on. At the end of it all, you should be able to plot where your data points are and which models of the expanding Universe they are (and aren’t) consistent with.
This has been done for years, of course. But most of the time that it’s done, the people doing the analysis are doing two things:
- They’re adding in data from other observations, like the microwave background, large-scale structure or other distance indicators.
- And they’re using the same likelihood analyses that have been used before, without revisiting their assumptions or starting from first principles.
Oftentimes, it takes fresh eyes to approach a problem differently from how everyone else is approaching it. In their Scientific Reports paper out just a few days ago, scientists Nielsen, Guffanti and Sarkar — all of whom don’t specialize in supernova studies — did exactly that. Here’s what their results indicate.
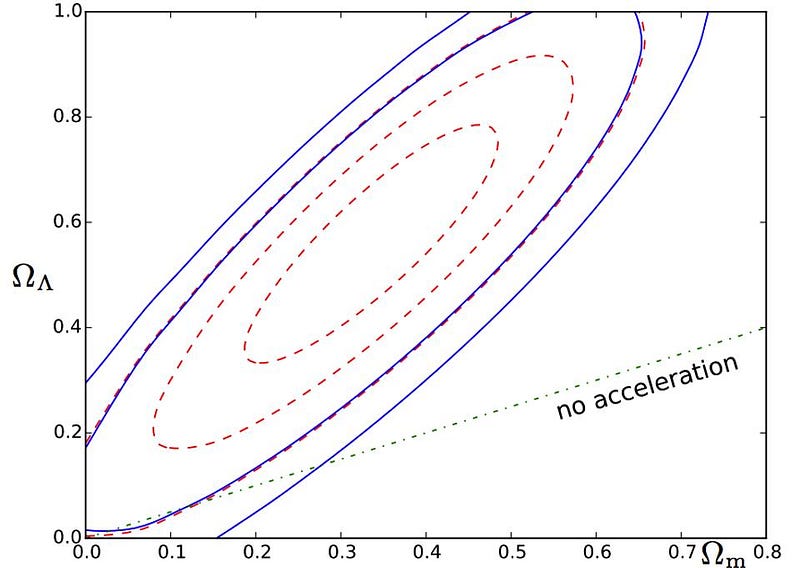
The y-axis indicates the percentage of Universe that’s made of dark energy; the x-axis the percentage that’s matter, normal and dark combined. The authors emphasize that while the best fit for the data does support the accepted model — a Universe that’s roughly 2/3 dark energy and 1/3 matter — the red contours, representing 1σ, 2σ, and 3σconfidence levels, aren’t overwhelmingly compelling. As Subir Sarkar says,
We analysed the latest catalogue of 740 Type Ia supernovae — over 10 times bigger than the original samples on which the discovery claim was based — and found that the evidence for accelerated expansion is, at most, what physicists call ’3 sigma’. This is far short of the ’5 sigma’ standard required to claim a discovery of fundamental significance.
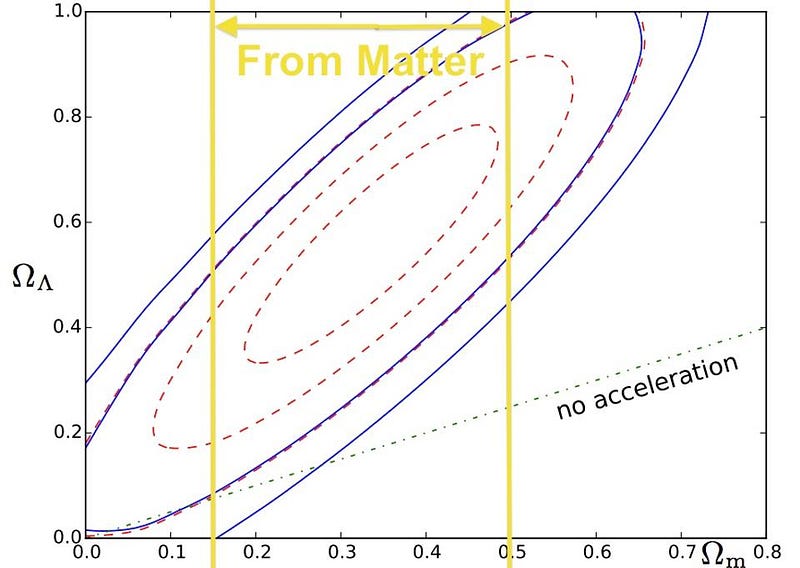
Subir Sarkar is right… but he’s also wrong in a colossal way. If the onlything you knew about the Universe was that we had this supernova data, we wouldn’t be able to get this far. But we also assume that General Relativity is correct, that Hubble’s Law is valid and that these supernovae are good distance indicators for how the Universe expands. Nielsen, Guffanti and Sarkar have no problems with those assumptions. So why not use the other basic pieces of information that we know, like the fact that the Universe contains matter. Yes, the 0-value on the x-axis is ruled out because the Universe contains matter. In fact, we’ve measured how much matter the Universe has, and it’s around 30%. Even in 1998, that value was known to a certain precision: it couldn’t be less than about 14% or more than about 50%. So right away, we can place stronger constraints.
In addition, as soon as the first WMAP data came back, of the Cosmic Microwave Background, we recognized that the Universe was almost perfectly spatially flat. That means that the two numbers — the one on the y-axis and the one on the x-axis — have to add up to 1. This information from WMAP first came to our attention in 2003, even though other experiments like COBE, BOOMERanG and MAXIMA had hinted at it. If we add that extra flatness in, the “wiggle room” goes way, way down.
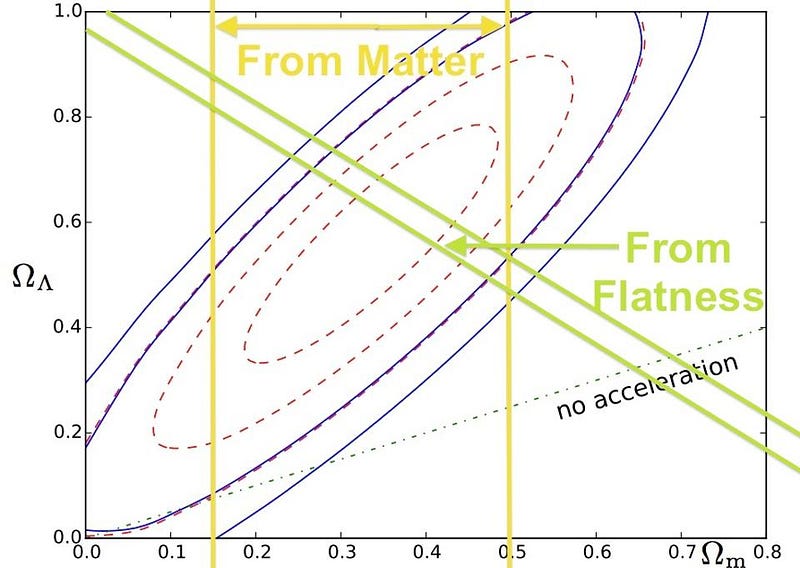
In fact, this crudely hand-drawn map I’ve made matches almost exactly the modern joint analysis of the three major sources of data, which includes supernovae.

There actually is a nice result from this paper: it perhaps will cause a rethink of the standard likelihood analysis used by teams analyzing supernova data. It also shows just how incredible our data is: even with using none of our knowledge about the matter in the Universe or the flatness of space, we can still arrive at a better-than-3σ result supporting an accelerating Universe. But it also underscores something else that’s far more important. Even if all of the supernova data were thrown out and ignored, we have more than enough evidence at present to be extremely confident that the Universe is accelerating, and made of about 2/3 dark energy.
Quite excited about this paper’s findings, Sarkar said, “Naturally, a lot of work will be necessary to convince the physics community of this, but our work serves to demonstrate that a key pillar of the standard cosmological model is rather shaky.” On it’s own, absolutely. But in tandem with the full suite of data available, or even just two key pieces that he was happy to ignore? Not a chance. Dark energy and the accelerating Universe is here to stay, and it’s going to take a lot more than an improved likelihood analysis to change that.
Update (12:00 PM): Supernova researcher Dan Scolnic (along with Adam Riess) weighs in on the Nielsen, Guffanti and Sarkar paper over at Scientific American, and point out that one of the new “additions” they make in their likelihood analysis is to treat every supernova the same. According to Scolnic, this ignores the known fact that “supernovae we see evolve in their light curve properties and their selection effects are different at higher redshifts.” If you include that information, their analysis would give better than a 4-sigma result (>99.99% confidence), rather than a 3-sigma (99.7% confidence) result.
This post first appeared at Forbes, and is brought to you ad-free by our Patreon supporters. Comment on our forum, & buy our first book: Beyond The Galaxy!

The Power of Play