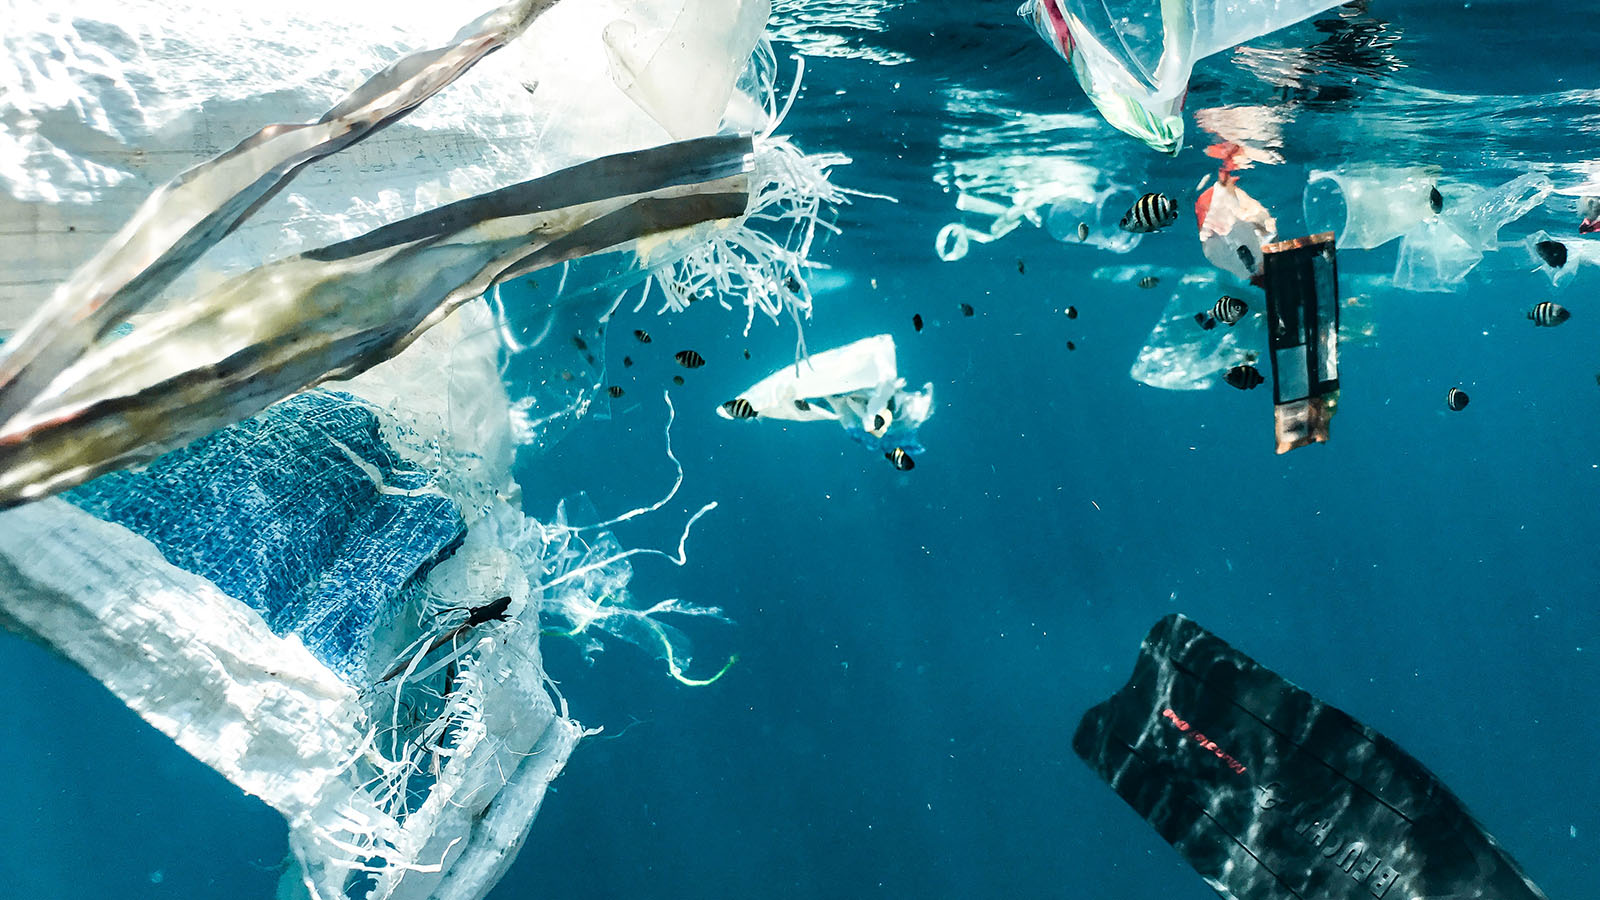
Most of the plastic that enters the oceans from land comes from rivers in Asia.1 More than 80% of it.2
Only a small amount comes from rivers across Europe and North America. Together, these regions contribute just 5% of the global total. This would suggest that the world’s richest countries don’t contribute much to the problem of plastic pollution.
But, these numbers only look at the plastic that is emitted domestically. They don’t consider the fact that many countries export plastic waste overseas. If it was the case that the UK exported a lot of its plastic waste to countries where waste management systems are poor, and lots of plastic leaks into the environment, the UK would have a large indirect impact on ocean pollution.
Here I use global data to understand the scale of plastic waste trade. I look at who the biggest exporters and importers are, and where this waste ends up.
I estimate that a few percent – possibly up to 5% – of the world’s ocean plastics could come from rich countries exporting their waste overseas.
How much of the world’s plastic waste is traded?
Importing plastics can often bring economic benefits. Recycled plastics can be repurposed into other goods, and fed into manufacturing industries. This is often cheaper than buying or making virgin plastics from scratch.
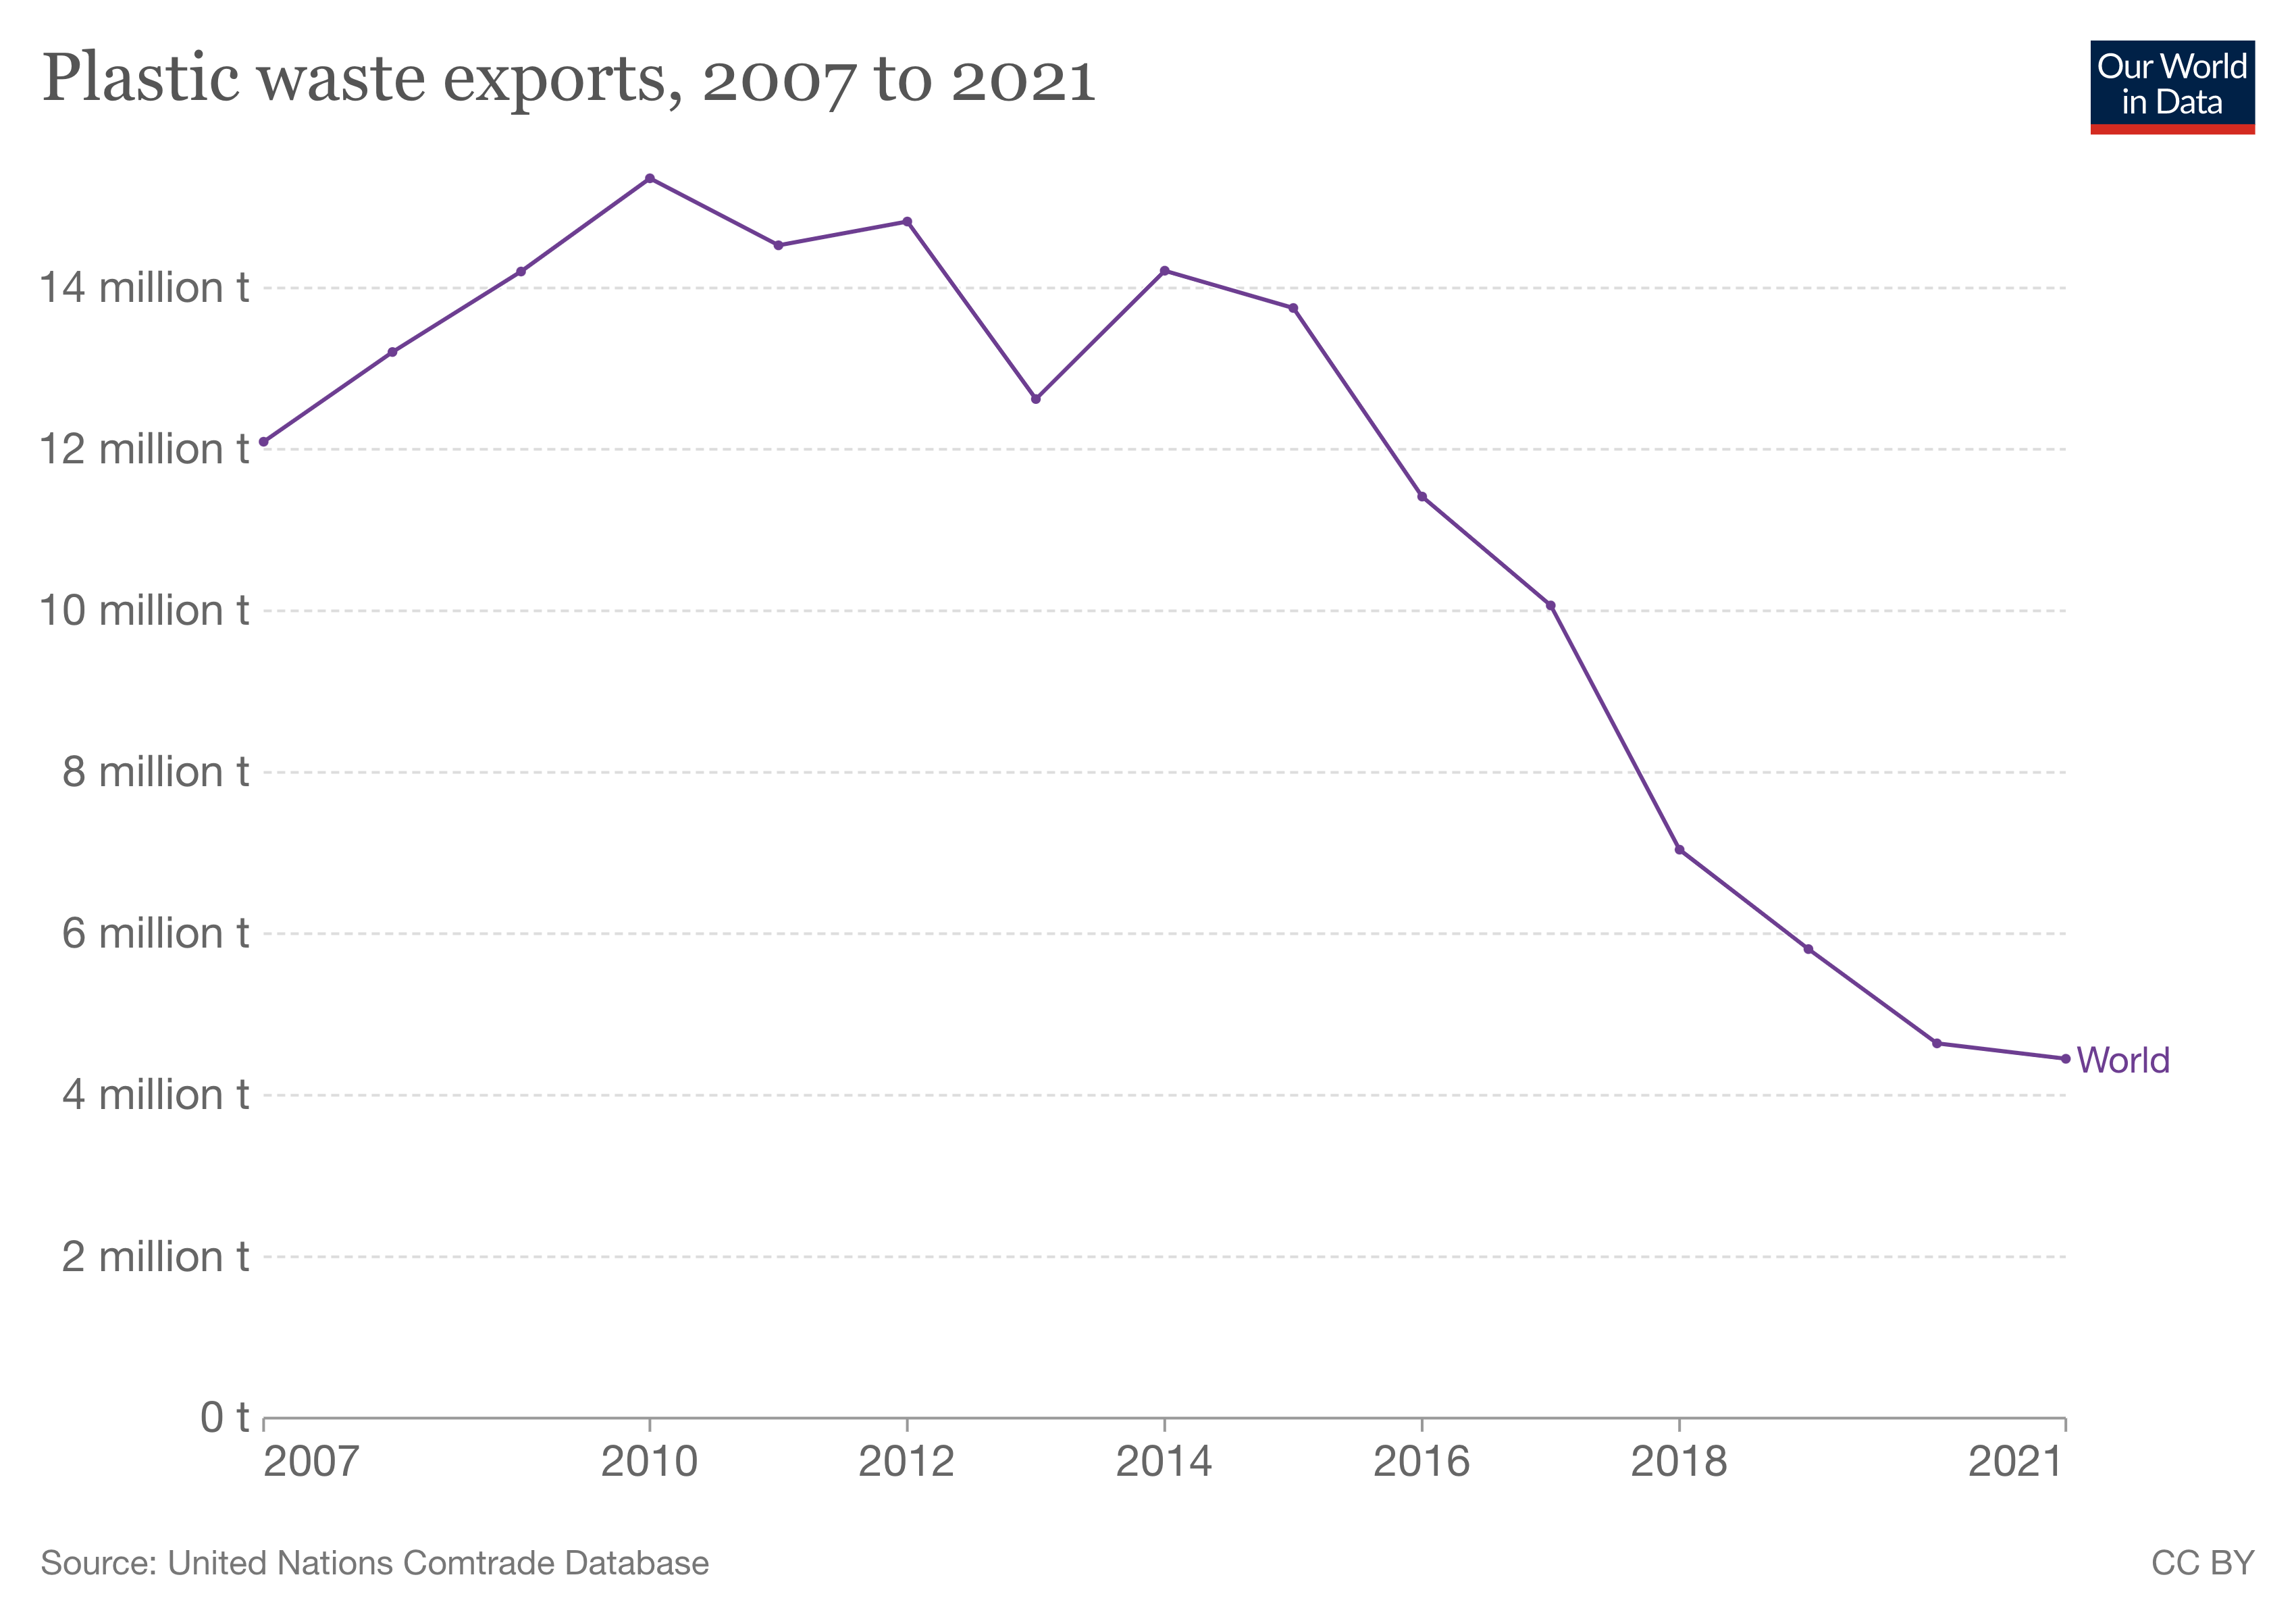
In 2020, around 5 million tonnes of plastic waste was traded globally.3 We might imagine that the pandemic forced a large reduction in plastic trade, but this doesn’t seem to be the case. In 2019, rates were only slightly higher, at around 6 million tonnes.

Let’s put those 5 million tonnes into context.
The world generates around 350 million tonnes of plastic waste per year. That means that around 2% of waste is traded.4
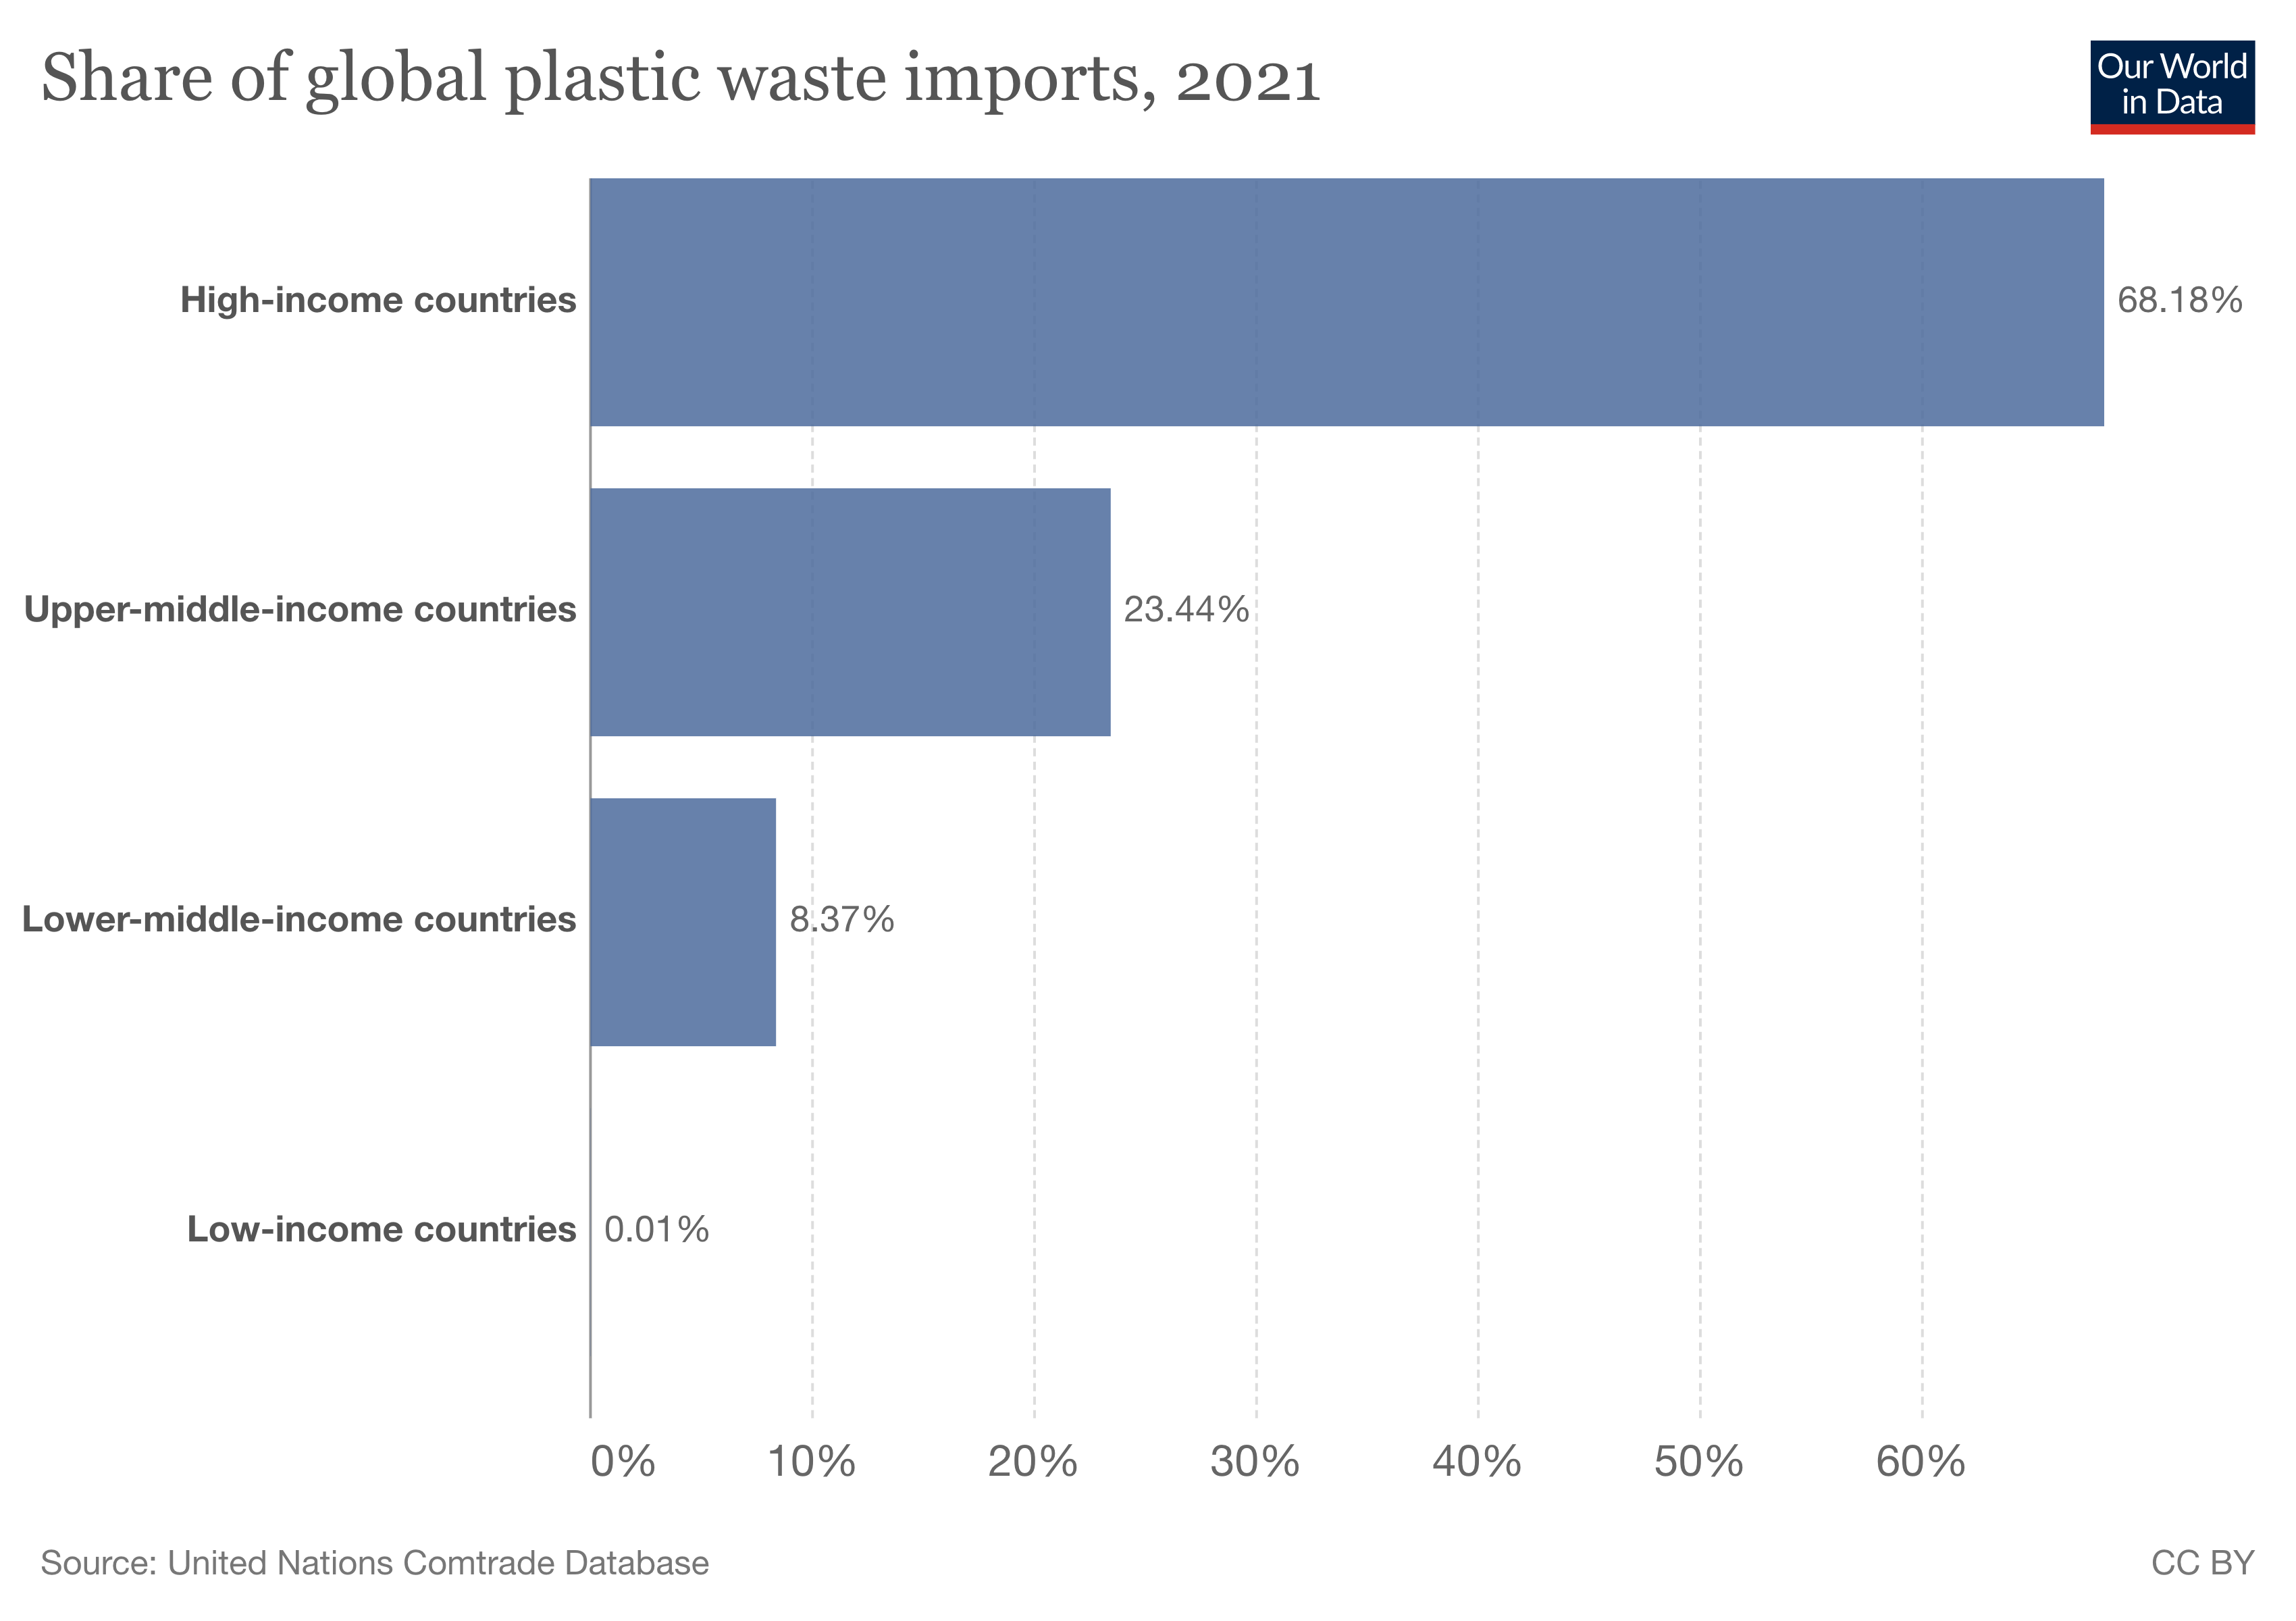
The remaining 98% is handled domestically. It’s sent to a landfill, recycled, or incinerated in the country where the waste was generated. The idea that most of the world’s plastic waste is shipped overseas is incorrect. One reason why this figure is so low is that it’s mostly recycled waste that’s traded, and only 20% of the world’s plastic is recycled.5
Over the last decade, we’ve seen a large decline in the amount of plastic waste traded. Rates have fallen by two-thirds since 2010.
What was the impact of the Chinese ban on plastic trade?
Policies in China toward plastic trade have had a large impact on the global change shown in the previous chart.
In 2016, China was importing more than half of the world’s traded plastic waste. By 2018, this had plummeted to less than 1%. We see this in the chart.
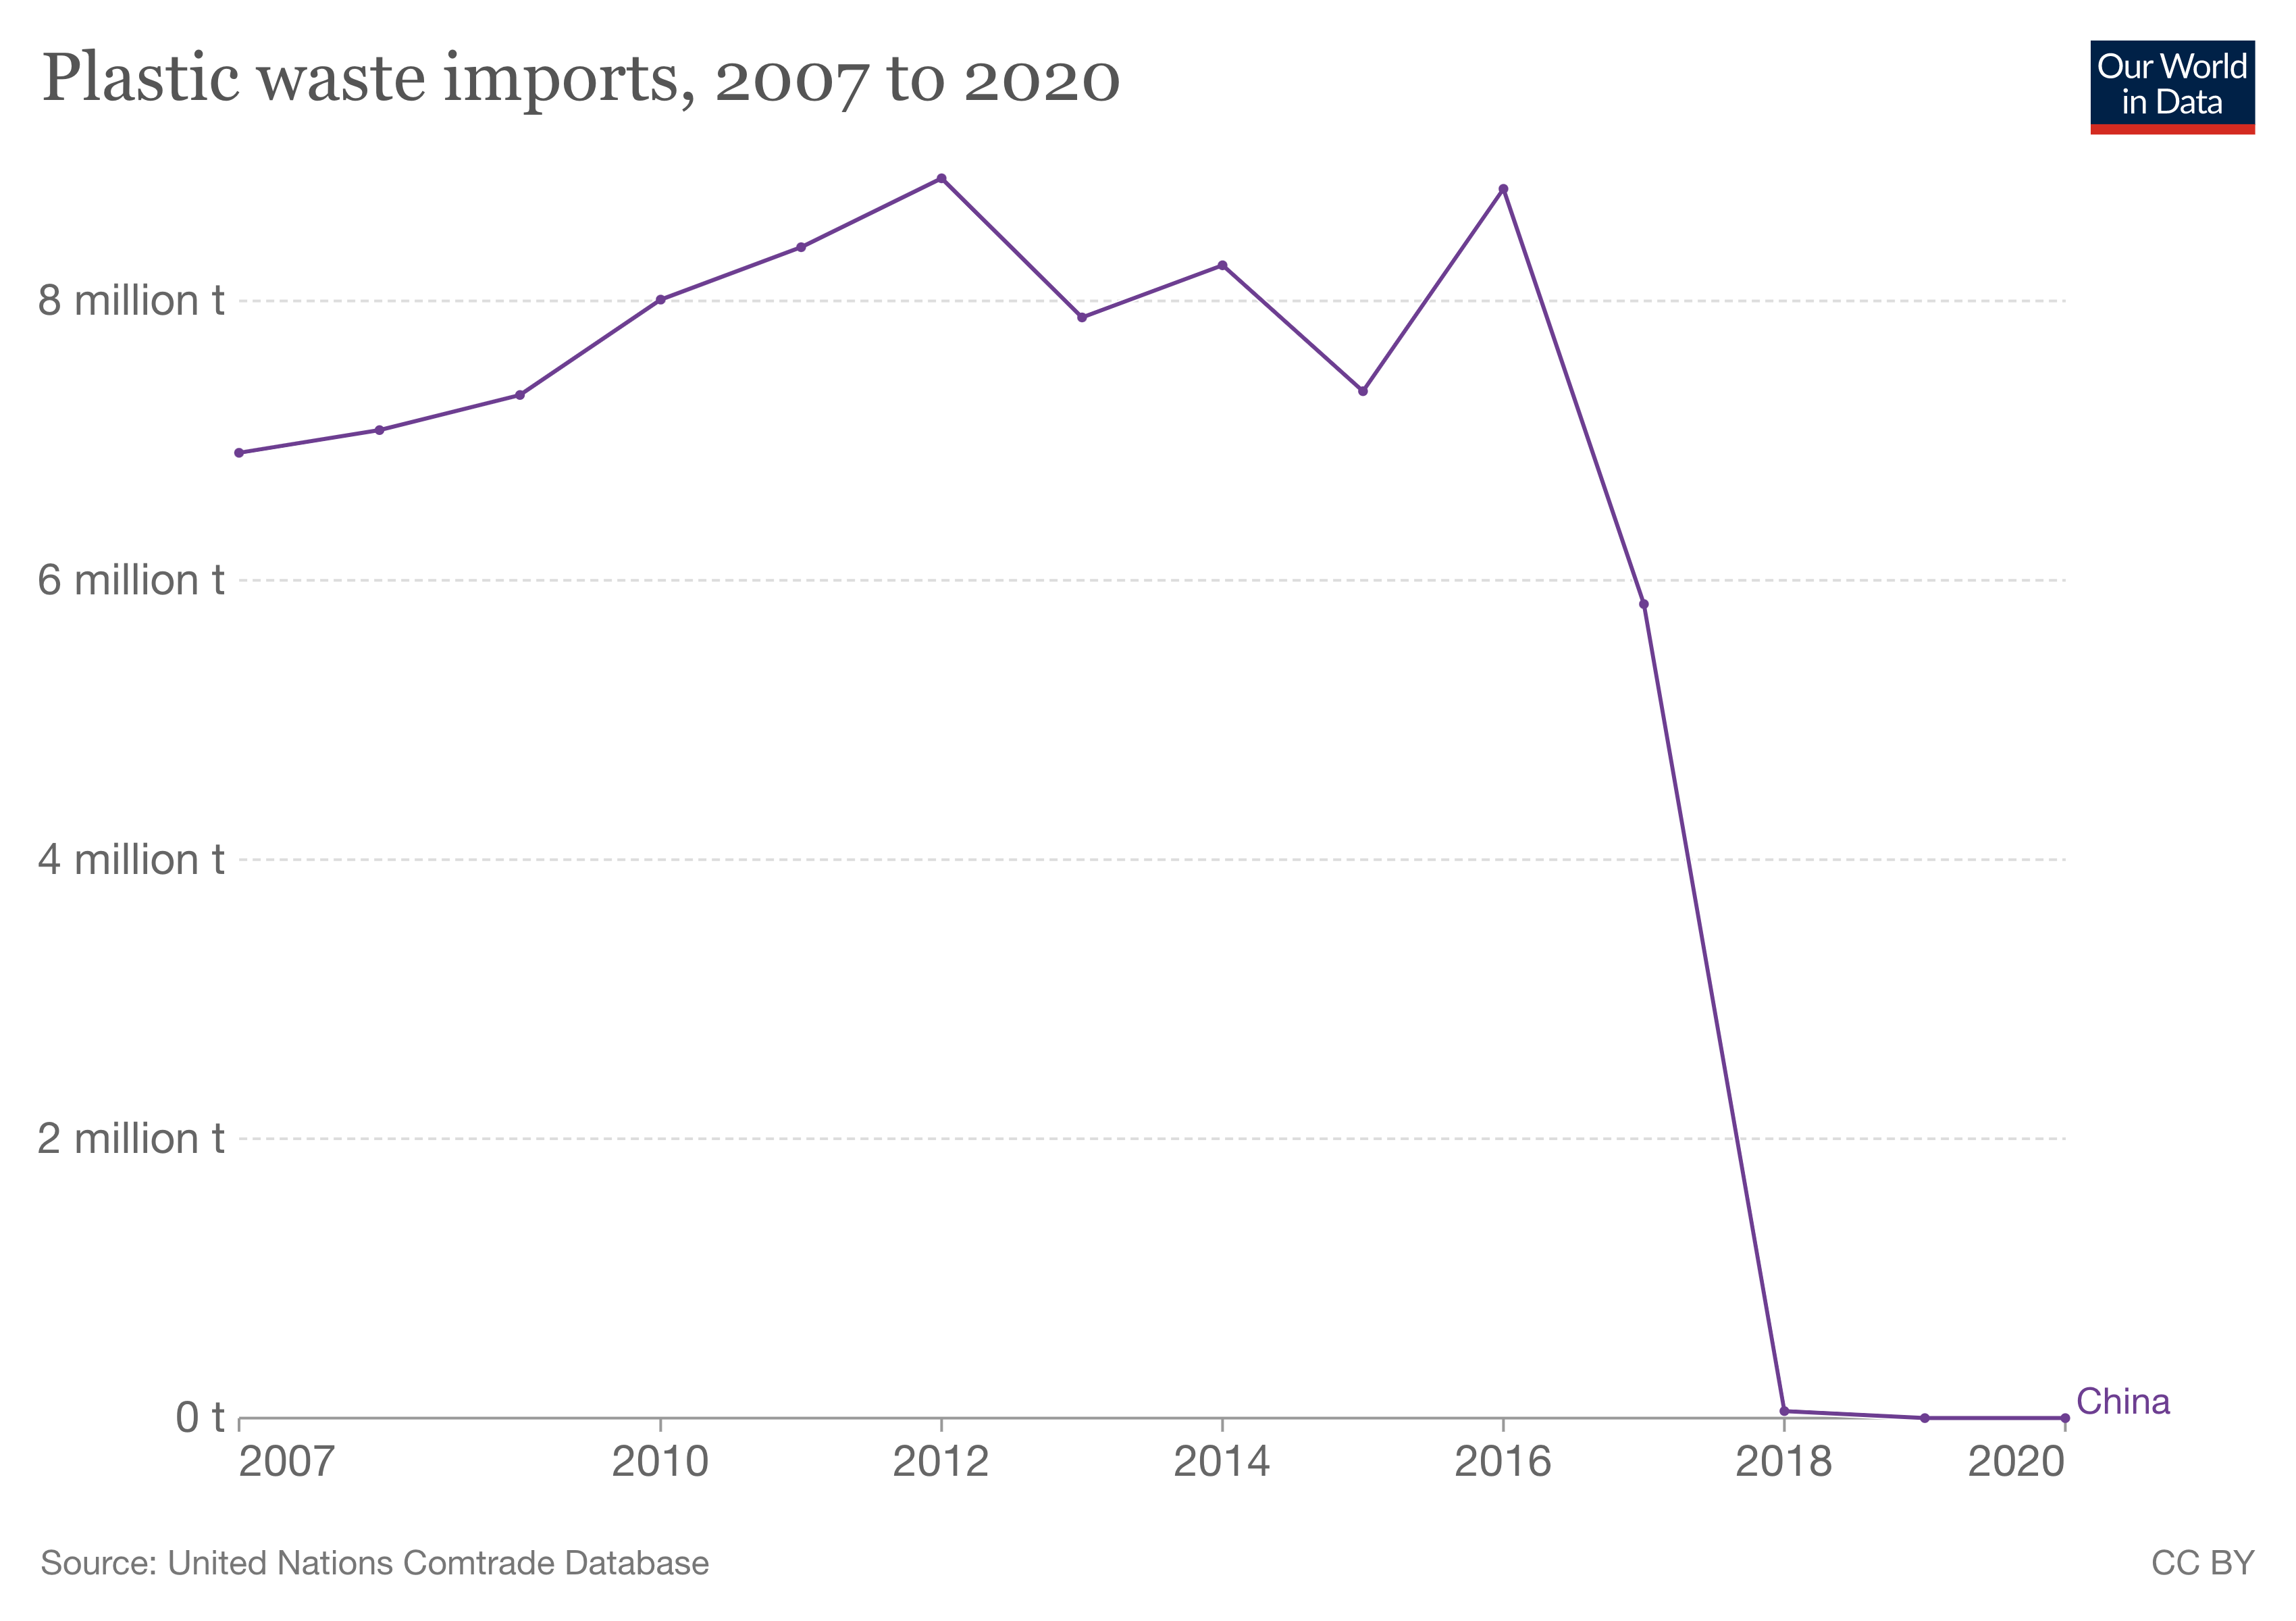
The reason for this dramatic decline was the Chinese government banning the import of most types of plastic waste in 2017. This was part of a broader policy decision to stop the import of 24 different types of solid waste including paper, textiles, and plastics. These bans were implemented as a result of environmental and health concerns from contaminated waste streams.
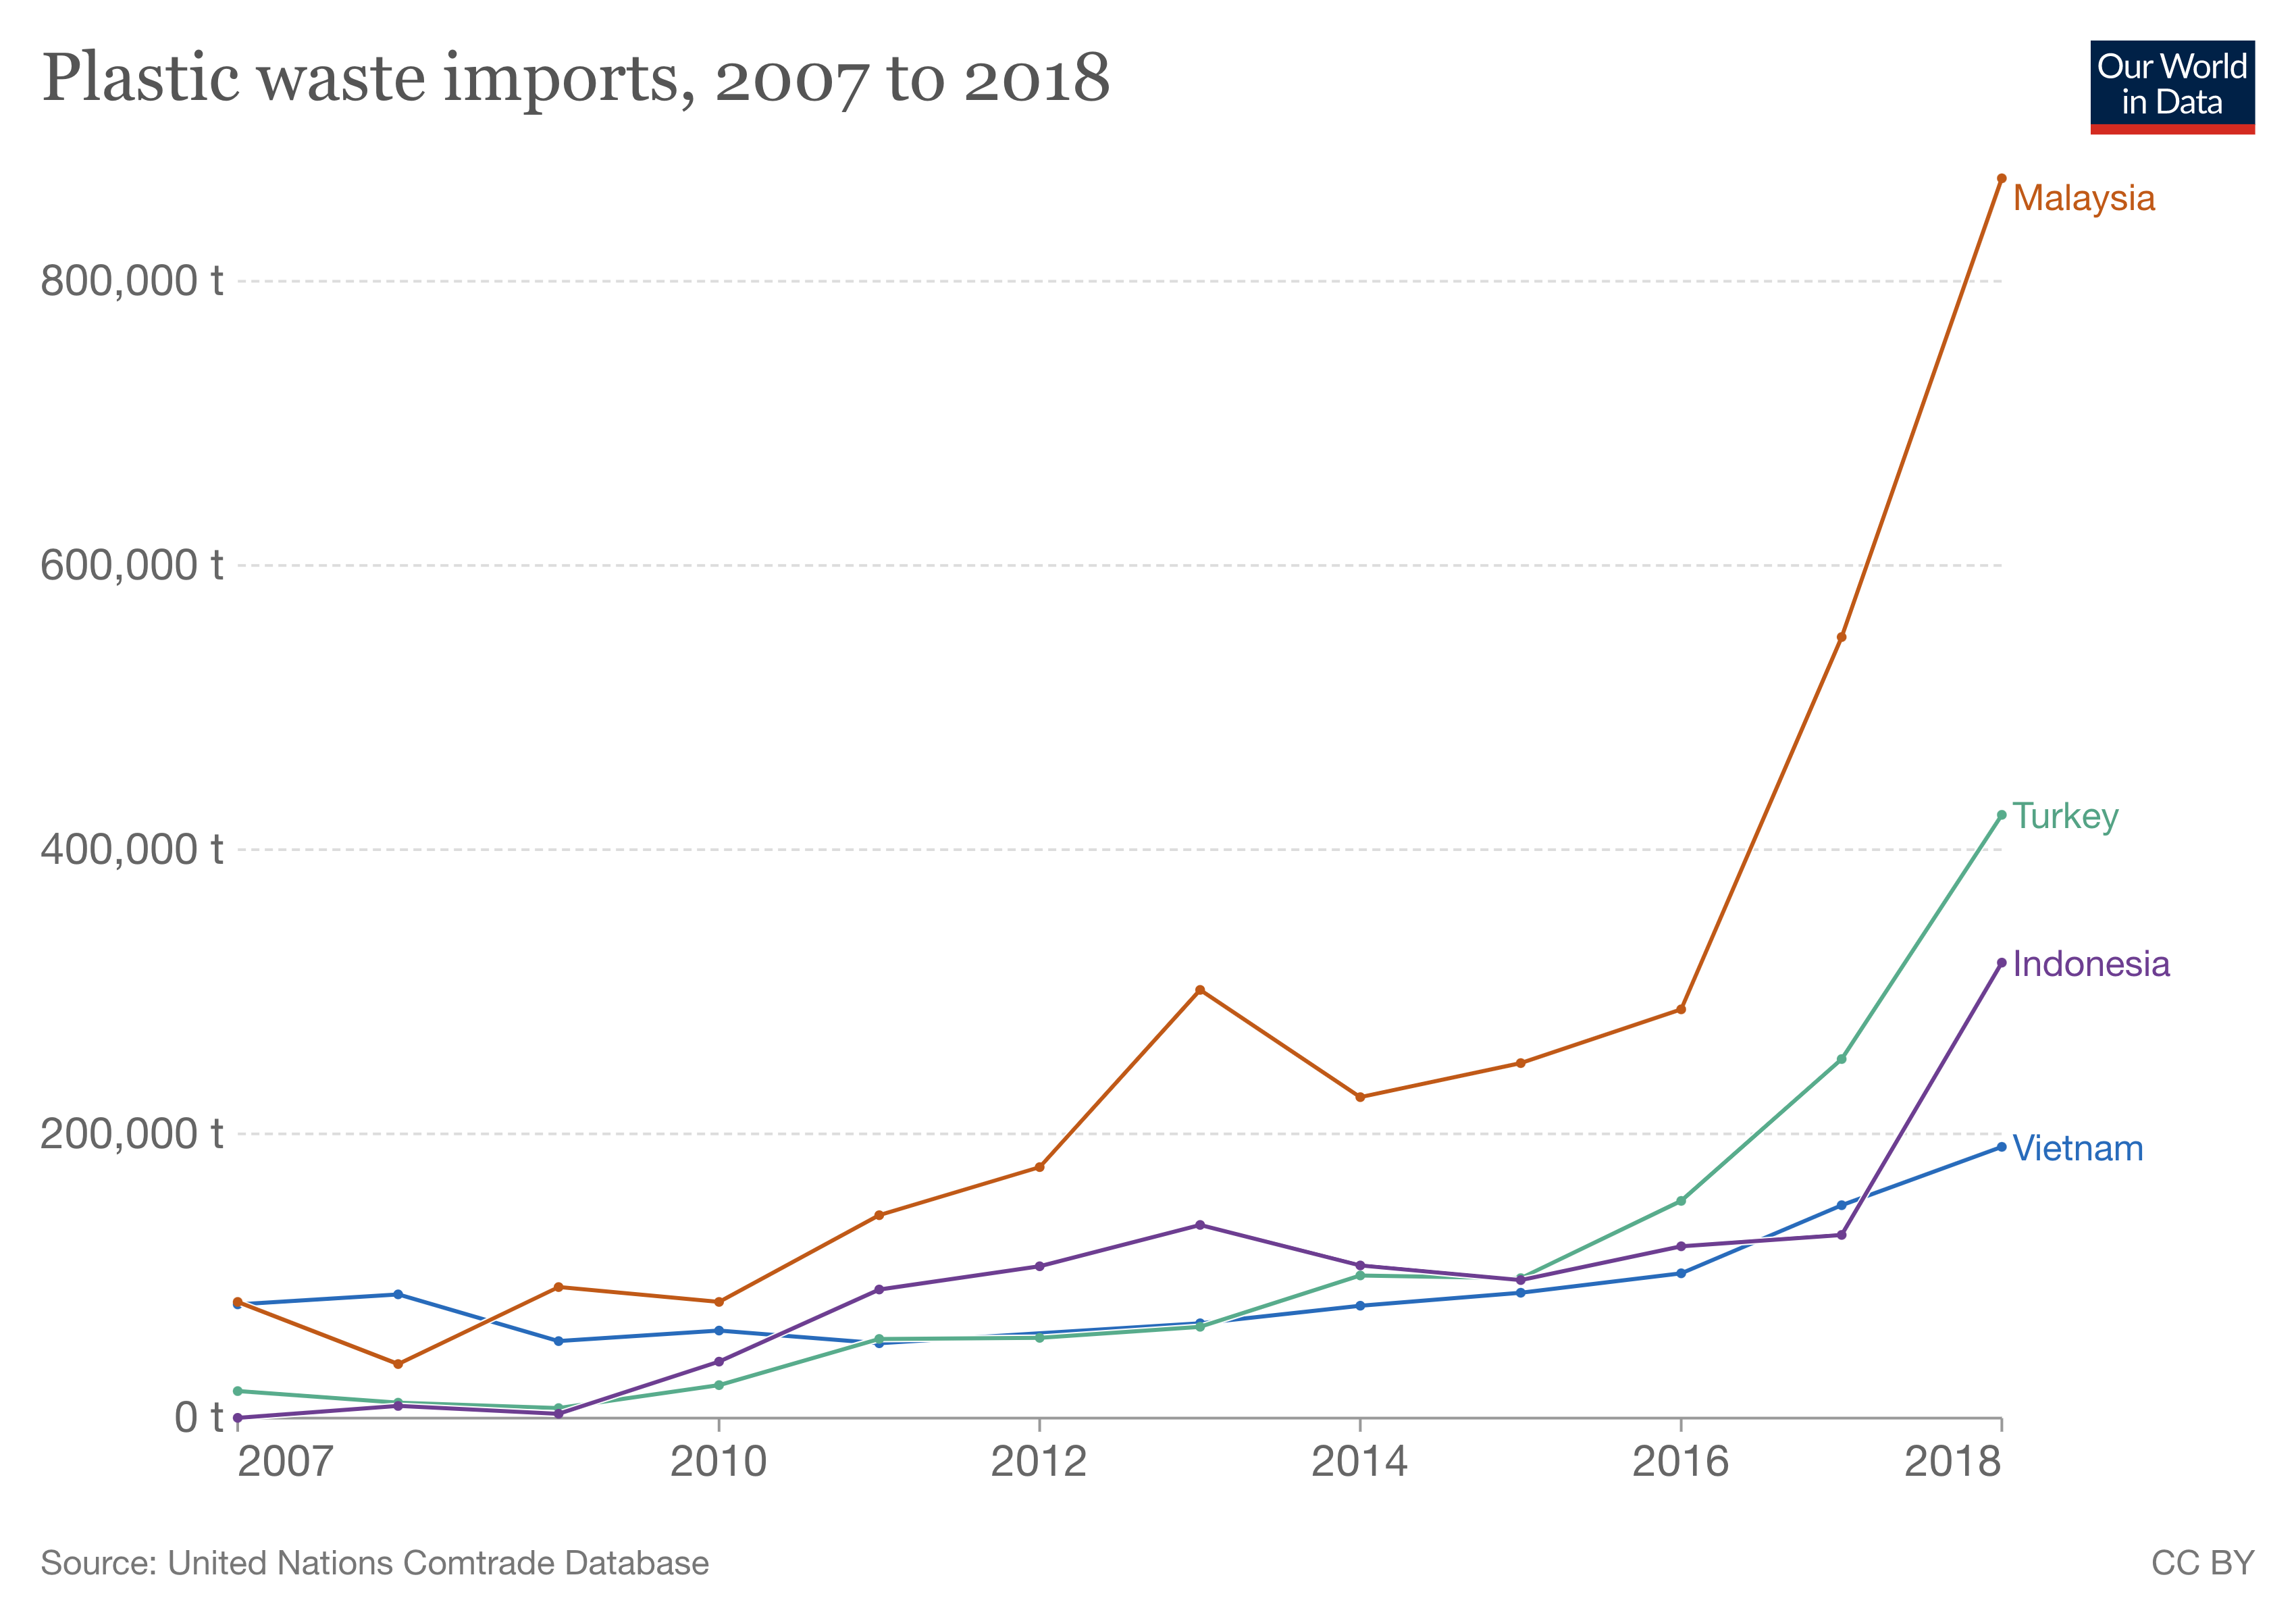
This ban had two major impacts.6 The first was that the total volume of plastic trade globally dropped significantly – we saw earlier that global trade has halved since 2017. The second was that other countries emerged to take China’s place as major importers. Most of them are also countries in Asia – Malaysia, Vietnam, Indonesia, the Philippines, and Turkey, started to import much more plastic than in previous years.
Most plastic waste is traded within world regions, rather than between them
Where does plastic waste flow across the world?
Europe is the region that exports the most plastic, but it’s also the region that imports the most.
This is true more generally. Most plastic is traded within a given region. European countries export most plastic to other European countries. Asian countries export most to other Asian countries.
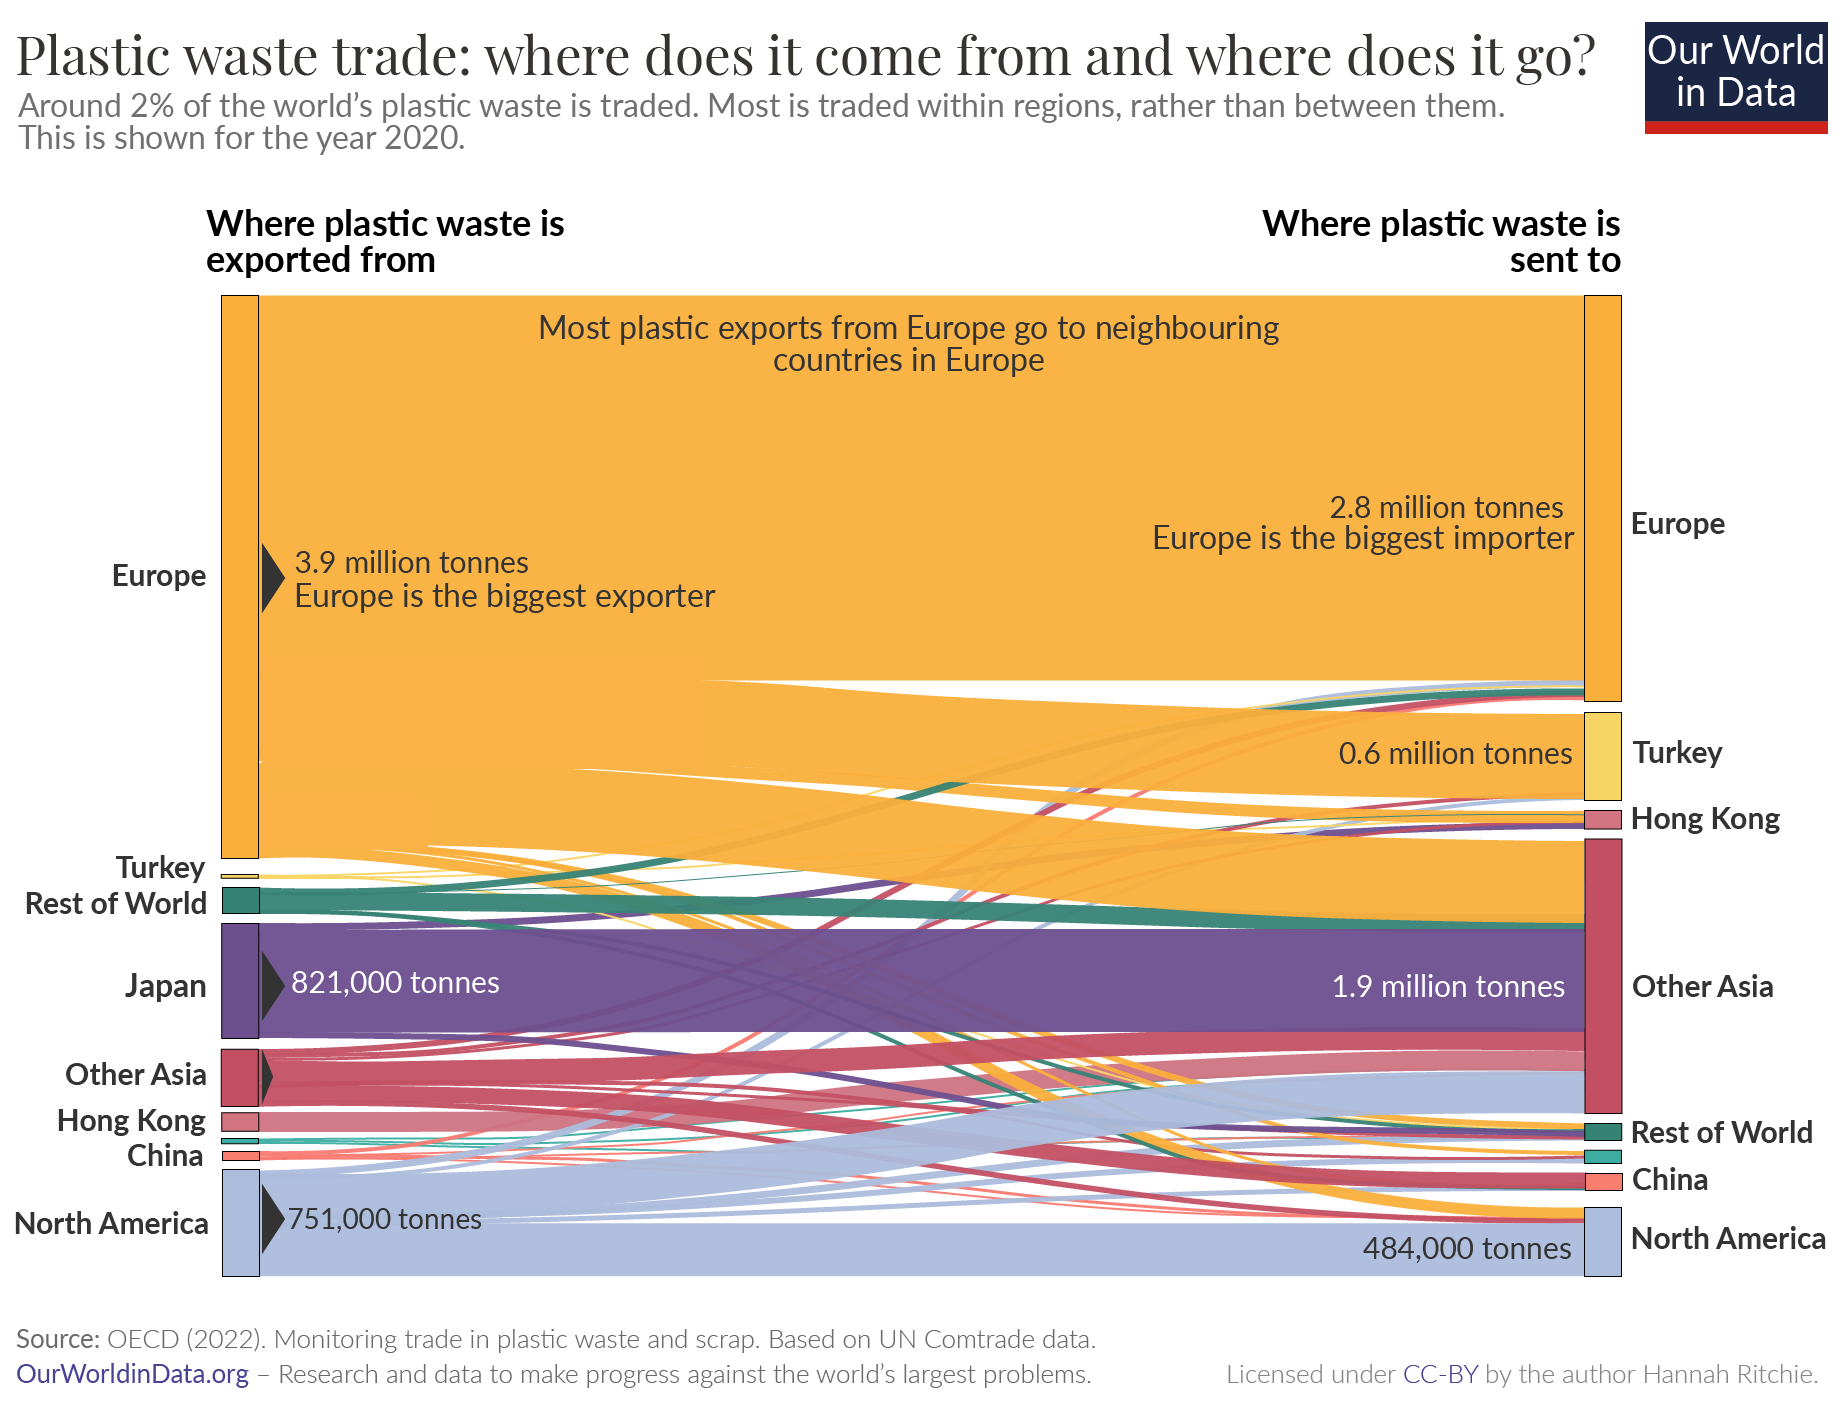
In the visualization, we see the flow of plastic across the world.7 On the left we have the exporters of plastic waste; on the right, we see where that plastic ends up. The height of each bar is proportional to the amount of plastic that is traded.
Europe is the biggest exporter of plastic. But, it’s also the biggest importer. Many countries across Europe trade with one another. At the national level, Germany is the biggest exporter and importer – it trades different plastics with its neighbors including the Netherlands, Poland, Austria, and Switzerland.8
This is also true of Asia, where Japan is the biggest exporter to other countries in Asia.
Do rich countries export most of their plastic waste overseas?
Many people think that rich countries ship most of their plastic waste overseas. But is this really true?
The short answer is no: many countries export some of their waste, but they still handle most of it domestically.
Let’s take the example of the UK. In 2010, it generated an estimated 4.93 million tonnes of plastic waste.9 It exported 838,000 tonnes overseas.
That means it exported about 17% of its plastic waste. That’s a substantial fraction – nearly one-fifth of it.
This data is for 2010, a year with good high-quality estimates of plastic waste generation. It’s still likely to be a reasonable estimate today. If anything, this share might have declined slightly, because waste exports have not increased, and waste generation probably has.
When it comes to the fraction of plastic waste that is exported, the UK is one of the largest exporters. For context, the US exported about 5% of its plastic waste in 2010. France exported 11%, and the Netherlands exported 14%.
Most rich countries are net exporters of plastic waste. And this can be a significant fraction of their waste. But it’s not the case that they handle most of it by offshoring it to other countries.
How much do rich countries contribute to plastic pollution through their exported waste?
This is the crucial question. While we don’t have an exact answer, we can give a plausible range.
To give an exact answer we would need to trace each piece of plastic pollution back to its original source. But we can do some calculations to estimate how much plastic is at higher risk of entering the ocean because of this trade.
In 2020, low-to-middle-income countries – where plastic waste was at a ‘higher risk’ of entering the ocean (because of poorer waste management systems) – imported around 1.6 million tonnes of plastic waste from rich countries. Here ‘rich countries’ include all countries in Europe and North America, plus Japan, Hong Kong, and OECD countries from other regions.10
How much of this plastic ends up in the ocean?
Again, we don’t know for sure. But we can run through a worst and best-case scenario.
Here we will assume that all of this traded waste was ‘mismanaged’, meaning it was not formally managed and was either littered or dumped in open landfills. In reality, not all of it will be mismanaged, but let’s be conservative here.
The probability that mismanaged waste ends up in the ocean varies a lot by country.
The country where the probability is highest is the Phillippines – an estimated 7% ends up in the ocean.11 We could imagine this being our ‘worst-case’ scenario: if rich countries exported all of their plastic trade to the Philippines, 7% of it might end up in the ocean. That would be 112,000 tonnes.12
In a ‘best-case’ scenario, only around 1% of mismanaged waste would end up in the ocean. Most countries across the world have a risk of just under 1%. In Asia, this would be typical of countries such as Thailand and Cambodia. In this ‘best-case’ scenario, around 16,000 tonnes of ocean plastics each year would enter the ocean from trade.13
This gives us an upper and lower bound for the contribution of trade from rich countries. Since around one million tonnes of plastic enters the ocean each year, rich countries would contribute between 1.6% (in the best case) and 11% (in the worst case) of ocean plastics through shipping waste overseas.14
The true figure probably falls somewhere in between. A reasonable estimate might be around 5% of ocean plastics. In reality, it might be a bit lower because a tonne of waste that is bought and traded is more likely to be managed well than the average tonne of waste in a country.
I estimate that a few percent of ocean plastics could result from trade from rich countries. A figure as high as 5% would not be unreasonable.
Ending plastic trade would only do a bit to reduce plastic pollution – what is needed are better waste-management systems
Stopping exports of plastic waste to countries with poor waste management would help to tackle ocean pollution.
If rich countries banned the export of plastic waste to these countries, we might reduce plastic pollution a bit: perhaps up to 5%.
But, an end to trade won’t stop plastic pollution. Only a small fraction of the world’s plastic waste is traded – under 2%. And most – two-thirds of it – ends up in richer countries, where it’s very unlikely to end up in the ocean.
There are obvious reasons to reduce these exports beyond the plastic pollution problem. Countries have been guilty of exporting contaminated recycling plastic packages – one of the drivers for countries to ban plastic imports. This is unacceptable: poorer countries are not a dumping ground for the rich.
Most of the world’s waste is handled domestically and most of the waste that enters the oceans stems from these countries. To really tackle the problem we need to do two things: scale waste management systems in rich countries; the fact that they are exporting waste overseas suggests they have under-invested in practices at home; and, importantly, improve waste management infrastructure and practices in low-to-middle-income countries, as this is where most plastic pollution originates.
Republished with permission of Our World In Data under a Creative Commons license. Read the original article.
The Power of Play