Electric vehicles are an important solution to decarbonizing transport.
Electric cars tend to have a lower carbon footprint than petrol or diesel cars over their lifetimes. While more carbon is emitted in the manufacturing stage, this “carbon debt” tends to pay off quickly once they’re on the road.1 The carbon savings are higher in countries with a cleaner electricity mix, and these savings will also increase as countries continue to decarbonize their electricity grids.
How quickly are countries moving to electrified transport? Which countries are leading the way?
In this article we look at data from across the world on electric vehicle (EV) sales, and stocks on the road.
This data comes from the International Energy Agency. It publishes its Global EV Outlook every year. We will continue to update this data every time a new release is published.2
What share of new cars are electric?
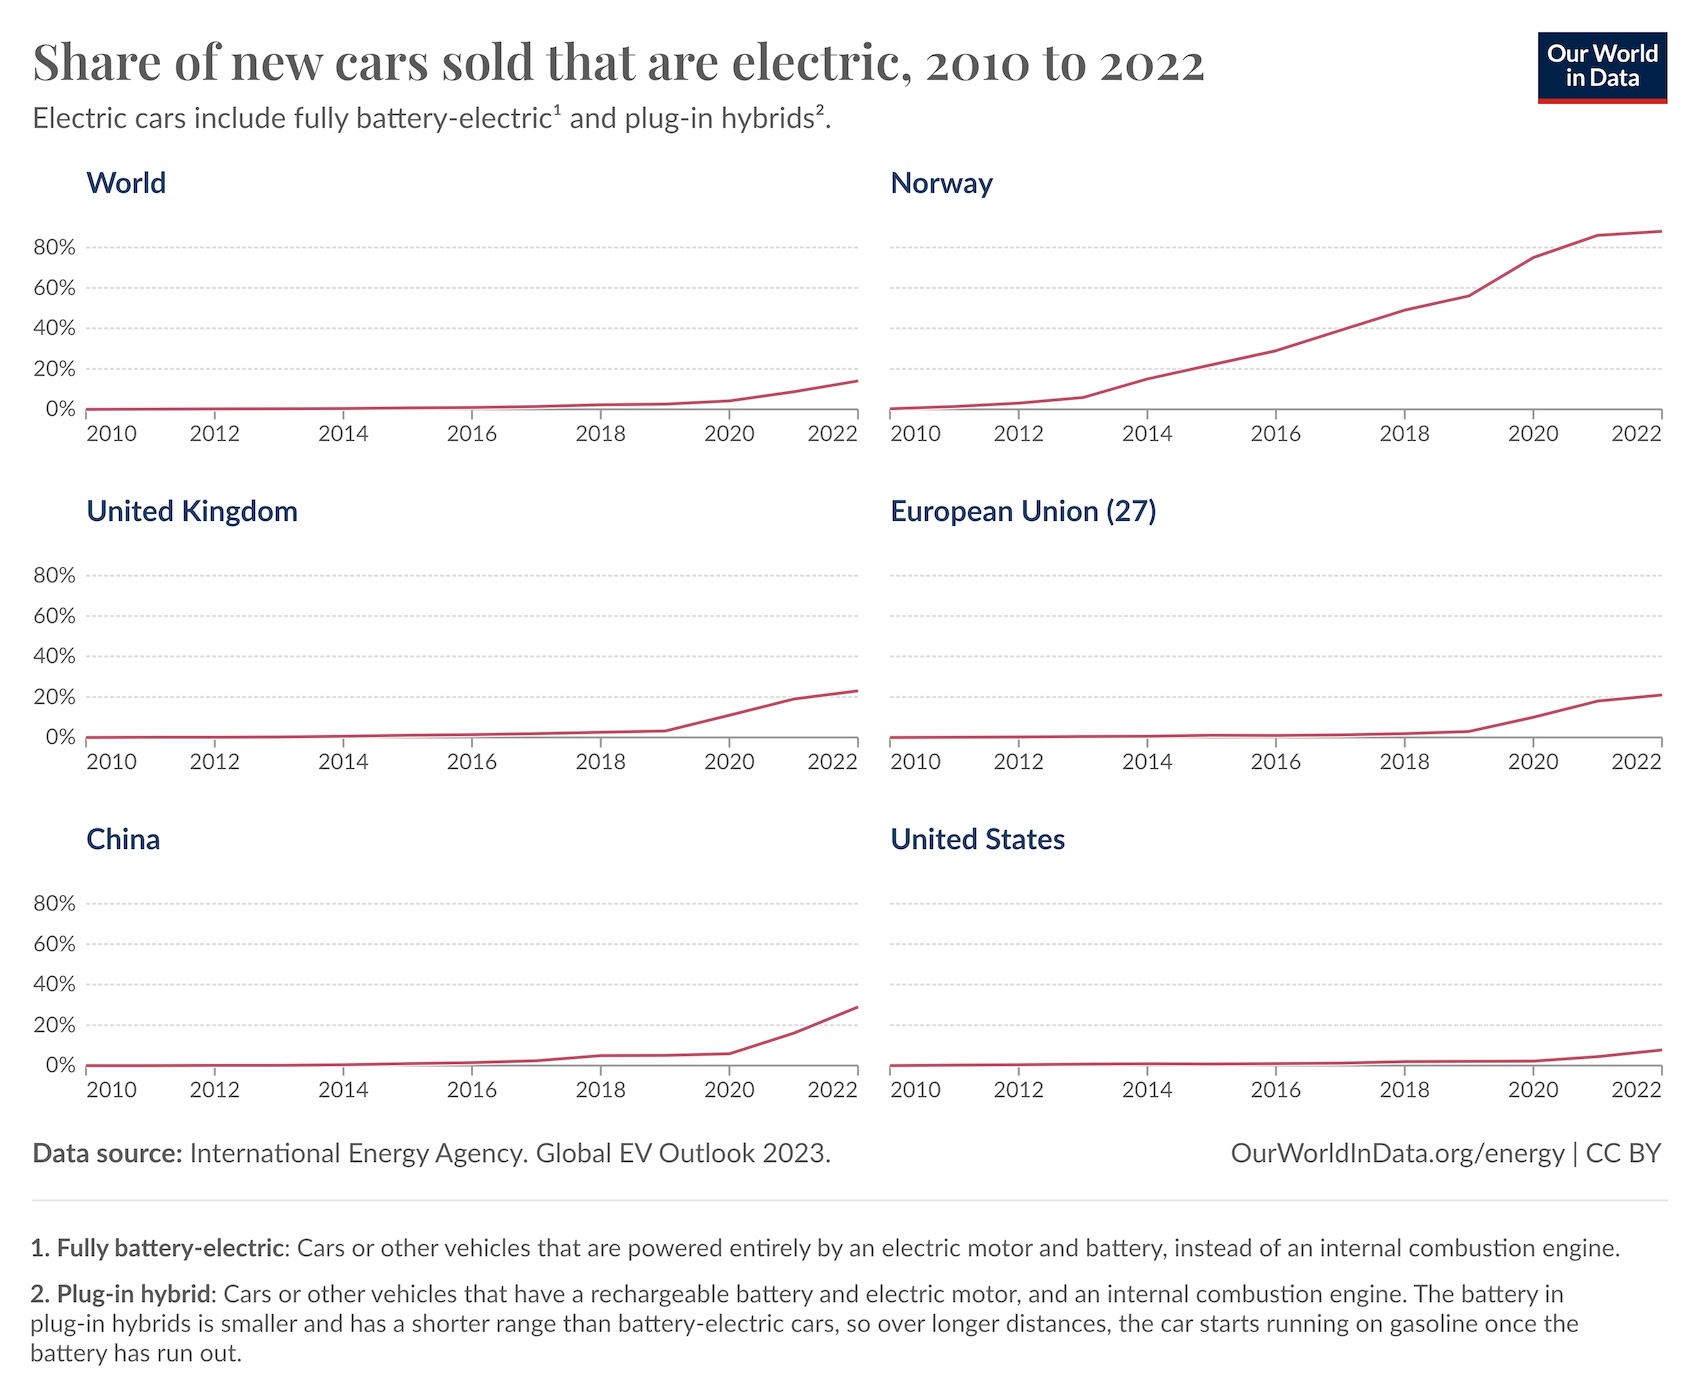
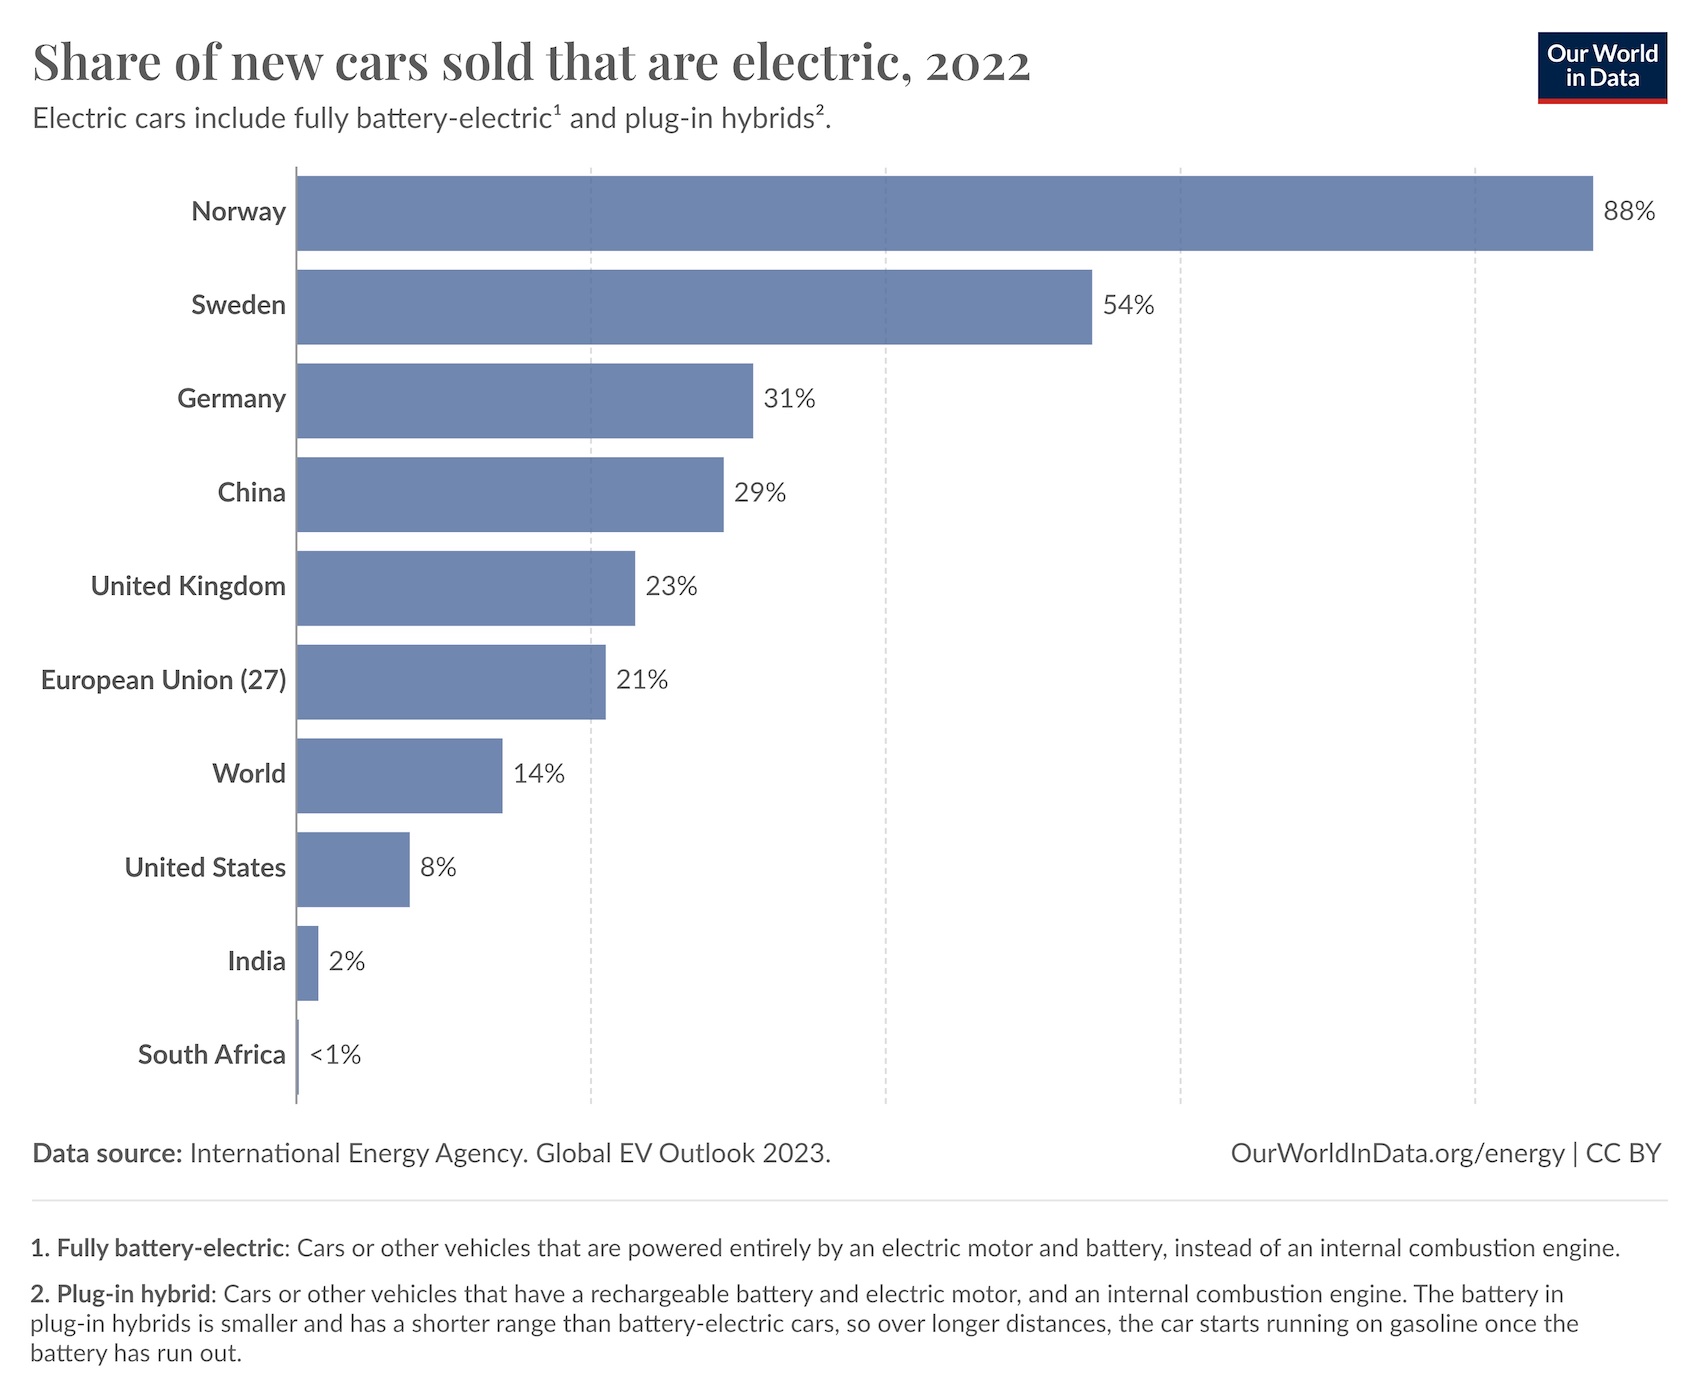
Sales of electric cars started from a low base but are growing quickly in many markets.
Globally, around 1-in-7 new cars sold was electric in 2022 (the preliminary estimate for 2023 is around 1-in-5). In Norway, the share was well over 4-in-5, and in China, it was around 1-in-3.

In the chart below you can explore these trends across the world.
Here, “electric cars” include fully battery-electric vehicles and plug-in hybrids.
Fully-electric cars vs. plug-in hybrids
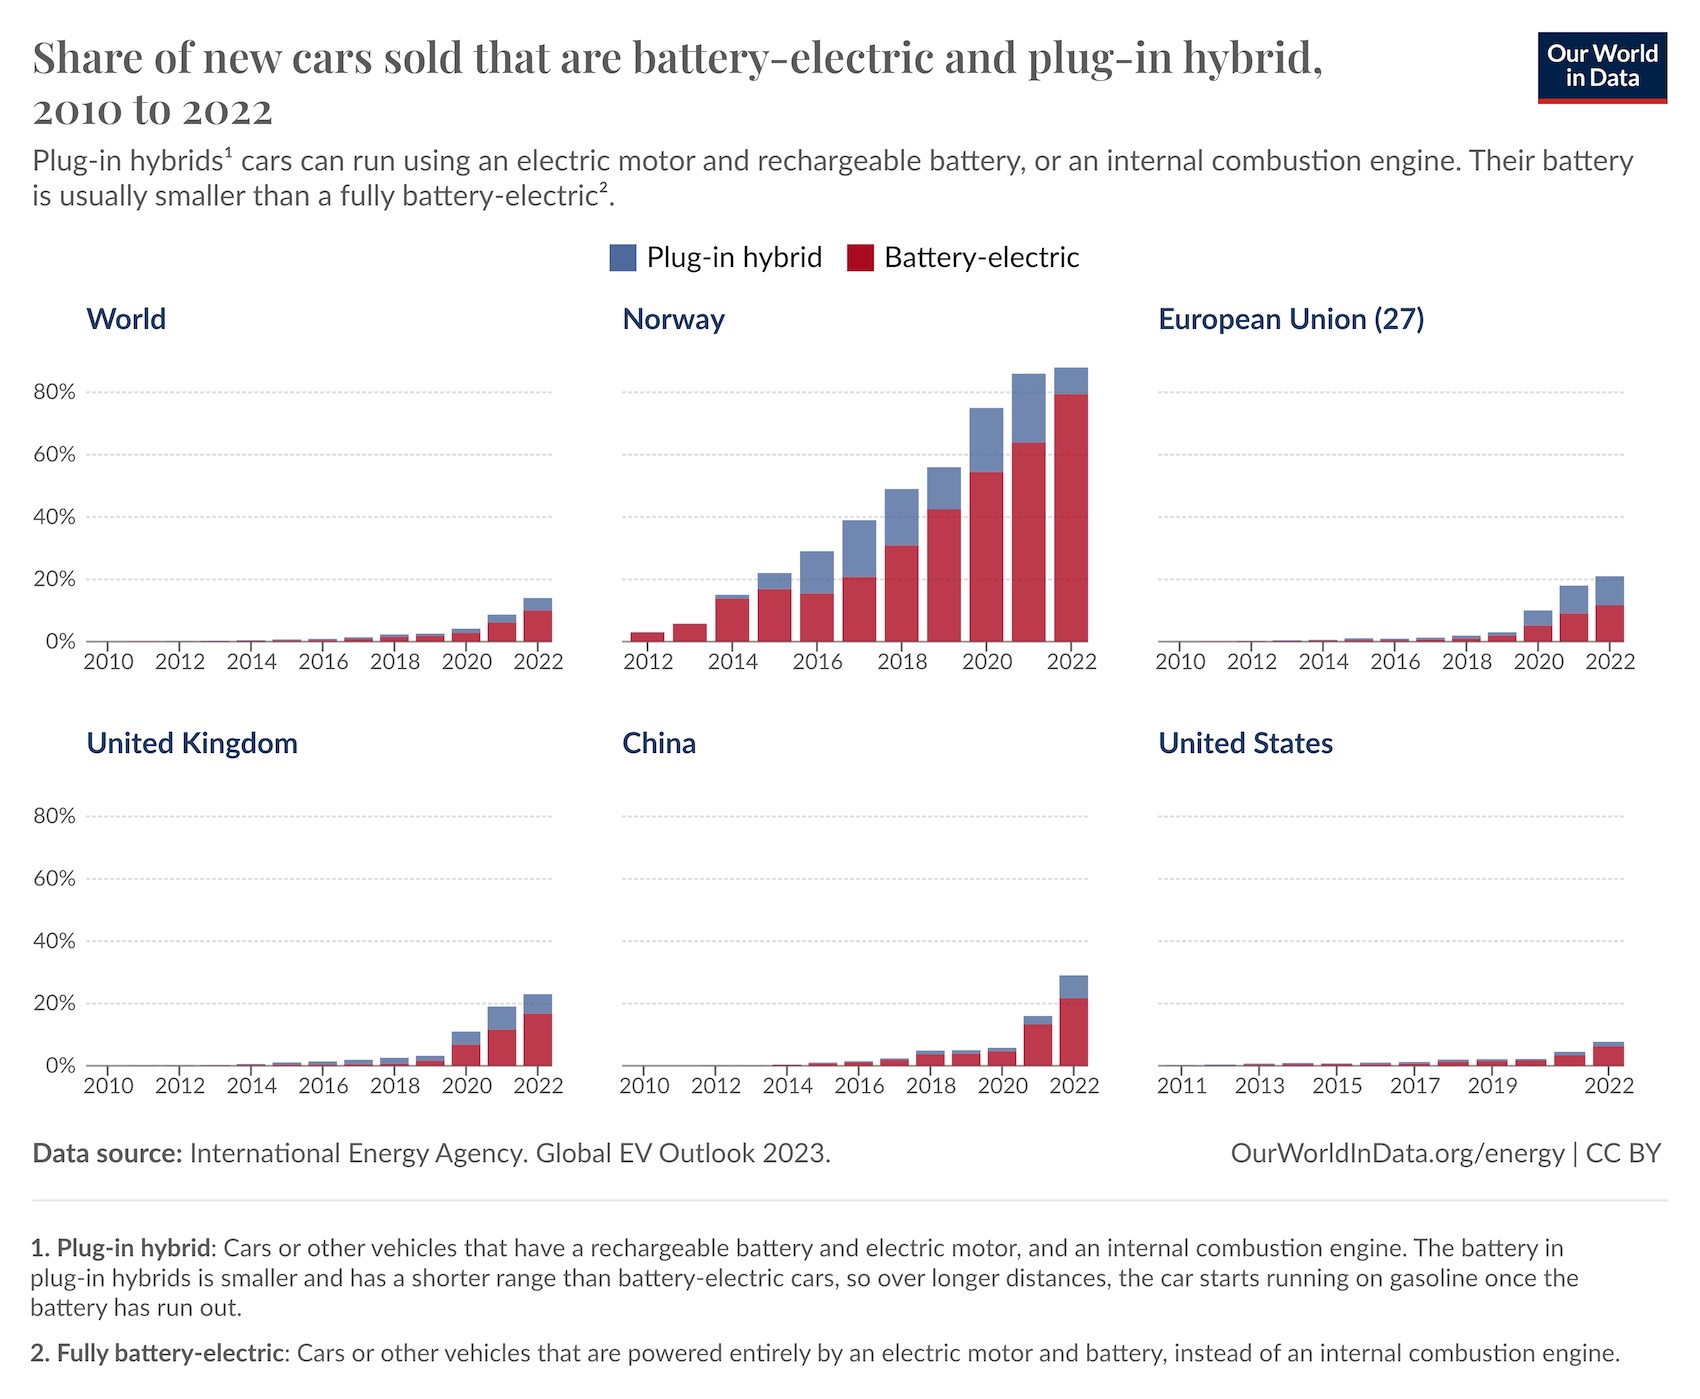
“Electric cars” include battery-electric and plug-in hybrid vehicles. The difference is that fully battery-electric cars do not have an internal combustion engine, whereas plug-in hybrids have a rechargeable battery and electric motor and an internal combustion engine that runs on gasoline.
That means a plug-in hybrid could be driven as a standard petrol car if the owner did not charge the battery. The battery in plug-in hybrids is smaller and has a shorter range than battery-electric cars, so over longer distances, the car starts running on gasoline once the battery has run out.
Since plug-in hybrids will often run on petrol, they tend to emit more carbon than battery-electric cars. However, they do usually have lower emissions than petrol or diesel cars.3
In the first chart below you can see electric car sales broken down by these two technologies. This is given as a share of new cars sold each year.
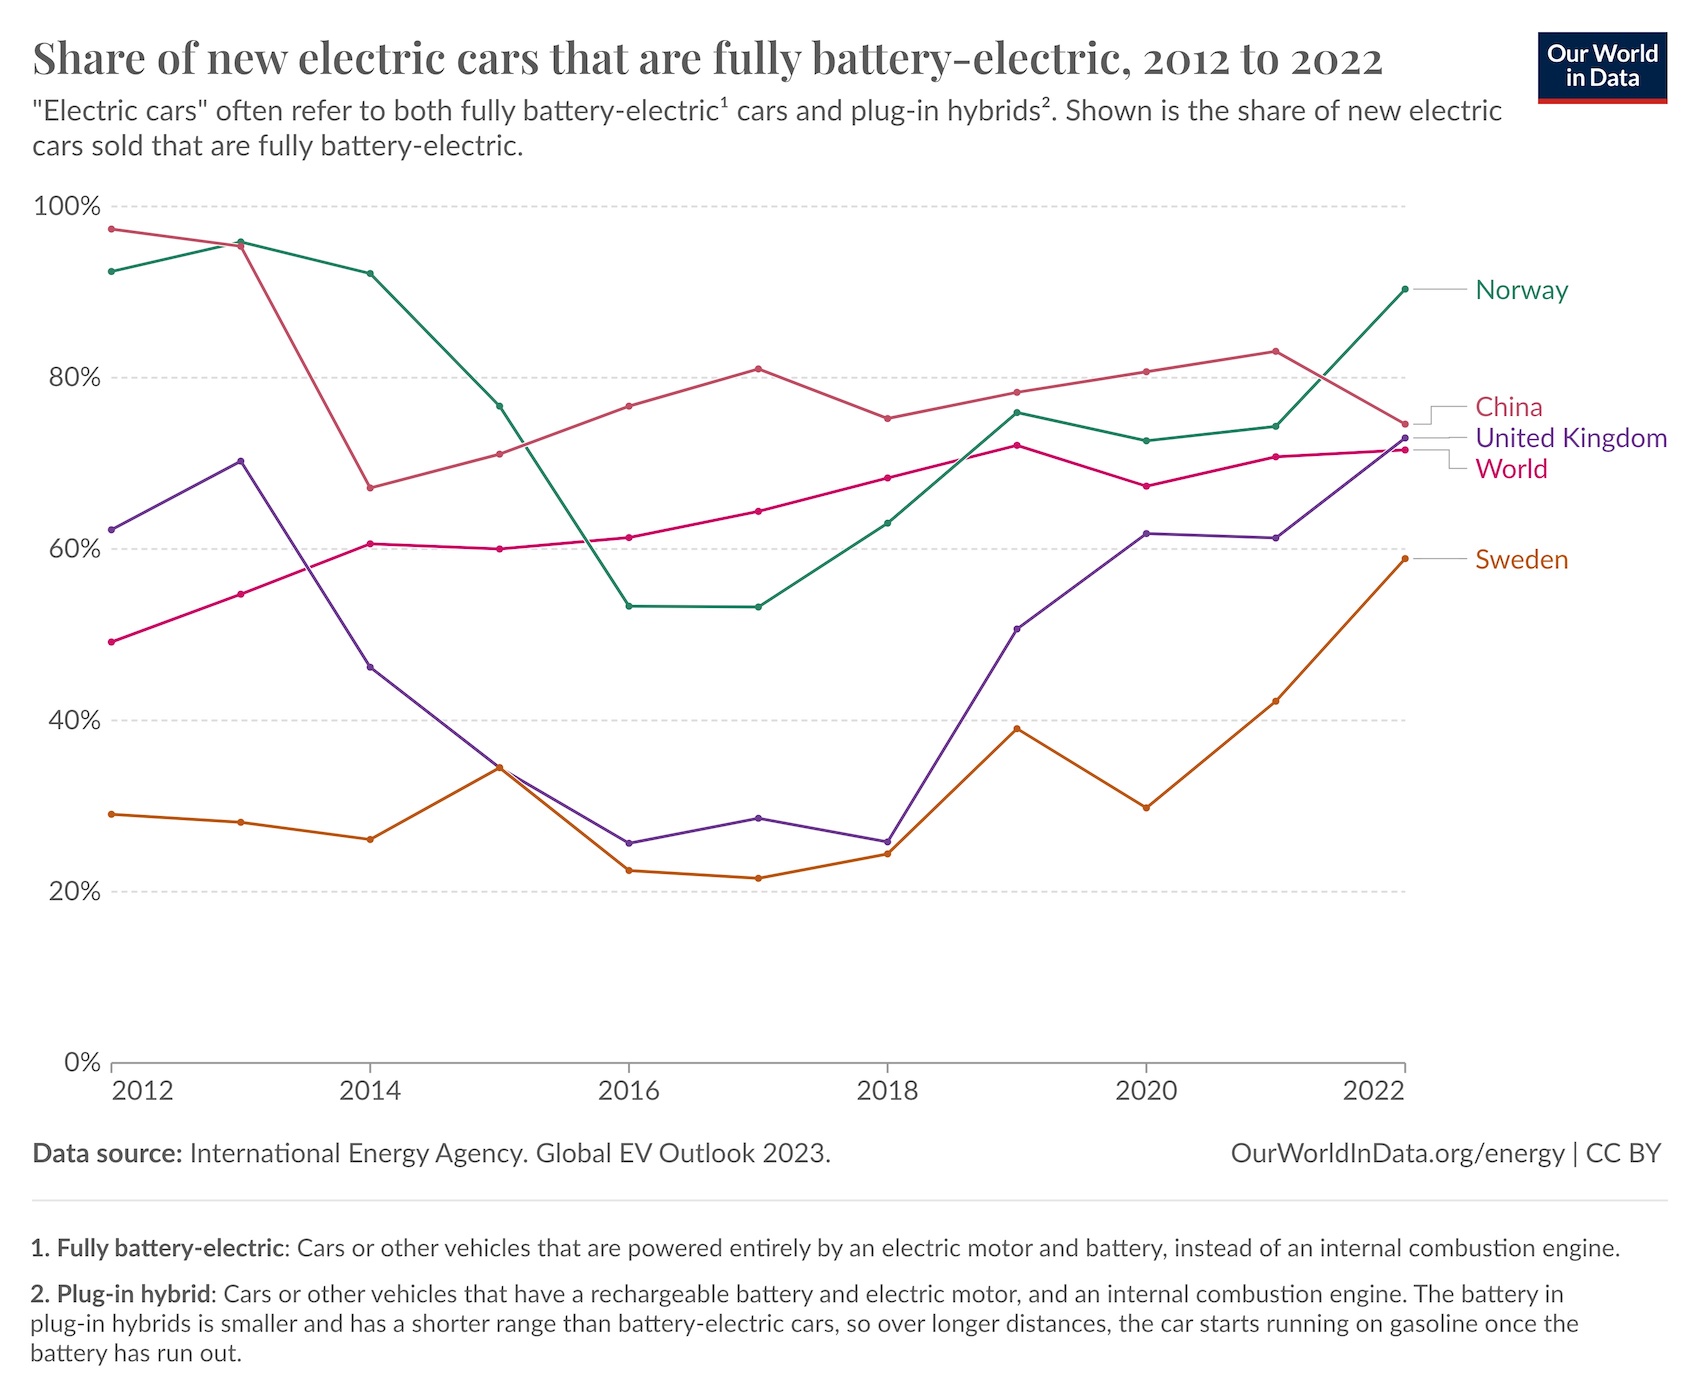
In the second, you will find the share of new electric cars sold that are fully battery-electric.
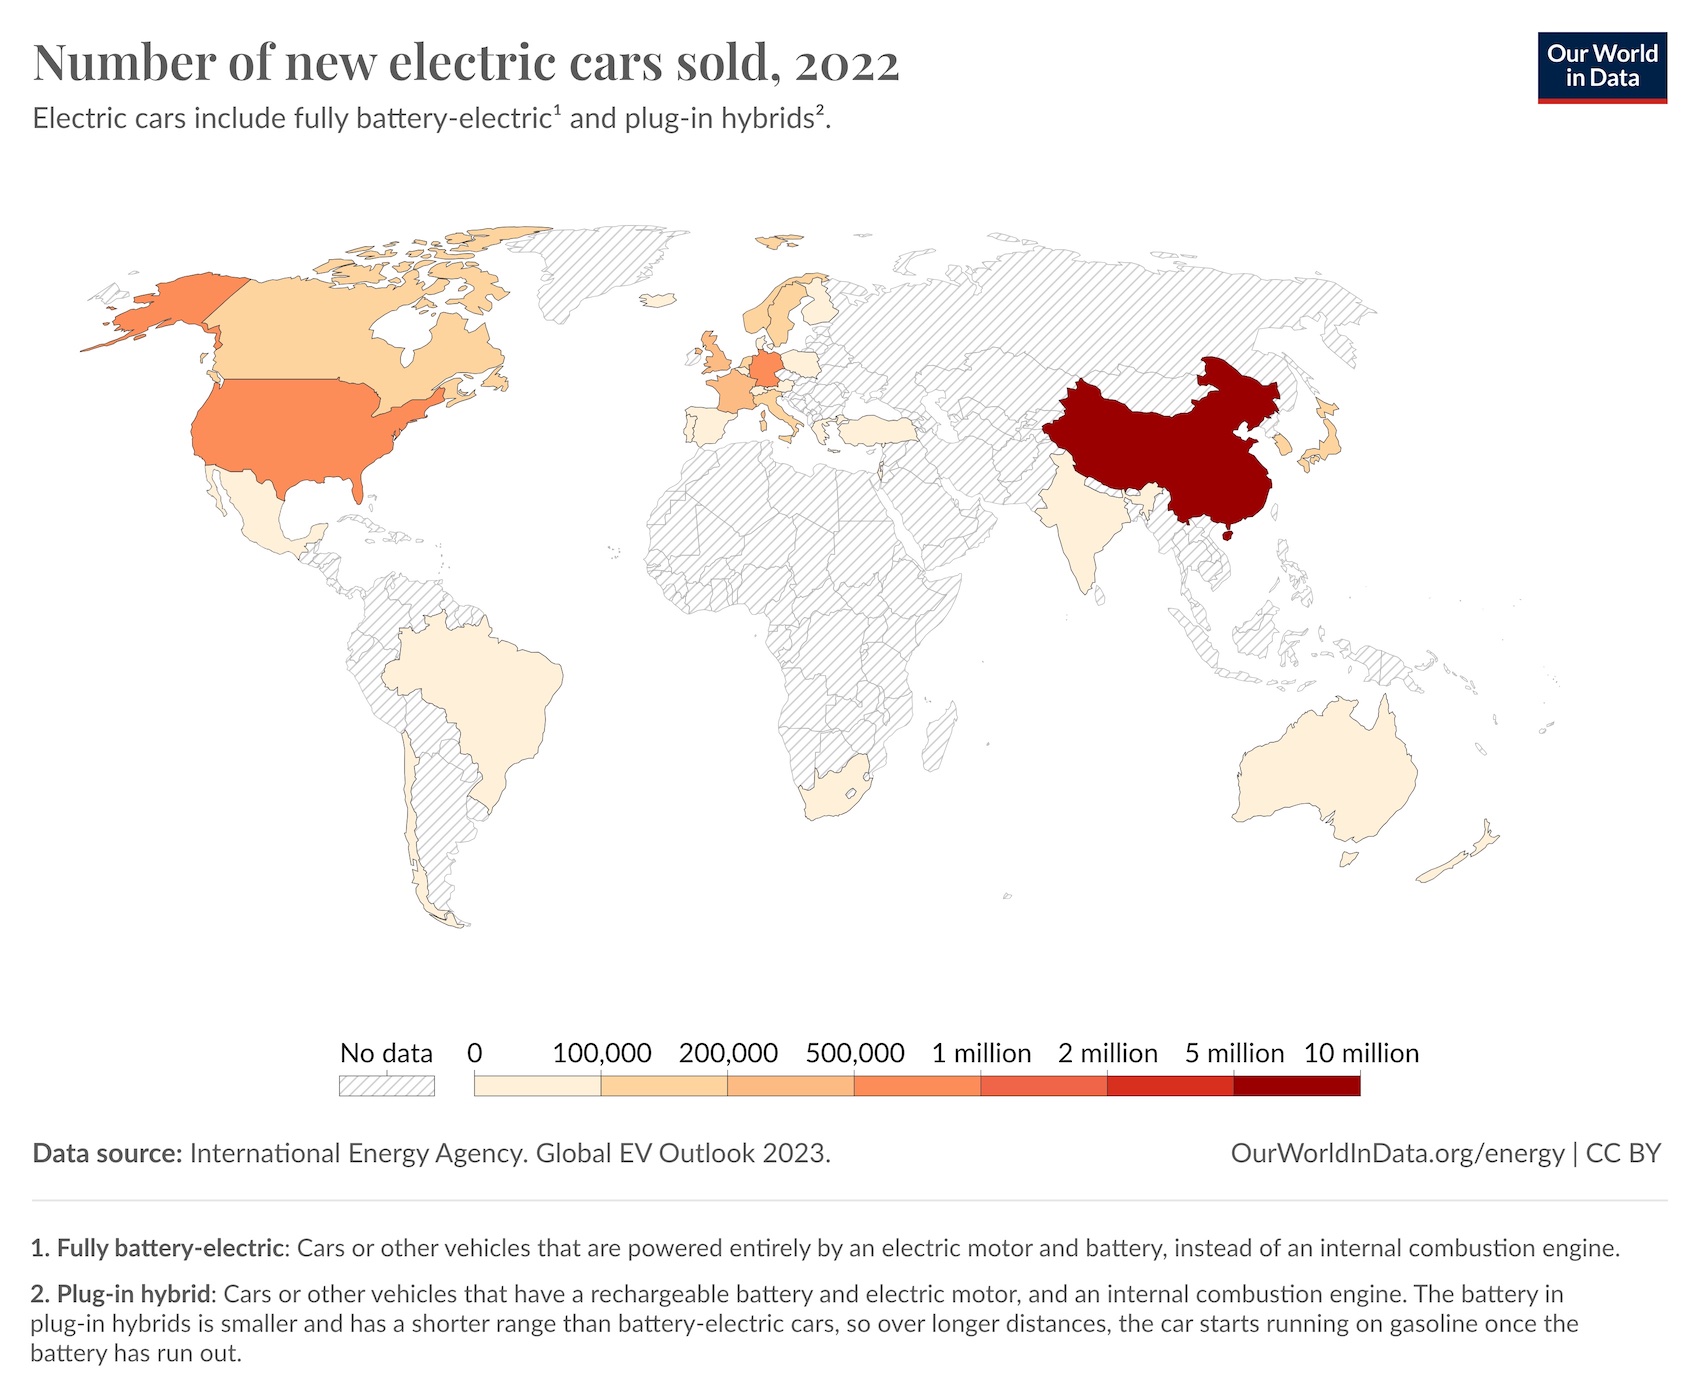
How many new electric cars are sold each year?
The chart below shows the total number of new electric cars sold. Again, this includes fully battery-electric and plug-in hybrids.
Clicking on any country will show how sales have changed over time.
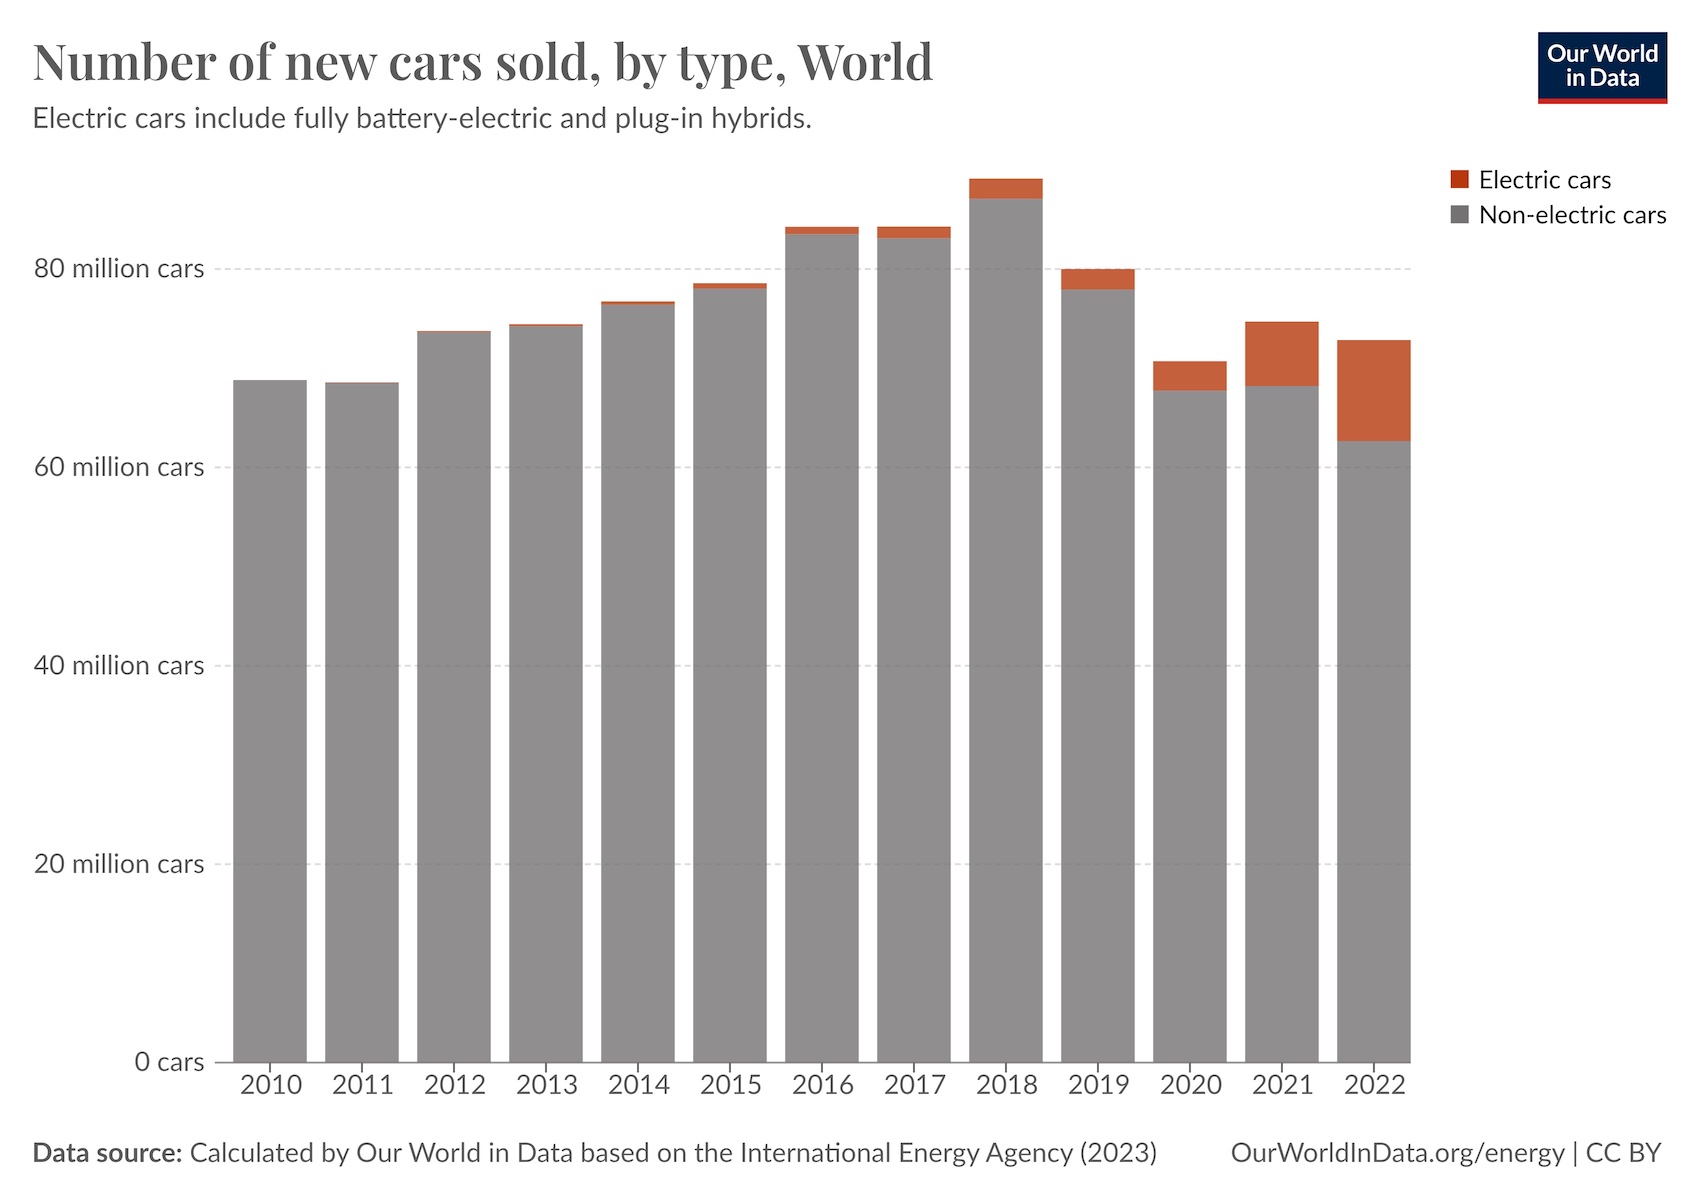
How many new internal combustion engine cars and electric cars are sold each year?
Based on the data published by the IEA on the number of electric cars sold, and EV sales as a share of all new cars, we can calculate the absolute number of new cars of each type sold each year.
These figures suggest that global sales of non-electric cars peaked in 2018. This aligns with other estimates published elsewhere; for example, Bloomberg New Energy Finance reported that sales peaked in 2017.
You can explore this data for other countries in the chart below too.
What share of cars on the road are electric?
The cars that are on the road today represent sales data over more than a decade.
This can be captured in a metric called “stocks”. It’s an approximation of the number of cars that are in use and represents the balance of cars being added and those that are being retired.
Because people use their cars for a long time, it takes time before new sales have a visible influence on car stocks. That means the share of cars on the road that are electric is much lower than the share for new sales.
The share of cars in use that are electric is shown in the chart below.
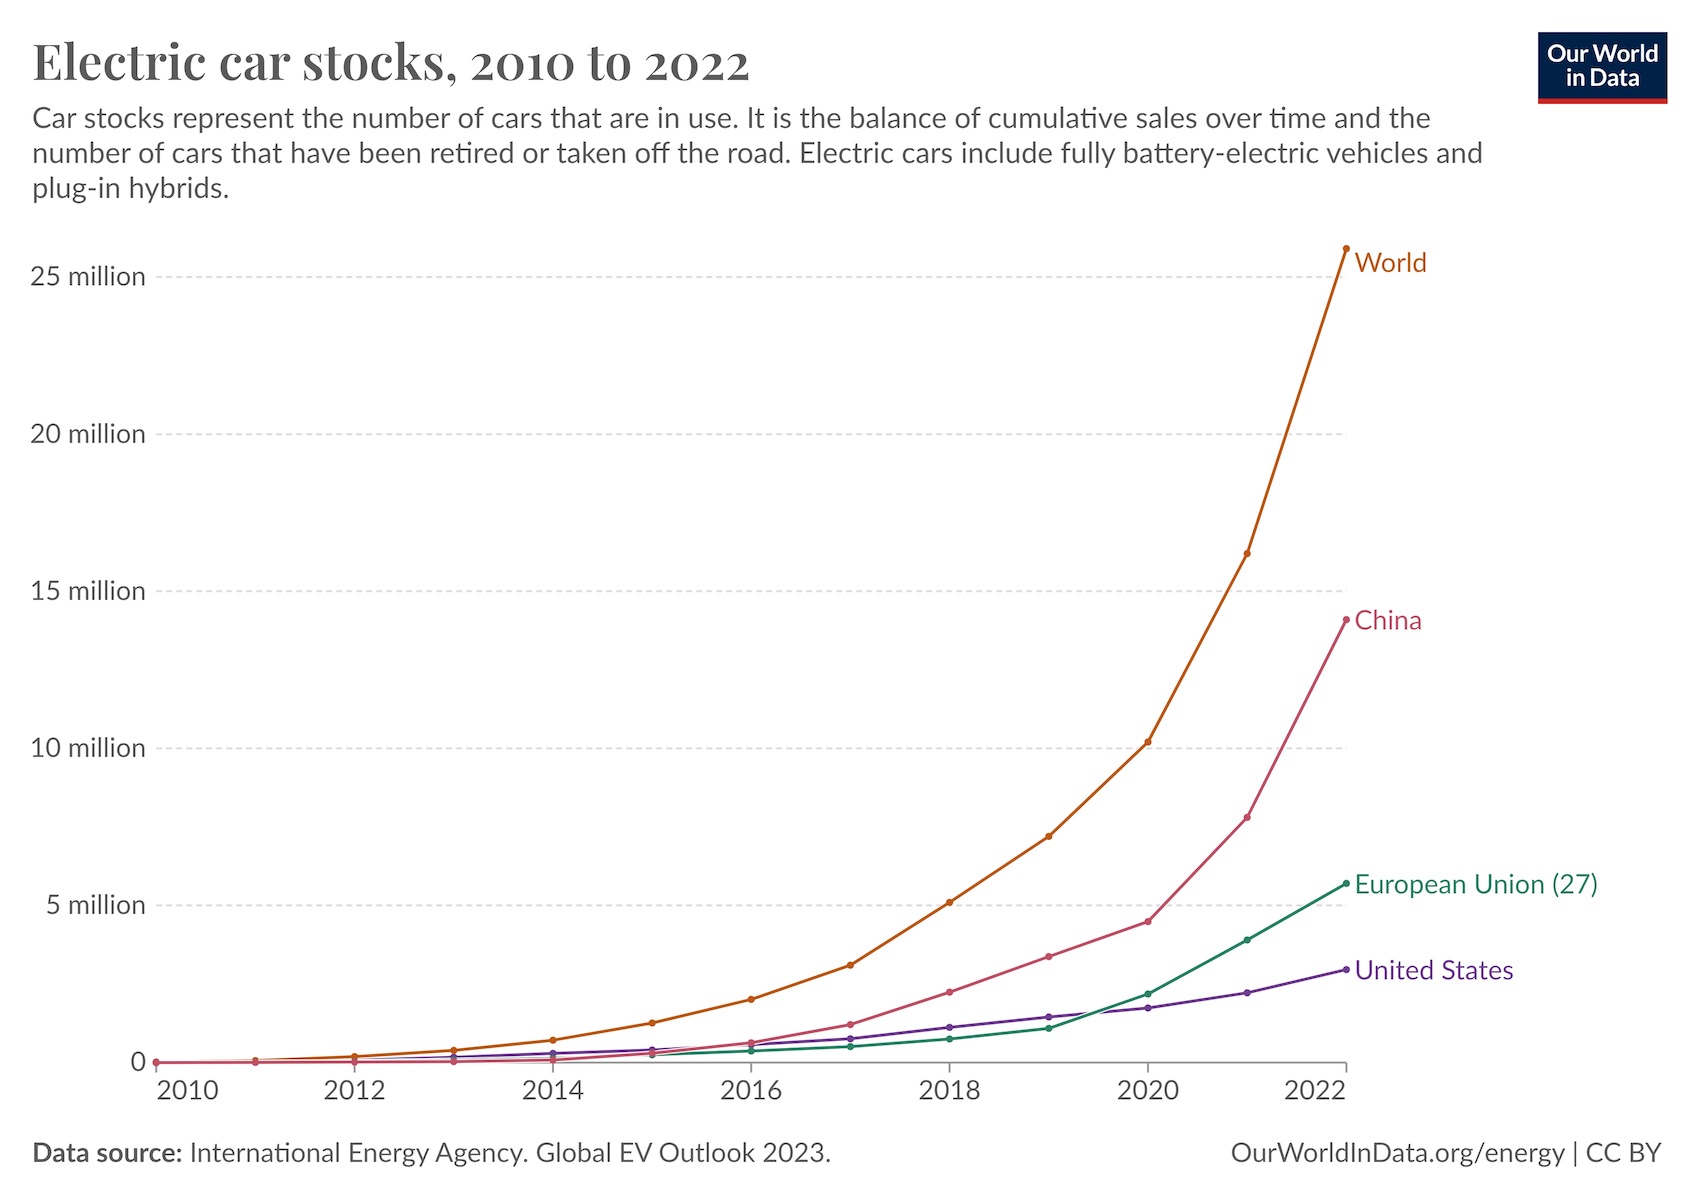
How many electric cars are on the road?
The number of electric cars on the road is the cumulative total of sales over the years (minus any cars that have been taken off the road).
The total number of electric car stocks is shown in the chart below. There are now more than 25 million electric cars in use globally, and this is growing quickly.
Republished under a Creative Commons BY license from Our World In Data. Read the original article.
The Power of Play