470 – The Twittering Classes
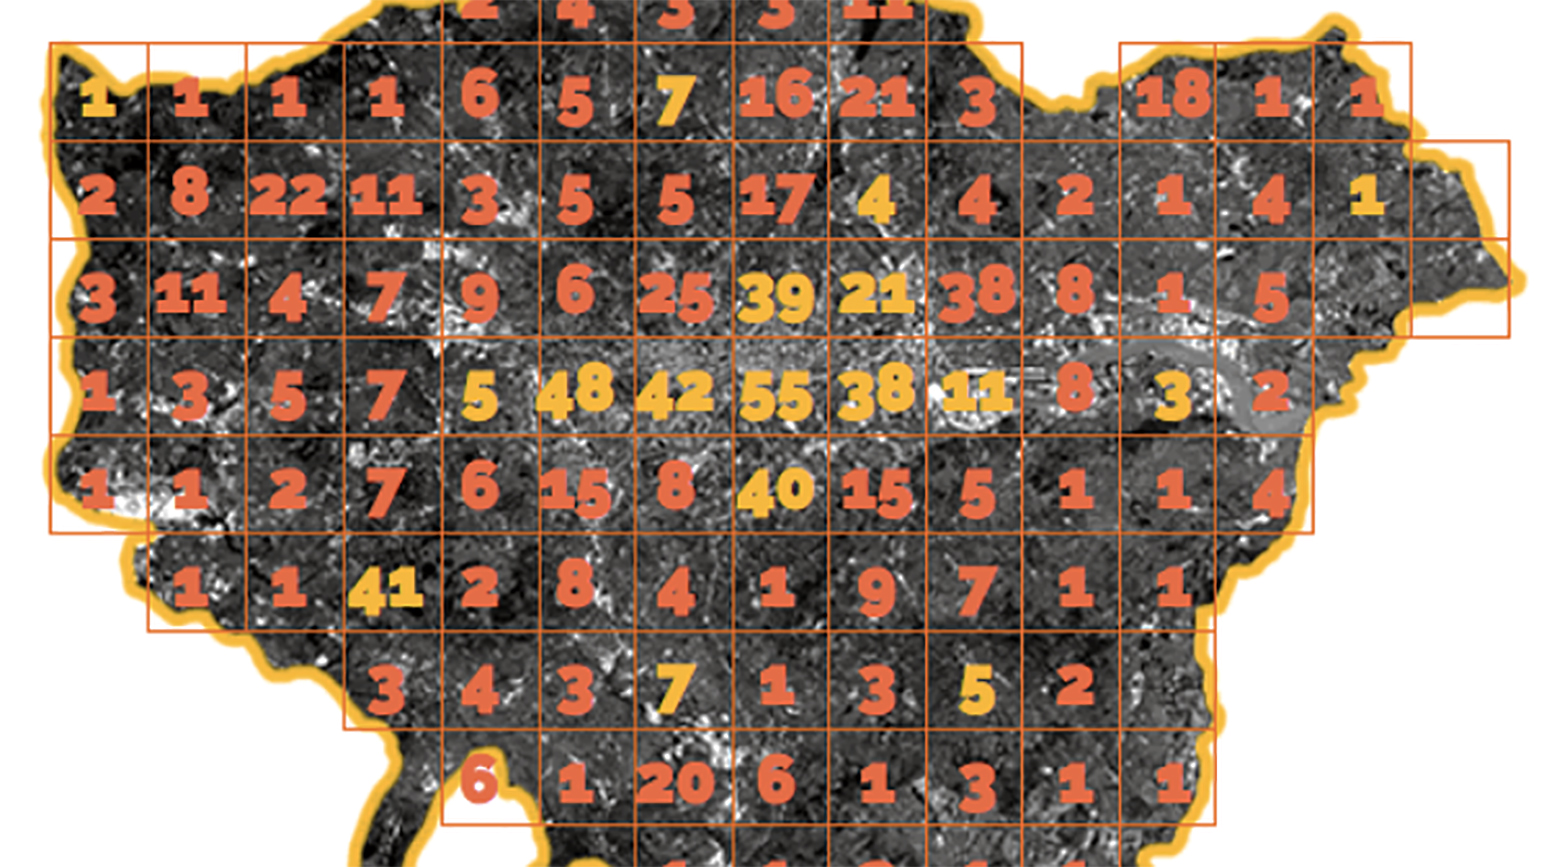
. . . The exemplary specimen of what were labelled, in the early 1980s, the ‘chattering classes’, was Islington Man (*). Both terms described a certain type of city-dwelling British liberal, self-assuredly spouting enlightened opinions on how to improve society at large, and indeed the world in general. One of the early highlights in Islington Man’s existence was the release in 1984 of the Band Aid charity single Do They Know It’s Christmas? After that, not much more was heard of him. Indeed he may have become extinct. Maybe for lack of an Islington Woman. . In this new century, opinions – high-minded, interesting, or otherwise – are exchanged online rather than at the dinner table. Chatter has a new gold standard: Twitter. The microblogging site, best resumed as “the web’s text message service” (at max. 140 characters per tweet), is only four years old, but already counts over 100 million subscribers. These generate 750 tweets per second, or 65 million per day, or 4 billion in this year’s first quarter alone. . It’s not yet clear if the twittering classes of today are direct descendants or rather more distant relatives of their chattering antecedents. But this map does show that the HQ of blah has moved: Islington Man has yielded to the Soho Twit. . This tweetograph translates location and amplitude of twitter traffic in London (**) to a format we instinctively understand: a contoured map. It borrows from your basic standard relief map the isolines (each connecting locations with the same altitude) and the range of colours (bluish green, brown, beige through white for ascending altitude), in the understanding that higher altitudes chime with peaks in Twitter traffic. London’s localities are renamed to reflect the highs and lows of this nifty, post-orographic representation. . The centre of the map, and of London’s tweeting community, is the area of Central London comprising Soho Mountain and Picadilly Rock. Traffic (or altitude) radiates out from that summit fairly evenly through Westminster Rock, Waterloo Hang, Hydepark Steep, Victoria Point and Smithfield Moor. The even pattern is interrupted by a small elevation labelled Liverpool Street Hill to the east, Hackney Downs Hill further north-east, Peckham Crag to the south-east and a freestanding hill complex to the west (Holland Park Hill, White City Peak and Earls Court Hill). A smaller, single elevation to the south is called Battersea Hill. .

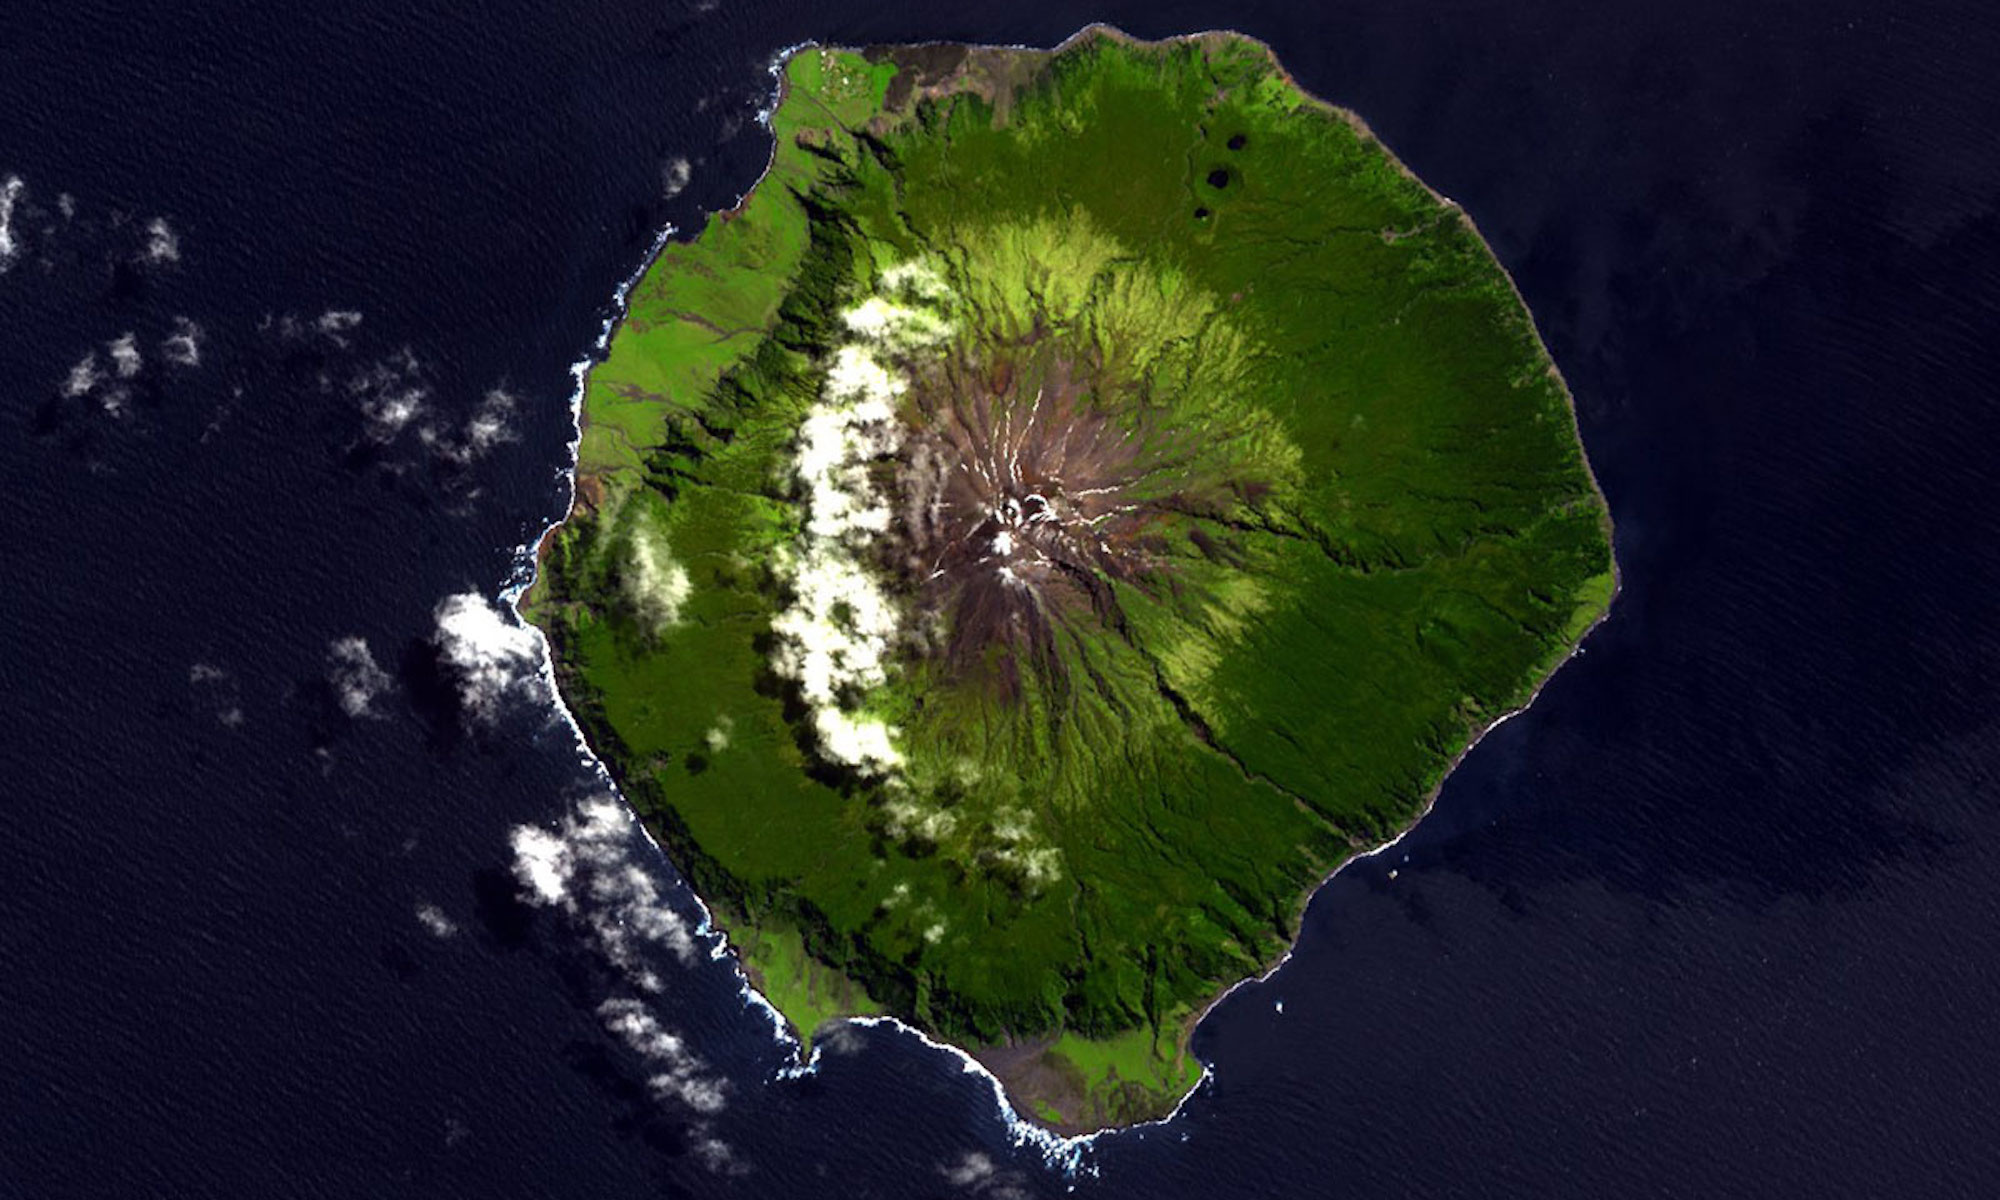
The overall appearance of London on this map with a radius of 30 km is of an island set in an encircling – and indeed circular – sea. This is reminiscent of the ancient Greek world view (discussed in #288). . The fantastic London tweetograph and similar ones detailing the local Twittersphere in New York, Paris and Munich were produced by Fabian Neuhaus of the Centre for Advanced Spatial Analysis (CASA) at University College London (UCL). Called New City Landscape Maps, they can be seen in greater detail here on Mr Neuhaus’ Urban Tick blog and on the tweetography subset of his Flickr pages. . . Many thanks to Tom Anderson, Alex den Haan, Jedidjah de Vries, Jon Morris, Matt Schneider and Joel Winten for sending in this map, which was also discussed here on Londonist and here at the Daily Mail. . ——————– . (*) Note the slightly derogatory tone in both labels, the former referring to the inane nature of the communication thus described, the latter a pastiche of Piltdown Man, Java Man and other eagerly studied species of early humans (some of which turned out to be fakes). . (**) Based on data for May 2010, taking into account tweets sent from mobile devices that include geospatial information at time of message.