Nobody Lives Here: Mapping Emptiness in the U.S. and Beyond

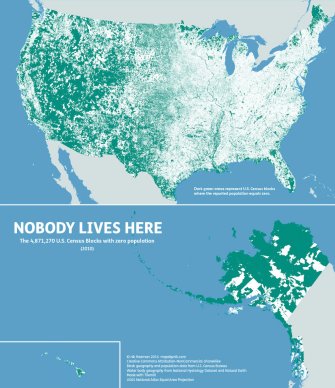
How do you map emptiness? Henry Holiday gave it a go in 1876, when he illustrated the Lewis Carroll poem ‘The Hunting of the Snark’ (see #93). Nikolaus M. Freeman, a.k.a. ‘maps by nik’, gave it another go last year, and his example spawned a few noteworthy tributes. As he said this about his work – a stunning view of the United States, with the empty bits highlighted in green:
“Human geographers spend so much time thinking about where people are. I thought I might bring some new insight by showing where they are not, adding contrast and context to the typical displays of the country’s population geography”.
Nik used data from the 2010 Census to identify ‘empty’ census blocks. Census blocks are the smallest area units used by the U.S. Census Bureau. They can be as small as a city block, but are typically much larger in rural areas. Their number is not fixed; population growth may lead to a census block being split up. For the 2010 Census, 11,078,300 census blocks were used. The reported population for 4,871,270 of those was… zero. That’s just short of 44% of the total number of blocks. Those empty blocks add up to 4.61 million square km (1.78 million sq. mi), which corresponds to just under 47% of the total area of the United States.
So, despite having a population of 310 million – the world’s third largest, after China and India – close to half of the U.S. is bereft of human habitation.
Does that mean that one of the most populated countries in the world is half wilderness? Hardly. Yes, those empty census blocks include large wilderness areas, filled with uninhabitable mountains, impassable deserts, off-limits nature reserves and other places where nobody lives. However, uninhabited does not equal undeveloped. Much of the empty census blocks are made up of farmland, commercial and industrial estates, military installations, traffic infrastructure, and other areas where plenty of people pass through – but where there are no ‘heads in beds’.
Don’t assume that non-residential places are necessarily empty either – the U.S. Census doesn’t. It finds residents in the most unexpected places. In 1990, census takers counted 63 residents in New York City Census Tract No. 143, more commonly known as Central Park. By 2000, that figure had dipped to 18, rising again to 25 for the 2010 census – a 39% increase, over a decade in which the city itself only grew by 2.1%. The Census Bureau is unsure about how these residents were counted, but suggests they could be homeless people who either were counted by Census Bureau employees on forays into the park, or who completed and mailed in a census form. By the way, Central Park is not the only open space with census-counted residents. In 2010, 56 people claimed Flushing Meadows-Corona Park as their residence, while five called Greenwood Cemetery in Brooklyn home.
In general, there’s relatively little emptiness east of the Mississippi, with notable exceptions in northern Maine (the largest empty region in the eastern half of the country). Another green blob, on the Florida-Georgia state line, is a swampy area corresponding to the Okefenokee National Wildlife Refuge on the Georgia side, and the Osceola Wildlife Management Ara on the Florida side. In southern Florida, the Everglades light up green. Other notable green zones: northern Minnesota, northern Wisconsin, Michigan’s Upper Peninsula.

(click here for an extremely zoomable version of the big map)
Further west, habitation drop off dramatically about half way through Texas: the western (and southern) part is as empty as the east isn’t. Wyoming (at less than 600,000 inhabitants, the least populated state), Utah, Nevada, Arizona and New Mexico seem almost completely empty. In California, with its densely populated coastal zone and Central Valley, it’s about fifty-fifty. Alaska, which has only 0.2% of the overall U.S. population, contains a fair number of very large, entirely empty census tracts.
But zoom in on the map to find the curious exceptions to the rule, like this green splotch covering a large part of New Jersey – one of the most densely populated states.
Nik’s map inspired a few other mapmakers to repeat the principle for their own home countries. Like this map of France by @matamix. France is 31.7% empty. That’s the share of all the 1-km2 squares covering the country’s territory that are, according to population data provided by France’s statistical institute INSEE, devoid of human habitation. Nobody lives here, or as they say in France, personne ne vit ici.

As on the other maps, green indicates the empty areas. They are concentrated in mountainous areas, such as the Pyrenees on the Spanish border and the Alps, towards Italy. A much larger green area – but interspersed with more white dots and zones – covers the northeast of the country.
Could this be an after effect of the First World War, which raged across this region? Indeed, the French government defined a so-called Red Zone after the war, a string of areas originally covering more than 1,200 km2 (460 sq. mi) that was judged too compromised by war for resettlement, due to unexploded ordinance (1) and/or pollution by various poisons (2). Although the Zone rouge has been greatly reduced, some restrictions still apply. However, most of the green in the northeast is due simply to a historical abundance of forests and farmlands.
Similarly, the smaller (but densely greener) zone on the southern Atlantic coast corresponds to large forested areas in Aquitaine. Corsica looks to be mostly uninhabited, especially the interior. The island covered not just in forests but for at least 25% in macchia (3), the impenetrable Mediterranean shrubland which in its French translation (maquis) also means ‘underground’ or ‘resistance’, because it offers such good opportunity for guerrilla fighters to hide themselves.
Paris, France’s capital and biggest city, is the whitest area on the map. About 20% of France’s total population lives in the Greater Paris Area alone.
Finland, having recently celebrated its 100th birthday, is just about as empty as it was back in December 1917. There are some 5.5 million Finns nowadays, compared to 3 million a century earlier. Which means that the vast country – roughly the same size as California – remains very sparsely populated: with no more than 17 inhabitants per square kilometre, it is the third emptiest country in Europe (4).

As this map shows, Finland’s population distribution is very uneven. About 85% live in urban areas. About 25% of all Finns live in the Helsinki metropolitan, which comprises just 1% of the country’s territory. In contrast, Finnish Lapland (in the north) has a population density of no more than 2 inhabitants per square kilometre. On the map, which uses data from Statistics Finland, there are white splashes on the coasts and in the south (the biggest one is Helsinki), while inland, white splashes in a sea of green shrink to dots and pinpricks towards the north. As they say in Finnish: Kukaan ei asu täällä (Nobody lives here).
And you can take that green quite literally: about 72% of Finland is covered by trees, making it the 5th most forested country in the world (5).
New Zealand is a huge country, but above all an empty one. With a population and an area roughly similar to that of Finland (6), it has a comparable population density, of 16 inhabitants per square kilometre.

But it looks a lot emptier. As this map shows, 78.21% of the one-square-kilometre squares making up its total territory are empty. Nobody lives there (in Maori: Kahore he tangata e noho ana i konei). The splashes of white are concentrated on the North Island, where 77% of the country’s total population lives. Fully one third of all New Zealanders live in or around Auckland, at the base of the Northland peninsula. Auckland is the country’s biggest city, but not its capital – that is Wellington, strategically placed on the southern tip of the North Island.
In fact, kiwis are an extremely urban species, with 73% of New Zealanders living in the 17 main urban areas and 54% living in just the four largest cities (Christchurch and Hamilton, plus Auckland and Wellington).
That explains the large swathes of green on the map. And yes, it would look quite differently if it counted sheep instead of people, although the country doesn’t count 20 ruminants per human, as is often believed.
Sheep numbers peaked in 1982, when there were just over 70 million sheep in New Zealand. At that time, there were just 3.2 million people in the country, which does work out to 22 sheep per person. But according to a recent statement by Stats NZ, the country’s official data agency, there are about 30 million sheep in New Zealand, which gives a sheep-to-people ratio of just about six. That’s still one of the highest rates in the world, and more than double the figure for Australia.
And finally, a UK version of the map uses yellow for blocks without reported human habitation.

The map shows a total of 114,421 grids measuring 1 by 1 km. Based on data from the most recent census (2011), 1,784 of these have no permanent inhabitants. Combined, those yellow-coloured empty grids produce this map, which shows huge tracts of open space in the north of Britain. Except for its densely populated central belt, Scotland is predominantly yellow.
South of the Scottish border, it’s a different story. The dark blobs of London and other major metropolitan areas give England a predominantly blue appearance. But there are some yellow zones and pockets, in the north of England but even in the south (for example Dartmoor National Park, in the southwest). In mid-England, the Peak District inserts a sliver of yellow in between the conurbations around Manchester (to the west) and Sheffield (to the east). Snowdonia, the northwestern part of Wales looks, as empty as parts of Scotland.
Northern Ireland is fairly evenly populated – that yellow blob in the middle is Lough Neagh – except for some areas in the west and north. The dearth of uninhabited space across much of England raises the question whether there remains much land left to develop. Certainly, if we take forestation as a gross measure of land still available for repurposing, then the UK is almost full: only 11.8% of the country is covered by trees, which puts it in the league of Morocco, Rwanda and Somalia. In the EU, only the Netherlands (11.1%), Ireland (8.8%) and Malta (>1%) do worse.
Map of the U.S. by Nikolaus M. Freeman, found here on his site, maps by nik. Map of France by @matamix (his site here), found here on Reddit. Map of Finland by hezec, found here on Reddit. Map of New Zealand by Andrew Douglas-Clifford (here’s his site), found here on Whale Oil. Map of the UK by Georgia Corr (her page here), found here on ART + marketing.

Strange Maps #878
Got a strange map? Let me know at [email protected].
(1) The Sécurité civile estimates that it will take about 700 years to completely clear the area of unexploded ammunition buried in the soil.
(2) In a few isolated areas, arsenic constitutes up to 17% of soil samples, and 99% of plants die.
(3) the scent in early summer is so typically ‘Corsican’ that Napoleon, sailing in the Mediterranean, is said to have recognised the island of his birth by its smell alone.
(4) After Iceland (3 inhabitants per square kilometre) and Norway (13/km2)
(5) Excluding small island nations such as Micronesia (89.7%), the Seychelles (89.5%), Tuvalu (89.1%), Palau (87.1%) and the Solomon Islands (79%), the four most forested nations are, in descending order: Suriname (90%), Gabon (85%), Mozambique (78%) and North Korea (73%).
(6) Well, roughly. Total area for New Zealand is 270,467 km2 (104,428 sq. mi) and 338,424 km2 (130,666 sq. mi) for Finland. Population-wise, there are 4.8 million kiwis versus 5.5 million Finns.