Infographic: How dangerous is your daily commute?

Those of us who commute to work every day are well aware of how much time it sucks out of our lives, a kind of neither-here-nor-there existence that happens between places. It’s so boring and aggravating that it’s easy to lose sight of the risk involved: Some unlucky commuters never arrive at their destination. Injury Claim Coach, a company concerned with Things That Go Bump In the Car, has pulled together and visualized statistics from the National Highway Traffic Safety Administration’sFatality Analysis Reporting System (FARS) with data from between 2012 and 2016. Injury Claims Coach’s infographics show just when and where one is most likely to die while driving to work or back home.
All visualizations below are by Injury Claim Coach.
Just how lethal is commuting?
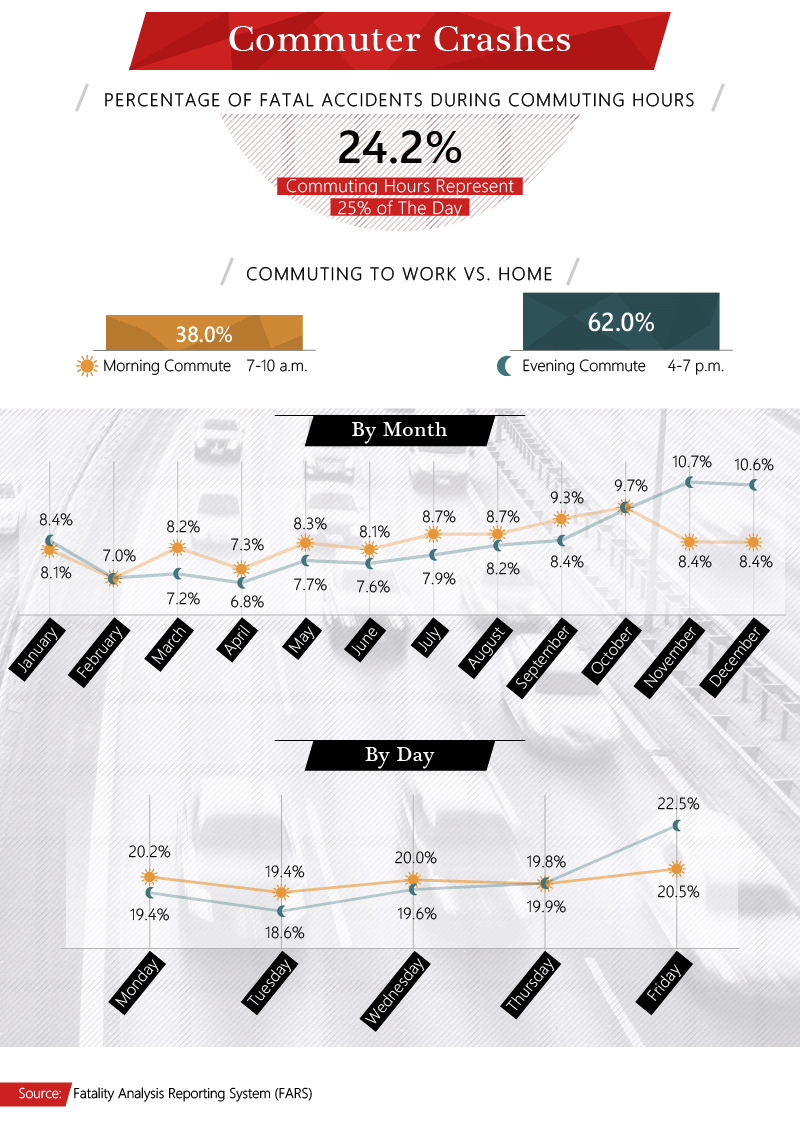
2016 was the most lethal year since 2007 for American drivers, with nearly 40,000 people losing their lives in accidents. To assess how many of those were commuting-related, Injury Claim Coach tracked fatalities by the times of day in which they occurred. They concluded 24% of them, or 1 in 4, occurred during morning or evening drive times. Taking a train is definitely safer. Or a bus.
Evening claimed the lion’s share of deaths: 62%. The most dangerous day is, interestingly, Friday, so celebrating the start of the weekend before arriving home is getting a little ahead of oneself. And September and October are especially deadly months—iffy weather, slippery leaves on the roads?
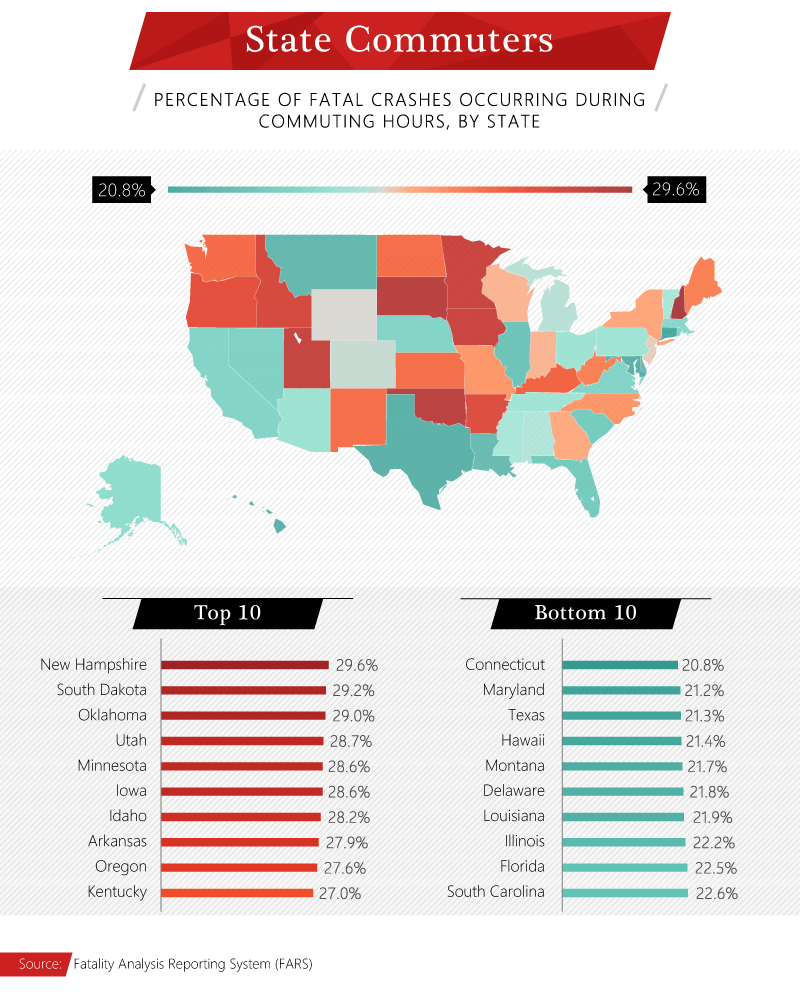
The states with the highest percentage of commuting fatalities
As car-centric as California is, you’d expect it to rank high in the list of deadliest commuting states, but, nope, with the exception of Sonoma County. Quiet New Hampshire, of all places, is the most dangerous commuting state and rapidly getting worse, followed by South Dakota, Oklahoma, and Utah. While neighboring Connecticut’s roadway death toll is rising, too, it’s also currently the safest commuting state, followed by Maryland, Texas, and Hawaii.
The most deadly drive time hours
In the FARS statistics, from 5-6 pm is the most lethal time to be commuting. Are drivers more hassled then, or more tired and with slower reflexes, or maybe even nodding off? The stats don’t really say, though a third of Americans report having fallen asleep while driving at some time. Morning drive time shows less of a peak, though between 8 and 9 am is slightly more risky than the two hours before and after.

The crashiest counties in the U.S.
York County in South Carolina is the county with the highest percentage of commuting fatalities in the country, 34.4%. Not far behind are the rest of the worst, with about 1 in 3 deaths occurring during commuting hours, beginning with California’s Sonoma County.

Injury Claim Coach has also built a cool—maybe “chilling” is a better word—interactive map of counties with the most overall commuting fatalities, the most morning ones, and the most evening crashes. It’s at the bottom of their page.
A commuting jungle out there
Really, it makes sense that drive times see so many fatalities. They’re times of day when the roads are especially congested with people, many of whom are on autopilot after months or years driving the same route. Commuters’ moods may also be a factor, whether they’re peeved at traffic or just eager to get where they’re going. Most don’t really have a choice but to do the whole thing drive after day. Here’s hoping these visualizations, um, drive home the point that taking a car to work or home deserves all the care and energy you can muster, no matter how boring it may be.
Will we still be driving cars in 2027?