Where Not to Eat in London
Most tourist guides offer advice on where to eat. This map of London shows you where not to.
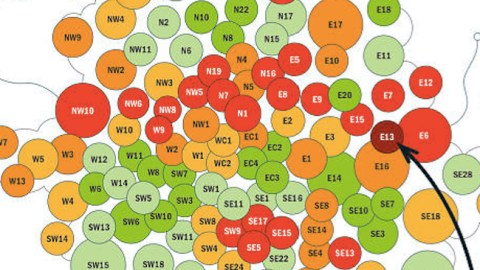
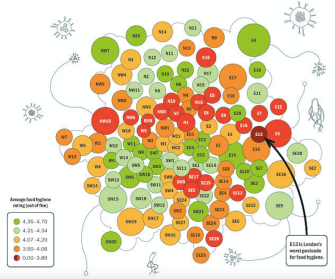
The map shows Central London postcodes, colour-coded for average food hygiene ratings. A band of worst-rated areas (in red) traverses the city from NW10 in the west to E6 in the east. There is a smaller cluster of four ‘red’ postcodes in south London (SE5, SE15, SE17 and SW9), plus two more isolates in the south, and one in the north.
‘Red’ areas generally are surrounded by postcodes coloured dark and light orange, each for a slightly better food standards category. The best food safety postcodes (dark green) also tend to cluster, and are also generally flanked by the adjacent category (light green). Only very rarely do the best and worst food categories touch (as happens in the case of dark-green E20, bordering dark-red E9 and E15).
The Food Safety Map of London Postcodes is the work of data scientist Mark Dunne, who writes on his website about the genesis of the project: “While recovering from a dodgy curry in London, I decided I wanted to look deeper into food standards across the city”.
Dunne scraped data published online by the British government’s Food Standards Agency, obtaining food ratings (one to five stars) for 515,748 locations across the entire UK, as well as their name, longitude and latitude, and postcode.
Cleaning up the data, Dunne encountered some bizarre data fails. Most of the locations in Northumberland – about 60,000 – had no ratings attached. And the manually entered data contained over 100 different spellings of McDonald’s.
A more reassuring result: most of the 431,758 locations throughout the UK for which good data was available, had a five-star rating. These included many of the restaurant chains. The aforementioned Mickey D’s, but also Burger King and Subway all had perfect 5 out of 5 ratings. Notable exception: KFC, “falling quite a bit below the national average. In fact, KFC was among the lowest of even its cheaper fried chicken competitors”.
“The next stat really surprised me”, writes Dunne “I would have thought that food hygiene in the capital would have been held to a higher standard than elsewhere in the country, but the opposite is true”.
In fact, out of 16 major cities in the UK, Glasgow has by far the best average food hygiene rating (>4.8), while London (+/- 4.1) is well below the national average (>4.4) and battling Leicester for last place.
His statistically grounded advice on eating out in London: “Next to the river, you’re pretty safe. But enter the band to the north, or that localised pocket to the south, and you’re straying into unknown territory”.
The map also indicates the postcode with the absolute worst average rating: E13, in the east of London. If you have a sensitive stomach and are wondering which area to avoid: here is a map of E13.

Many thanks to Jeremy Hoogmartens for sending in this map, found here on TimeOut‘s London page. For more on Mark Dunne’s methodology, check this page at his website. E13 map taken from Google Maps.
Strange Maps #855
Got a strange map? Let me know at[email protected].