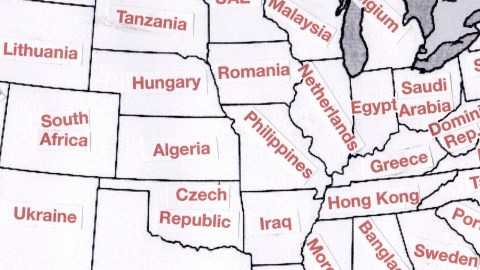
GDP Soulmates: Does Your US Home State Have the GDP of an Entire Country?
Is America still Number One? Depends on which metrics you use. By at least one measure, China’s economy already is the world’s biggest (1). Other criteria still put the U.S. ahead, at least for a few more years.
This map presents another way to gauge the size of the American economy, and one less prone to the ‘declinism’ of the eternal comparison to China.
By comparing states with countries that have a similar GDP, it demonstrates the formidable size of the U.S. economy. Irrespective of whether it’s second or first, it’s as big as the GDPs of these 51 countries put together.

This map is updated for 2015. An earlier version was published on this blog back in 2007 (see #131). According to IMF figures, U.S. GDP stood at $14.5 trillion back then. The 2007 article itself mentions $13.2 trillion, a projection taken from that year’s CIA World Factbook – and an indication that not all the figures necessarily match up.
The GDPs listed for the 2007 map are those of the countries, while this 2015 map uses the figures for the states. Despite some discrepancies, the big picture will still be correct.
The figures used for the updated map are from the Bureau of Economic Analysis (for the U.S. states) and the IMF (for the countries). According to the IMF, overall GDP for the U.S. has increased to $17.9 trillion.
Some things have remained the same: California and Texas still are the #1 and #2 economies in the U.S., and their GDPs are still in the same ballpark as France and Canada, respectively. The third-placed state’s economy is still comparable to South Korea’s, although that state is no longer Florida (down one place, to 2015’s Indonesia) but New York (surging four places, from 2007’s Brazil).
Nevada lost most ground, from 22nd place in 2007 (when its economy was about the size of Ireland’s GDP, at $203 billion) to 34th in 2015 (its $140 billion GDP roughly comparable to New Zealand’s).The biggest winner was Maryland, up from 26th place in 2007 (in the neighborhood of Iran’s $195 billion GDP) to 15th place in 2015 (with a $361 billion GDP comparable to Austria’s).

A few caveats: not all countries mentioned on the first map return on the second one; to avoid using the same country for multiple states, sometimes the country with the next-best fitting GDP is chosen, even if off by a some billions; and both data sets are in flux, so the country ranking per se has changed as well.
Considering all that, it’s still interesting to see not just how Hawaii matches up with Sri Lanka, but also how they fare better than either Maine or Belarus, and worse than both Kansas or Iraq.
Strange Map #789
Got a strange map? Let me know at [email protected].
(1) According to the IMF, China’s GDP in 2014 stood at $10.3 trillion in absolute figures, versus $17.6 trillion for the U.S. However, adjusted upward for PPP (Purchasing Power Parity, i.e. how much more a dollar buys you in China than in the U.S.), China’s economy was worth $17.6 trillion – slightly more than the American economy, pushing the U.S. into second place for the first time since 1872 – before that, Britain was the world’s largest economy.