How to Fingerprint a City
Thanks to Big Data, a new “Science of Cities” is emerging. Urban processes that until now could only be perceived subjectively can finally be quantified. Point in case: two French scientists have developed a mathematical formula to ‘fingerprint’ cities.
Take a good, close look at your fingertips. The pattern of grooves and ridges on your skin there [1] is yours alone. Equally unique is the warp and weft of urban road networks. No two cities’ street grids are exactly alike. Some are famously distinct. The forensic urbanist in all of us can probably recognise a blind map of New York, London and a few other global metropolises.
Rémi Louf and Marc Barthelemy examined the street patterns of 131 cities around the world. Not to learn them by heart and impress their fellow scientists at the Institut de Physique Théorique near Paris – although that would be a neat parlor trick. They wanted to see if it would be possible to classify them into distinct types. The title of their paper, A Typology of Street Patterns, is a bit of a giveaway: the answer is Yes.
Before we get to the How, let’s hear them explain the Why:
“[Street and road] networks can be thought as a simplified schematic view of cities, which captures a large part of their structure and organization and contain a large amount of information about underlying and universal mechanisms at play in their formation and evolution. Extracting common patterns between cities is a way towards the identification of these underlying mechanisms. At stake is the question of the processes behind the so-called ‘organic’ patterns – which grow in response to local constraints – and whether they are preferable to the planned patterns which are designed under large scale constraints”.
There have been attempts before to classify urban networks, but the results have always been colored by the subjectivity of what Louf and Barthelemy call the ‘Space Syntax Community’. That’s all changed now: Big Data – in this case, the mass digitization of street maps – makes it possible to extract common patterns from street grids in an objective manner, as dispassionately as the study of tree leaves according to their venation.

City blocks (r.) are easier to define than streets (l.)
If one considers street grids as networks, with intersections as the nodes and street segments as the links between them, it becomes clear that classification should not just rely on proximity (i.e. the spatial distribution of betweenness), but also on geometry (i.e. the spatial distribution of the nodes). The researchers extracted information on city blocks (easier to define than streets) from 131 maps of cities on all inhabited continents, and defined these by area (A) and shape (Φ). The value of Φ is always smaller than one, and the smaller it is, the more anisotropic it is. Meaning that its properties differ according to the direction of measurement.

Tokyo (top) and New York (bottom) as you’ve never seen it.
Both factors are important in distinguishing cities from each other. For example: New York and Tokyo city blocks are quite similar for shape (Φ), but not in area (A). To visualise the difference, Louf and Barthelemy plotted the blocks on a graph, arranging them by shape (Φ) on the x-axis (the horizontal line), and by area (A) on the y-axis (the vertical line). Dividing the range into colors for different area categories, the result are distinct fingerprints for Tokyo (top) and New York (bottom).

The sum of all curves: Tokyo (top) vs. New York (bottom)
Visualised another way, the Tokyo blocks are represented by colored curves (top), each representing the distribution of Φ in an area category. The grey area represents the sum of all curves. Ditto for New York (bottom). Although the grey curves, totalling the colored ones, resemble each other, the pattern for the area categories is entirely different.
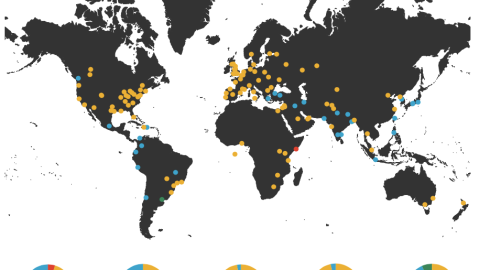
It’s these differences in area and/or size that allowed the researchers to categorize the 131 urban fingerprints they gathered into 4 distinct categories:

Interestingly, these groups are distributed unevenly throughout the world. Group 3 totally dominates North America (all cities except Vancouver) and Europe (everywhere except Athens), but is challenged more in other parts of the world.
The researchers also found that a number of cities in North America belonged to the same subgroup of Group 3 as almost all European cities, which would explain why they have such a ‘European’ feel. Those cities: Indianapolis, Portland (OR), Pittsburgh, Cincinnati, Baltimore, Washington DC and Boston. “These results point towards important differences between US and European cities, and could constitute the starting point for the quantitative characterization of these differences”, Louf and Barthelemy write.

New York’s five boroughs…
After which they proceed to fingerprint the five boroughs of New York, finding that “[w]hile Staten Island and the Bronx have very similar fingerprints, the others are different. Manhattan exhibits two sharp peaks at Φ ≈ 0.3 and Φ ≈ 0.5 which are the signature of a grid-like pattern with the predominance of two types of rectangles. Brooklyn and Queens exhibit a sharp peak at different values of Φ, also the signature of grid-like patterns with different rectangles for basic shapes”.

… fingerprinted.
Despite the limitations of the still young science of urban fingerprinting, the researchers express the hope that “[this] is an encouraging step towards a quantitative and systematic comparison of the street patterns of different cities, [which] should lead to a better understanding of the shape of our cities”.
Images reproduced with kind permission of the authors. Read their entire paper here. Many thanks to Satyam for the tip!
Strange Maps #691
Got a strange map? Let me know at strangemaps@gmail.com.
[1] not only on your fingertips, but also on the palms of your hand, your toes and the soles of your feet.