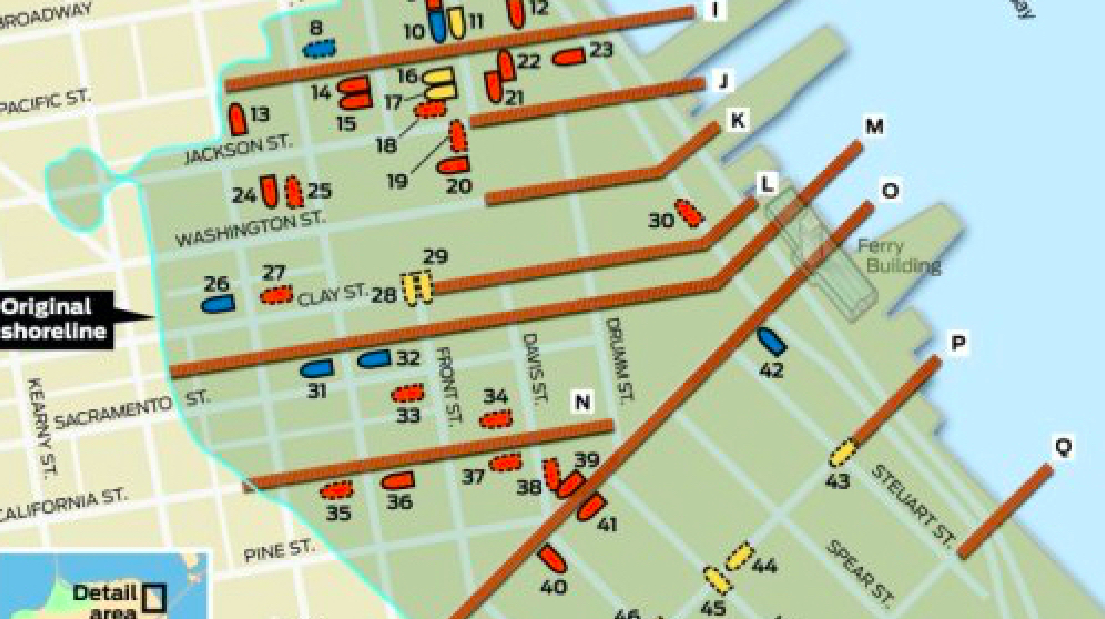
468 – Crime Topography of San Francisco
Key Takeaways
- Many maps peak in the Tenderloin District (in the north-east).
- Some crime is extremely concentrated (e.g. narcotics), others are more spread out (e.g. vehicle theft);
- Prostitution arrests mainly occur around Shotwell Street, one of the frankly quite numerous toponyms in San Francisco that can be interpreted in a lewd manner.
- A valley dividing the peaks in the Mission and the Tenderloin is the location of the 101 freeway.
Sign up for the Smarter Faster newsletter
A weekly newsletter featuring the biggest ideas from the smartest people
.
n

n
n
n

n
n
To my admittedly vague recollection, The Streets of San Francisco was a mid-Seventies tv series very appropriately named after its main character. I was too young to follow any of the cop show’s plot. Until a few moments ago, I didn’t even recall that its stars were a young Michael Douglas partnered with the eternally avuncular Karl Malden. But I do remember the car chases, mainly because they were set on the improbably-angled, gravity-defying streets of San Francisco.
n
.
n
When I say remember, I exaggerate. Those car chases have melded into a single Generic San Francisco Car Chase, for which you need: several police cruisers, sirens wailing, in hot pursuit of a getaway vehicle (all cars preferably pre 1980); a route down precariously steep streets (rarely up, for obvious speed-related reasons); the cars giving chase in permanent near-collision with the cross-traffic on level avenues and bending their fenders in a constant bump and grind on roads not inclined to accommodate high speeds; and to top it all off, split-second views of the Golden Gate Bridge and Alcatraz, both parked on the glistening blue waters of the Bay below the city.
n
.
n
San Francisco’s iconic topography – with grades of up to 31% – is as much a tourist attraction as its cable cars or the sea lions at Fishermans’ Wharf. But the city’s hilliness is more than just ankle-biting eye-candy. Its elevation, mainly in the city’s centre, is responsible for a 20% variance in annual rainfall throughout its eastern and western precincts, with bay-fronted neighbourhoods in the east also significantly less cold, windy and foggy than those facing the ocean.
n
.
n
These maps present San Franciscan peaks and troughs of a different, less savoury kind. Although the information they convey is as real as the city’s actual orography, these infographics express incidence of crime rather than elevation above sea level. By mimicking cartographic methods of height demarcation, the mapmaker has hit upon a visually very arresting method to frame raw crime statistics in a geographic context.
n
.
n
These maps were made by Doug McCune, who plotted the 2009 data for eight different types of crime out on a map of San Francisco. Mr McCune produced two map versions for each type of crime, a satellite view and a bird’s eye view. The latter’s more slanted perspective works better for presenting ‘hilliness’.
n
.
n
Mr McCune goes on to comment on some of the resulting crime topography of San Francisco, which I shall summarize here:
n
nn
n
.
n
If only Messrs. Douglas and Malden had known about this back in the day…
n
.
n
n
.
n
Many thanks to all who sent in these maps (found here on Mr McCune’s blog): Andrew M. Galleni, Geoffrey Engelstein, Brian Kavanaugh, John O’Brien, Jeff Crocombe, Kate Loux, Taed Wynnell, Kelley Ketchmark, Sarah Schoenfeldt, Elise K and Brian Ogilvie.
n
n
n
n
Sign up for the Smarter Faster newsletter
A weekly newsletter featuring the biggest ideas from the smartest people