Obesity in America vs Europe: Two maps explain it all
In Rubens’ time, to pack a few extra pounds was the privilege of the powerful. Hence the adjective Rubenesque, describing the curvaceous ladies that fill out his paintings, who were rotund because they were rich, and all the more desirable for it.
A few centuries on, thanks to industrial farming, food is no longer a status symbol and the specter of famine has receded from our collective consciousness. In fact, food abundance is such that the link between calorie intake and social status has not so much been obliterated as it has reversed.
In the developed world, virtually everybody now has easy access to cheap, high-calorie fast food and ready meals. Keeping the pounds off requires more time, effort and money than most people can afford. Especially if you live in a ‘food desert‘, where fast food is plentiful but the elements of a healthy, balanced diet are difficult to find.
As a result, the average Body Mass Index (BMI) has shot up across the developed world (and beyond). BMI is a measure of body fat based on an adult’s height and weight (here’s how to calculate yours).
If your BMI is under 18.5, you’re commonly accepted as being underweight. The ‘normal’ weight range is from 18.5 to 25. You’re overweight from 25 to 30, and obese if you’re over 30. Obesity is a medical condition. It means you’ve accumulated enough body fat for it to negatively impact your health. If you’re obese, you have a higher risk of getting diabetes, osteoarthritis and certain types of cancer and/or cardiovascular diseases.
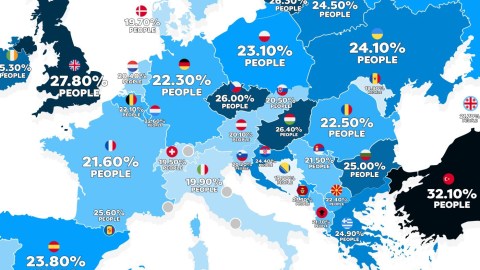
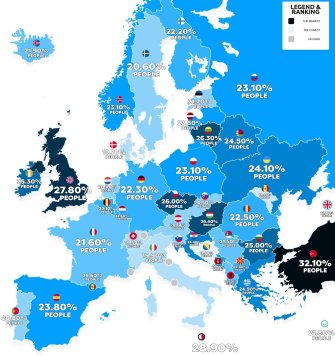
Even though obesity affects a rapidly growing number of people, the share of people with a BMI>30 shows a remarkable variation across national and state borders. This map of BMIs in Europe shows Turkey as the outlier in Europe, not just geographically but also with reference to BMI. The country on the southeastern edge of Europe has the highest score, with nearly one in three Turks (32.10%) being obese.
Number two at a fair distance, but way ahead of its immediate neighbors, is the UK, with well over a quarter of the adult population being clinically overweight. The rest of the top five, all at or just above 26%, are all in Eastern Europe: Hungary, Lithuania and the Czech Republic (in that order).
If, as indicated above, higher levels of obesity could be linked to higher levels of poverty, can national BMI levels be interpreted as an indication of a country’s overall wealth? As this map indicates: probably not—at least not in isolation.
Take the countries with the continent’s lowest rates of obesity, Bosnia (17.90%) and Moldova (18.90%). They are among the continent’s poorest. Curiously, however, the next-best scoring countries are all high-income countries: Switzerland (19.50%), Denmark (19.70%) and Italy (19.90%).
Could it be that Moldova and Bosnia are too poor even to have the ‘basic’ fast food infrastructure present in food deserts elsewhere? And have Denmark, Switzerland, and Italy—surely rich enough to have easy access to greasy foods—developed successful coping strategies, say: constant exercise and healthy eating as desirable lifestyles?
Perhaps, but then the mystery is why the Norwegians (23.10%) score so much worse than their fellow Scandinavians in Denmark (and Sweden). Or why Portugal (20.80%) scores so much better than their otherwise fairly similar neighbors in Spain (23.80%).
While we’re comparing: how are the Americans doing? The map above shows the percentage of adults in each country with a BMI higher than 30 and is based on WHO data for 2017. The map below does the same for U.S. states, and for the same year.

West Virginia leads the nation, with a whopping 37.7% adult obesity rate. Four more states have a score over 35%, all in the Deep South: Arkansas, Louisiana, Mississippi, and Alabama. That still leaves seven high-BMI-level states before the average drops to the level of Europe’s worst offender, Turkey—with South Carolina (32.10%) and Nebraska (32%) achieving nearly similar scores.

In all, nearly half the states have an adult obesity rate of more than 30%. Interestingly, there is a clear geographic division, not just as far as four of the five worst-performing states are concerned, but also when it comes to the better-performing ones. With the exception of Hawaii, Florida, Minnesota, Maryland and Virginia, all states with adult obesity levels below 30% form two contiguous blocks, out West and in the Northeast.
Still, the success of the best-performing states is relative, as shown in the table below, ranking both U.S. states and European countries by their adult obesity rates. Colorado, the state with the lowest adult obesity rate (22.3%) scores just as high (or low) as Germany, firmly in the middle of the European ranking. California, with the fifth-lowest figure in the U.S., has exactly the same rate of adult obesity—one in four—as Bulgaria, which has the ninth-highest adult obesity rate in Europe.

European map found at Terrible Maps. American map found here atState of Obesity. Graph by Ruland Kolen.
Strange Maps #889
Got a strange map? Let me know at [email protected].