Why not even Minnesota is safe from quakes
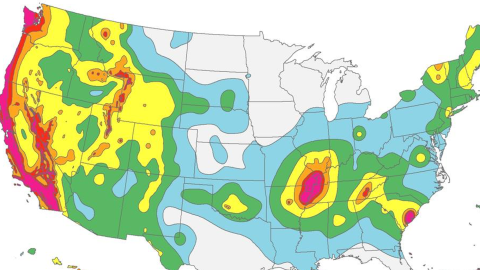
Image: USGS, public domain
- Californians, want to run away from the Big One? Head for Minnesota.
- As this map shows, the Gopher State is the least likely to be hit by earthquakes.
- Choose your new home wisely, though: even Minnesota has one earthquake-sensitive spot.

The Long Beach earthquake hit on 10 March 1933 with an estimated magnitude of 6.25 on the Richter scale.
Image: Nathan Callahan, CC BY 2.0
Not if, but when
It’s not if, but when: Californians live with the certainty that someday, the Big One will hit.
The Big One is an earthquake with a magnitude of at least 7.8 on the Richter scale. Because of the plate tectonics at work under California, big quakes like that hit the area every 45 to 230 years.
The last one was more than 160 years ago. That’s why paleoseismologist Kerry Sieh says the next one is likely to happen “within the lifetime of children in primary school today.”
Here’s how the United States Geological Survey (USGS) rates the hazard of a major earthquake in California in the next 30 years:
- 60% chance of a 6.7-magnitude quake.
- 46% chance of a 7.0-magnitude quake.
- 31% chance of a 7.5-magnitude quake.
It should be noted that the Richter scale is logarithmic in nature, meaning that a one-point increase in magnitude (e.g. from 6.7 to 7.7) represents a tenfold increase in amplitude. So, the Big One will be considerably stronger than the highest-magnitude quake considered by the USGS. When it hits, the Big One is likely to kill hundreds, hurt thousands and displace many more. It will cause widespread damage to buildings and infrastructure and start hundreds of fires. How do you put as much distance as possible between yourself and that apocalyptic prospect? Start with this earthquake hazard map.

The earthquake hazard map of the United States.
Image: USGS, public domain
Hazard everywhere
The Pacific coast is purple: the highest hazard. The entire west is shaded in colors denoting declining hazard. Only relatively small parts of the country are covered by the zone of lowest hazard:
- central and southern Texas;
- most of Florida, Michigan, Wisconsin, Iowa, and North Dakota;
- sizable chunks of Kansas, Nebraska, Montana, and South Dakota;
- and tiny bits of Alaska, Colorado, New Mexico, Louisiana, Arkansas, Alabama, and Georgia.
One state seems hazard-free, but that’s only until you notice the blue spot in Minnesota’s western bulge.
So, what do these colors actually denote? Earthquake hazard maps show the potential shaking hazard from future earthquakes.
The USGS defines earthquake hazard as the probability of ground motion over 50 years. That probability is determined by a region’s geology and earthquake history.
The location of fault lines alone is not enough to determine quake hazard: a large earthquake can produce tremors at a relatively large distance from the actual fault line.
The colors on this earthquake hazard map correspond to Seismic Design Categories (SDCs), which reflect the likelihood of seismic activity leading to ground motion of various intensities.

Damage caused by the 6.0-magnitude Napa County earthquake of 24 August 2014.
Image: Matthew Keys, CC BY-SA 4.0
Seismic resistance
These SDCs are used to determine the level of seismic resistance required in building design and building codes.
- SDC level A (grey): Very small probability of experiencing damaging earthquake effects.
- SDC level B (blue): Moderate-intensity shaking possible. Such shaking will be felt by all. Many will be frightened. Some furniture will be moved and some plaster will fall. Overall damage will be slight.
- SDC level C (green): Strong shaking possible. Damage will be negligible in well-designed and well-constructed buildings; considerable in poorly-built structures.
- SDC levels D0 (yellow), D1 (orange) and D2 (red): Very strong shaking possible. Damage will be slight in specially designed structures; considerable in ordinary substantial buildings, with partial collapse; and great in poorly built structures.
- SDC level E (purple): This is near major active faults capable of producing the most intense shaking. Even in specially designed structures, the damage will be considerable. The shaking is intense enough to completely destroy buildings.

Minnesota earned its blue spot in 1975.
Image: USGS, public domain
The Morris quake
This earthquake hazard map is not a snapshot of the past, but an evolving prediction of the future. The map is adapted as geological knowledge increases. But it is also partly based on past events – or more precisely the likelihood of their recurrence.
Minnesota earned its blue spot from the 1975 Morris earthquake. With its epicenter in Stevens County, it struck at around 10 am on July 9th of that year and had a magnitude of 4.6. It was the first seismic event recorded in the state since the Staples quake of 1917, and it was felt as far afield as the eastern Dakotas and northern Iowa.
Near the epicenter, plaster cracked and pictures fell off walls. In the town of Morris, two homes suffered damage to their foundations. Not quite California-sized, but for lack of comparison, probably Big Enough for the locals.
Strange Maps #1011
Got a strange map? Let me know at [email protected].