How to see slick social graphs of your favorite characters from 700 top films
You may not know what a social graph is, but you’re in one. Several ones, actually: your family, your job, your neighborhood, and probably a few more.
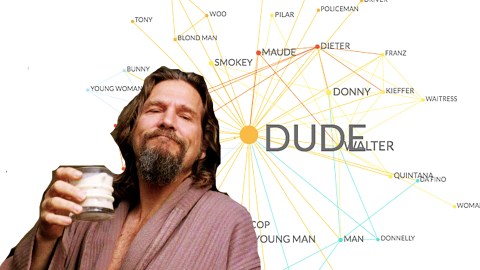
Social graphs map the relationships within social networks. Each person is a dot (or ‘node’ in graph-speak), and each connection between two nodes is a line (or ‘edge’).
Babel (2006)

The concept is simple enough, but it can illuminate the nature of complex relationships in real life, in an online environment or – as in this case – in movies.
Social graphs… Movies… Wait, is this about the Six Degrees of Kevin Bacon? Well, it’s related. The Six Degrees of Kevin Bacon is a parlor game in which movie buffs try to link a random actor (or by extension anyone in the Hollywood movie industry) to Kevin Bacon in as few steps as possible.
Lord of the Rings – The Fellowship of the Ring (2001)

The distance to the prolific actor is expressed in ‘Bacon numbers’. Kevin Bacon’s own Bacon number is 0 (Bn0). Anyone who worked with him directly has Bn1. Anyone who worked with people who have Bn1 has Bn2, and so on.
Barack Obama has Bn2: he was in Ron and Laura Take Back America (2014) as himself, with Sally Kirkland (as Sally), who was also in JFK (as Rose Cheramie) with Kevin Bacon (as Jim Garrison).
Forrest Gump (1994)

Donald Trump also has Bn2: he was in Zoolander (2001) as himself, with David Pressman (as Maori tribesman), who was also in Pyrates (1991) as Carlton, with Kevin Bacon (as Ari).
You can have a lot of fun with this over at the Oracle of Bacon, where you can type in the names of any of the 800,000 actors and film crew in the IMDB database and check their Bacon number.
The Big Lebowski (1998)

The Bacon-centred game is based on the broader concept of Six Degrees of Separation, a theory which states that any two people on the planet, no matter how culturally and/or geographically distant from each other, are never more than six acquaintance links apart.
Movie Galaxies also is about degrees of separation, but strictly within the separate universes of individual movies – in social graphs that function as cool maps to the relationships within each movie.
Magnolia (1999)

The story starts in 2011, when German student (and movie buff) Michael Schober attended a lecture at the University of Cologne on social networks – and a few days later watched Babel, the 2006 movie starring Brad Pitt.
Applying the lecture to the film, Schober immediately perceived the broad outline of the social graph underpinning the story. He went to work extracting it from the script of that movie.
Solaris (2002)

Next came Movie Galaxies, a collaboration between Schober and Jermain Kaminski, collective intelligence student at MIT in Cambridge, Massachusetts. Between them, they perfected the algorithm that analyses scripts and visualises the characters’ interaction.
Using algorithms and advanced data-processing, Movie Galaxies measures the proximity of movie characters by evaluating their ‘co-appearance’ – i.e. if, when and how often they appear together in the same scenes.
The Breakfast Club (1985)

They’ve done that for close to 800 movies now, spanning almost a century of cinema (the oldest movie graphed out is The Four Feathers, from 1915).
Movie Galaxies uses three metrics for interconnectivity: ‘betweenness’ (the relative importance of the actor in between two other ones), ‘degree’ (the number of connections each actor has) and ‘cluster’ (describing the sub-networks).
Ace Ventura: Pet Detective (1994)

So, what have Schober and Kaminski found out about movies?
“We have a hunch that the ‘holy grail’ of good movies is far more about social network structures than budget, cast and theme (…) However, we are aware of the fact that the conversation layer of a movie is just one of many layers in a story and that our results still have to be proven with accepted scientific methods”.
Still, Movie Galaxies are a handy way to summarise a movie, says Schober:
“If I had 30 seconds to explain a movie to a complete stranger I would use Movie Galaxies because it is a 10,000 feet view on the story”.
Logan’s Run (1976)

For more cinematic social graphs, check out the Movie Galaxies website.
Strange Maps #908
Got a strange map? Let me know at[email protected].
